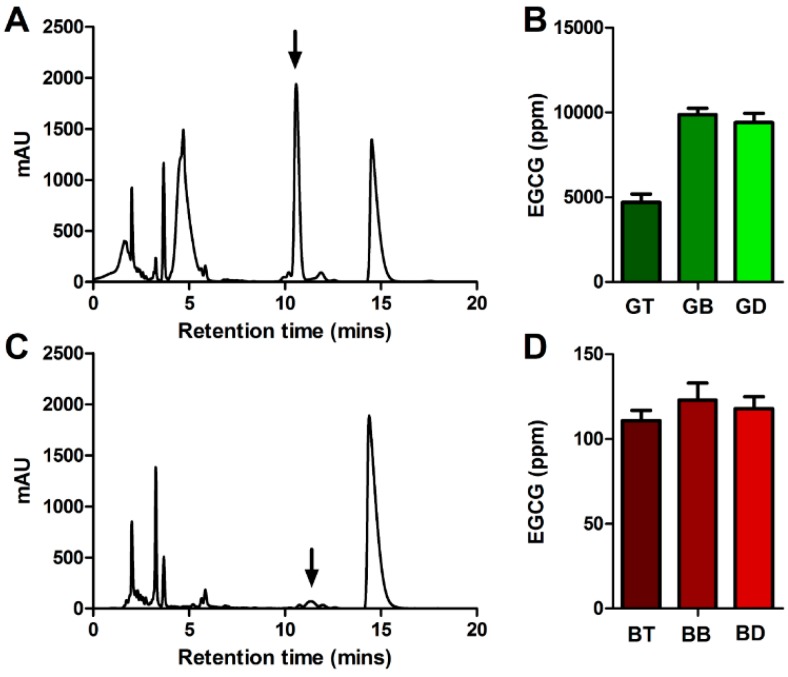
Figure 2.
(A) Chromatogram illustrative of HPLC spectrum from green tea. EGCG peak at arrow. Y axis in milli-Absorbance Units. (B) Total EGCG content for green tea in ppm, brewed in tap (GT), bottled (GB), and deionized (GD water. Display shows mean of three readings plus SEM. (C) Chromatogram illustrative of HPLC spectrum from black tea. EGCG peak at arrow. (D) Total EGCG content for black tea in ppm. Samples denoted as black tea brewed in tap (BT), bottled (BB), and deionized (BD) water.

