Figure 1.
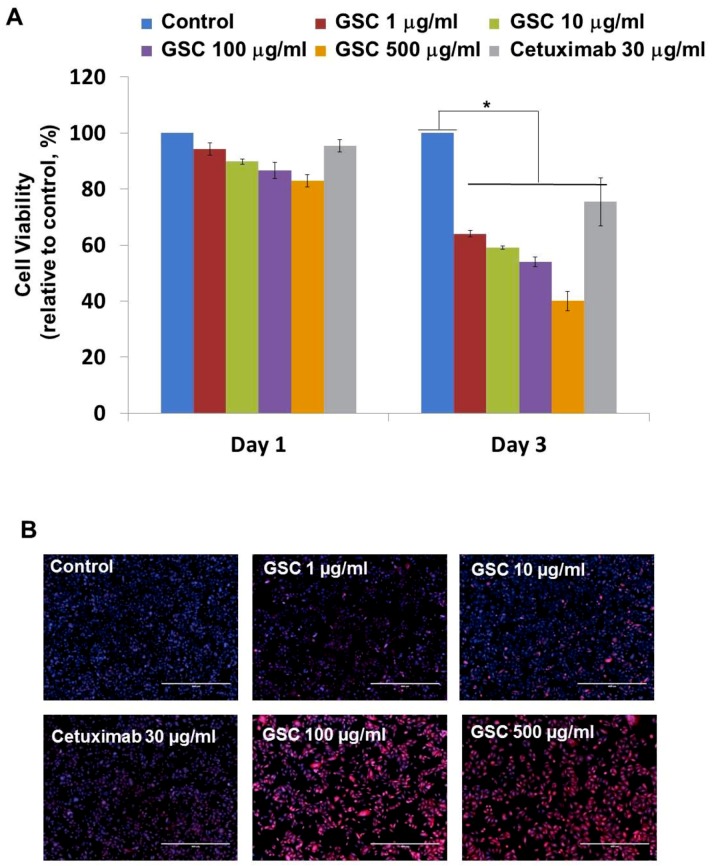
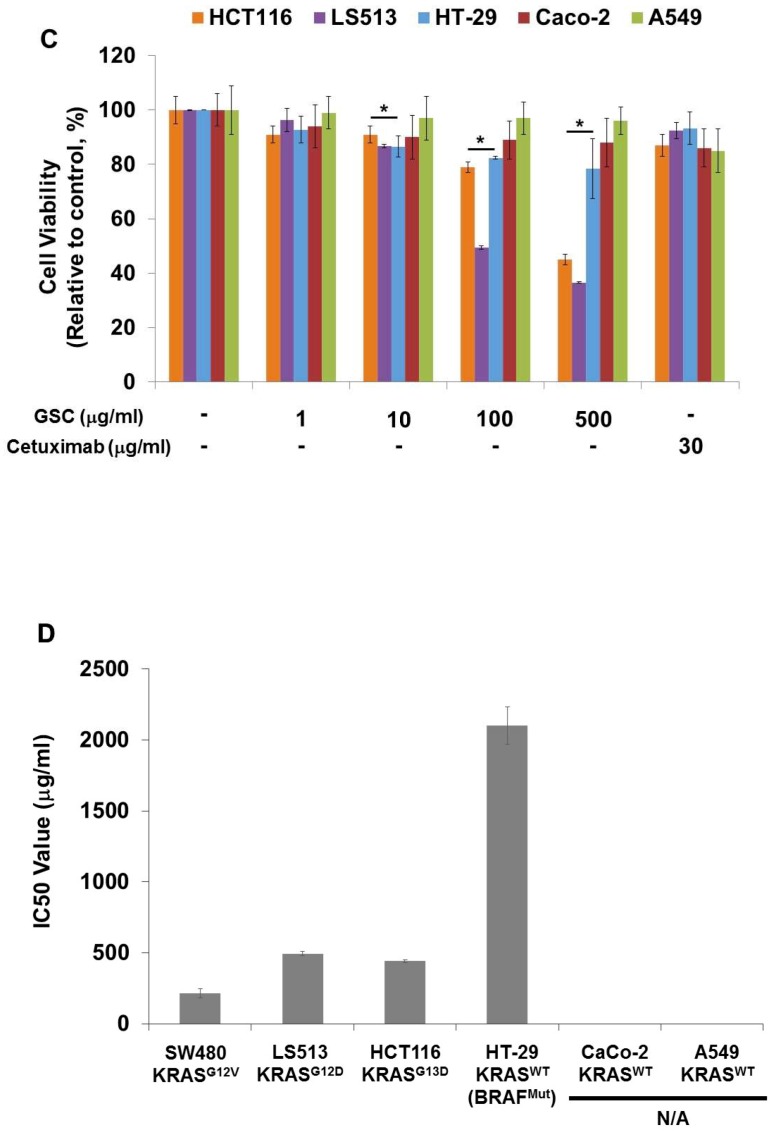
(A) Cell viability of SW480 colorectal cancer cells at days 1 and 3 with the GSC treatment (0, 1, 10, 100, and 500 μg/mL). The relative cell viability was compared to the control. The data are expressed as the mean ± standard error of the mean (SEM) and a significant difference is denoted as * (p < 0.05). (B) Representative SW480 cell images after the GSC treatment (0, 1, 10, 100 and 500 μg/mL). Blue represents the DAPI-stained cell nuclei and the propidium iodide-stained dead cells are red. (Scale bar = 500 μm). (C) Cell viability of LS513 (Kirsten rat sarcoma viral oncogene homolog (KRAS)G12D), HCT116 (KRASG13D), HT-29 (KRASWT/BRAFMut), Caco-2 (KRASWT/BRAFWT) and A549 (KRASWT/BRAFWT) during day 3 with GSC (0, 1, 10, 100, and 500 μg/mL) and Cetuximab (30 μg/mL) treatment. The relative cell viability was compared with the control. (D) IC50 values of SW480 (KRASG12V), LS513 (KRASG12D), HCT116 (KRASG13D), HT-29 (KRASWT/BRAFMut), Caco-2 (KRASWT/BRAFWT) and A549 (KRASWT/BRAFWT) cell lines at day 3 under GSC treatment. The data are expressed as the mean standard error of the mean (SEM) and a significant difference is denoted as * (p < 0.05) compared to control. GSC: Cordyceps militaris on germinated soybeans. DAPI, 4′,6-diamidino-2-phenylindole.


