

Abstract
The scaffold/adaptor growth factor receptor bound 2 (GRB2)-associated binding protein 2 (GAB2) is frequently amplified and/or overexpressed in primary high-grade serous ovarian cancers (HGSOCs). Here we investigate a novel treatment strategy by targeting SHP2 and PI3K signaling in HGSOCs with GAB2 amplification/overexpression (GAB2High). The expression of GAB2 was analyzed in primary HGSOCs and ovarian cancer cell lines. In vitro and in vivo assays were performed to demonstrate the effect of SHP2 and PI3K-mediated GAB2High HGSOC progression. Analysis of gene expression data reveals that primary GAB2High HGSOCs are associated with increased ERBB, RAS, and MAPK activity signatures. Inhibition of SHP2 by an allosteric inhibitor SHP099 selectively inhibits ERK1/2 activity, proliferation, and survival of GAB2High ovarian cancer cell lines. Treatment with SHP099 has a synergistic effect with BKM120, a pan-class I PI3K inhibitor, at suppressing proliferation and survival of GAB2High ovarian cancer cells in vitro and in vivo by more effectively activating both BIM and BAD and inhibiting c-MYC compared with individual inhibitor. Our findings identify an important role of SHP2 in promoting proliferation and survival of GAB2High ovarian cancer cells, and combinatorial SHP2 and PI3K inhibition may be a promising therapeutic approach for such cancer.
Keywords: High-grade serous ovarian cancer, GAB2, PI3K, SHP2
Introduction
HGSOC is the most aggressive subtype accounting for more than 70% of ovarian cancer death [1]. HGSOCs are often diagnosed at an advanced stage when tumors have disseminated into the peritoneal cavity [1]. The standard therapy is cytoreductive surgery followed by platinum/paclitaxel-based chemotherapy [1]. HGSOCs usually respond well to primary treatment, but recurrence occurs in most patients within 12-18 months [1]. Recurrent ovarian cancer may still be platinum-sensitive if patients have a complete or partial response for more than 6 months in the primary treatment before recurrence [1]. Treatment options for recurrent tumors include platinum-containing regimens in combination with additional chemotherapeutic agents or recently approved molecularly targeted agents including anti-vascular endothelial growth factor (VEGF) antibody, bevacizumab [2], or poly (ADP-ribose) polymerase (PARP) inhibitors [3]. Recurrent ovarian cancer that is platinum-resistant is treated with non-platinum chemotherapeutic drugs and/or in combination with molecularly targeted agents [4]. These treatment options improve progression-free survival but are often associated with increased adverse effects [4]. Therefore, new therapeutic strategies are urgently needed for HGSOCs.
Recent genome characterization studies by the Cancer Genome Atlas (TCGA) project have catalogued major genomic features of HGSOCs, including frequent mutations in BRCA1/2 and TP53 genes, and widespread somatic DNA copy number alterations (SCNAs) [5]. To analyze contribution of SCNAs to HGSOC pathogenesis, we recently performed an open reading frame (ORF) based overexpression screen in vivo to assess hundreds of ORFs representing significantly amplified genes for the ability to promote tumor growth, and identified GAB2 as a candidate oncogene [6]. High-level amplification of the GAB2 gene has been detected in 16% of primary HGSOCs, with copy number gains occurring in an additional 28% of cases [6]. Amplification of GAB2 has also been reported in 15% of breast cancer [7], and 11% of melanoma [8]. We and others showed that overexpression of GAB2 also occurs in the absence of gene copy number changes in both HGSOC and ovarian cancer cell lines [6,9,10]. A recent study has shown that overexpression of GAB2 in HGSOCs is associated with improved survival in patients [10]. Other studies have shown that overexpression of GAB2 is associated with metastatic progression and poor survival in breast cancer [11], melanoma [12], colorectal cancer [13], neuroblastoma [14], and glioma [15]. These findings suggest that amplification and/or overexpression of GAB2 plays an important role in the pathogenesis of many cancer types, HGSOC in particular.
GAB2 is a scaffold/adaptor protein that lacks enzymatic activity but mediates protein-protein interactions to regulate signal transduction of many growth factor receptors, cytokine receptors, and integrins to several Src Homology 2 (SH2) domain-containing effectors, such as SHP2 and p85 [16]. Upon ligand stimulation, the activated receptor undergoes autophosphorylation and provides phospho-tyrosine resides for recruiting GRB2. GAB2 binds to GRB2 and becomes phosphorylated at multiple tyrosine residues, capable of binding to the SH2 domains of SHP2 and p85 [16]. The interactions induce conformation changes, relieving the auto-inhibition of the SHP2 catalytic site [17] and relieving the inhibition of p85 on the p110 catalytic subunit of PI3K [18], respectively. SHP2 has been shown to activate RAS by direct dephosphorylation of RAS at tyrosine 32 [19], inhibition of RASGAP (RAS GTPase activating protein) [17] and SPRY (Sprouty RTK signaling antagonist) [20]. Overexpression of GAB2 has been linked to aberrant activation of RAS-ERK and PI3K-AKT in different cancers [6,7,9,16,21]. For example, overexpression of GAB2 accelerates NeuT-induced mammary tumorigenesis by activating SHP2-dependent ERK1/2 signaling [7]. Overexpression of GAB2 promotes ovarian cancer cell migration and invasion by upregulating PI3K-dependent transcription of ZEB1, a known inducer of epithelial-mesenchymal transition (EMT) [9]. Our recent studies show that knock-down of GAB2 selectively inhibits proliferation, survival, and tumor growth of ovarian cancer cell lines with GAB2 amplification and/or overexpression but has no effects on cells with low GAB2 expression [6,21]. The selective inhibitory effect is associated with reduction in both phospho-ERK1/2 and phospho-AKT levels [6,21]. Our findings suggest that ovarian cancer with amplification/overexpression of GAB2 exhibits oncogene addiction.
Previous studies have developed several antagonists to block the GRB2-GAB2 adaptor function, but their potencies remain to be optimized [22,23]. Another promising approach is to target key effectors of GAB2 in combination which has not been studied. We and others have shown that ovarian cancer cell lines overexpressing GAB2 are sensitive to pan-class I PI3K inhibitors or dual PI3K/mTOR inhibitors [6,10,21]. Specific and potent pharmacological inhibition of SHP2 has remained elusive despite continued interest [24]. Recently, a highly potent, specific, and orally available allosteric inhibitor of SHP2, SHP099, has been developed [25]. SHP099 has been shown to concurrently bind to the N-terminal SH2, C-terminal SH2, and PTP domains, thereby stabilizing SHP2 in an auto-inhibited conformation in an allosteric manner [25]. Treatment with SHP099 inhibits growth of tumors driven by activated receptor tyrosine kinases and prevents adaptive resistance to MEK inhibitors [25,26]. The role of SHP2 in HGSOCs, particularly in the context of GAB2 amplification/overexpression, has not been studied.
In this study, we investigated whether combinatorial inhibition of SHP2 and PI3K is effective in ovarian cancer cells with GAB2 amplification/overexpression. We used the Chou-Talalay method for drug combination studies [27] to investigate whether combination of SHP2 and PI3K inhibitors have synergistic, additive, or antagonistic effects.
Materials and methods
Cell culture
All cell lines were obtained and cultured as described [28]. These cell lines have been authenticated by sequenom genotyping assays for a panel of 48 SNP loci and matched to reference fingerprint (http://broadinstitute.org/ccle) and no mycoplasma contamination was detected as described [29].
Chemicals
SHP099 was purchased from MedChemExpress. AZD628 [30], AZD6244 [31], BKM120 [32], GDC0941 [33], BEZ235 [34], and KU63794 [35] were purchased from Selleck Chemicals.
Gene set enrichment analysis (GSEA)
We downloaded the mRNA expression z-scores for TCGA HGSOC patients from the cBioPortal for Cancer Genomics database (http://www.cbioportal.org/) [36]. We checked the pathways enriched for the GAB2-overexpressing tumors with the GSEA software (GseaPreranked tool) (http://software.broadinstitute.org/gsea) [37], using absolute correlation coefficient between GAB2 and each gene as a score and KEGG as a pathway annotation database.
Cell viability assays
To determine dose-response curves, cells were seeded into each well of 96-well plates for 24 hours. Media were replaced with fresh media containing increasing concentrations of SHP099 (0.3125, 0.625, 1.25, 2.5, 5, 10, 20 or 40 μM) or an equal amount of DMSO, with each concentration tested in triplicate wells. After 72 hours, cell viability was measured by CellTiter-Glo luminescent cell viability assay (Promega). To determine CI values, the IC50 dose for individual inhibitor was determined and cell viability assays were performed for cells treated with different doses (0.25X, 0.5X, 1X, 2X, and 4X IC50 doses) of SHP099 and PI3K pathway inhibitors individually or in combination. CompuSyn software was used to calculate the CI values. Data were averages of triplicate measurements representative of three independent experiments. To assess clonogenic growth, cells were seeded into each well of 6-well plates for 24 hours, and indicated concentrations of inhibitors were added. After 12-14 days, cells were fixed in 2.5% buffered formalin and stained in 0.1% (w/v) crystal violet solution for 15 minutes each. The number of colonies was quantified by Oxford Optronix GelCount system. Representative images from three independent experiments are shown.
Annexin V staining
Cells were seeded into 10-cm culture dishes for 24 hours. Media were replaced with fresh media containing IC50 doses of SHP099 and BKM120 alone or in combination or equal amount of DMSO for another 48 hours. Culture supernatant and trypsinized cells were combined and pelleted. After two washes in cold PBS, cells were resuspended in Annexin V binding buffer. 100,000 cells were stained with 5 μL of allophycocyanin (APC)-conjugated Annexin V (Thermo Fisher Scientific) and propidium iodide (5 μg/mL) for 15 minutes and analyzed with BD FACSAria IIu Cell Sorter and FlowJo software. Duplicate cell cultures for each treatment were analyzed in each experiment. Data represent averages ± SEM of three independent experiments.
Reverse phase protein array (RPPA)
FUOV1 cells were seeded into each well of 6-well dishes for 24 hours, and then treated with SHP099 (6 μM), BEZ235 (0.1 μM), SHP099 (6 μM) + BEZ235 (0.1 μM), or equal volume of DMSO for 48 hours. Protein lysates were prepared from two independent experiments and analyzed at the Functional Proteomics RPPA Core Facility, MD Anderson Cancer Center.
Immunoblotting
Cell lysates were prepared in radioimmunoprecipitation assay buffer supplemented with Halt Protease and Phosphatase Inhibitor Cocktail (Pierce). Equal amount of protein (30 μg) was separated by NuPAGE Novex Bis-Tris 4-12% gels (Life Technologies). The membrane was incubated with primary antibodies at 4°C overnight. Antibodies against p-AKT (S473), AKT, p-ERK1/2 (T202/Y204), ERK1/2, GAB2, BIM, p-BAD (S112), p-BAD (S136), BAD, and MCL1 were purchased from Cell Signaling Technology. Antibody for c-MYC was purchased from Santa Cruz Biotechnology. After incubation with appropriate horseradish peroxidase linked secondary antibodies (Bio-Rad) for 2 hours at room temperature, the membrane was incubated with Enhanced Chemiluminescence Plus substrate (Pierce) and signals were detected by Pierce CL-Xposure films. Expression of β-actin was detected by a specific antibody from Santa Cruz Biotechnology as an internal loading control.
Real-time quantitative reverse-transcription PCR
Total RNA was extracted with TRIzol reagent, and 2 μg was used to synthesize the first strand cDNA using Maxima First Strand cDNA Synthesis Kit (Thermo Fisher Scientific). Quantitative PCRs were performed with Maxima SYBR Green qPCR Master Mix. The primer sequences used were: GAPDH (5’-CCTGTTCGACAGTCAGCCG-3’, 5’-CGACCAAATCCGTTGACTCC-3’), c-MYC (5’-CAGCTGCTTAGACGCTGGATT-3’, 5’-GTAGAAATACGGCTGCACCGA-3’), BIM (5’-ATCTCAGTGCAATGGCTTCC-3’, 5’-CTAGGATGACTACCATTGCAC-3’). For each experiment, triplicate reactions for each primer set were performed using Roche LightCycler 480 II PCR instrument. The mean cycle threshold was used for the comparative cycle threshold analysis (ABI User Bulletin #2). Data represent averages ± SEM of three independent experiments.
Xenograft tumor growth assays
All animal experiments were conducted in accordance with animal use guidelines of the National Institutes of Health using protocols approved by the Medical University of South Carolina and Use Committee. IGROV1 cells (5 × 10⁶ cells in 200 μL of PBS per injection) were implanted subcutaneously into both flanks of immunodeficient athymic nude mice (Harlan laboratories). Tumors were allowed to grow for 12 days (reaching a size of 62.5 mm3). Mice bearing tumors were randomly assigned to receive treatment with SHP099 (50 mg/kg, qd), BKM120 (22.5 mg/kg, qd) alone or in combination or vehicle treatment by oral gavage for a period of 22 days (n = 10). BKM120 (Novartis Pharmaceuticals) was reconstituted in one volume of NMP (1-methyl-2 pyrrolidone, Sigma) and nine volumes of PEG-300 (polyethylene glycol 300; Fluka Analytical). SHP099 (Novartis Pharmaceuticals) was reconstituted in 10% Solutol (sigma 42966), 20% PBS, 20% Prolylne Glycol (sigma W294004) as described [25]. Tumor size was measured every other day by a caliper. Tumor volume = length × (width)2/2. Upon harvesting tumors, tumors were cut into half, with one half fixed in formalin overnight and then in 70% ethanol for histopathology analysis.
Histology, immunohistochemistry (IHC)
For histological analyses, the Tissue Biorepository at Medical University of South Carolina stained FFPE sections with hematoxylin and eosin. IHC was performed with antibodies against Ki67, cleaved caspase 3 (CC3) and secondary antibody, followed by staining and photographing. For quantification of IHC, three images were taken per tumor section and analyzed using the Visiopharm Integrator System (Visiopharm).
Statistical analyses
Statistical evaluation was performed with Student’s t test or ANOVA. Values are expressed as means ± SEM. Values of P < 0.05 were considered to indicate a statistically significant difference.
Results
Gene expression profiles reveal higher activities of ERBB, RAS, and MAPK in primary GAB2High HGSOCs
We and others have observed that amplification of the GAB2 gene correlates with increased gene expression in primary HGSOCs characterized by the TCGA project, and that overexpression of GAB2 in the absence of gene copy number changes also occurs in primary HGSOCs and ovarian cancer cell lines [6,10]. To explore signaling pathways potentially activated by GAB2 overexpression, we performed gene set enrichment analysis (GSEA) of gene expression profiles of primary HGSOCs (see Methods). Among the top ten gene sets that were enriched in GAB2-overexpressing HGSOCs, we found significant enrichment of ERBB signaling, MAPK signaling, and RAS signaling as the top third, sixth, and seventh ranked gene sets, respectively (Table 1). This is interesting given that GAB2 is a signaling molecule downstream of many receptor tyrosine kinases including the ERBB family [38], and that SHP2 is a well-established GAB2 effector and an activator of RAS and MAPK signaling [17]. These observations support the idea that overexpression of GAB2 in HGSOCs contributes to activation of RAS and MAPK signaling.
Table 1.
Gene sets enriched in primary HGSOCs with GAB2 overexpression, where enriched gene sets were identified with the GSEA software using absolute correlation coefficient between GAB2 and each gene as a score and KEGG as a pathway annotation database
| Rank | Gene Set | n | NOM p-val | NES | FDR q-val |
|---|---|---|---|---|---|
| 1 | KEGG_ADHERENS_JUNCTION | 72 | 0.000 | 3.05 | 0.000 |
| 2 | KEGG_STEROID_BIOSYNTHESIS | 14 | 0.000 | 2.34 | 0.032 |
| 3 | KEGG_ERBB_SIGNAING_PATHWAY | 84 | 0.002 | 2.01 | 0.205 |
| 4 | KEGG_MELANOGENESIS | 100 | 0.008 | 1.92 | 0.259 |
| 5 | KEGG_ALDOSTERONE_REGULATED_SODIUM_REABSORPTION | 40 | 0.010 | 1.91 | 0.217 |
| 6 | KEGG_MAPK_SIGNALING_PATHWAY | 253 | 0.016 | 1.88 | 0.220 |
| 7 | KEGG_RAS_SIGNALING | 189 | 0.014 | 1.85 | 0.226 |
| 8 | KEGG_CELL_CYCLE | 120 | 0.019 | 1.82 | 0.228 |
| 9 | KEGG_T_CELL_RECEPTOR_SIGNALING_PATHWAY | 103 | 0.014 | 1.8 | 0.231 |
| 10 | KEGG_ACUTE_MYELOID_LEUKEMIA | 54 | 0.016 | 1.76 | 0.259 |
n = number of genes in each gene set; NOM p-val = nominal p value; NES = normalized enrichment score; FDR q-val = false discovery rate; test of statistical significance.
GAB2High ovarian cancer cell lines are selectively sensitive to SHP2 inhibition
We investigated whether ovarian cancer cell lines with GAB2 amplification and/or overexpression are dependent on SHP2 for proliferation and survival. By analyzing gene copy number and expression data of 51 ovarian cancer cell lines characterized by the Cancer Cell Line Encyclopedia (CCLE) project [29], we identified a panel of 9 serous ovarian cancer cell lines with or without GAB2 amplification/overexpression. We performed quantitative real-time PCR and immunoblotting, and confirmed that two cell lines (OVCAR3 and JHOS4) that harbored GAB2 gene amplification expressed high GAB2 mRNA and protein levels, two cell lines (FUOV1 and IGROV1) expressed high levels of GAB2 mRNA and protein in the absence of gene copy number changes, and 5 cell lines (HEYA8, OVCAR5, OV90, OVCAR4, and SKOV3) that did not harbor gene amplification display low levels of GAB2 mRNA and protein (Figure 1B and 1C). Each cell line was treated with increasing doses of SHP099 for 72 hours and cell viability was measured by CellTiter-Glo assays. We observed that the 4 cell lines with GAB2 amplification/overexpression are relatively more sensitive than 5 cell lines expressing low GAB2 levels (Figure 1D). Previous study has shown that the lung cancer cell line HCC827 harboring EGFR mutation was sensitive to SHP099. We observed that the 4 ovarian cancer cell lines with GAB2 overexpression had comparable or higher sensitivity to SHP099 than that observed in HCC827 cells. Treatment with SHP099 at a relatively low concentration (5 μM) inhibited clonogenic growth of all 4 ovarian cancer cell lines with GAB2 amplification/overexpression but had no effects on 2 of the cell lines with low GAB2 expression tested (Figure 1E and 1F). The selective inhibitory effect of SHP099 was associated with selective reduction in phospho-ERK1/2 (p-ERK1/2) levels (Figure 1G). In contrast, p-AKT levels were unchanged after SHP099 treatment (Figure 1G). These findings suggest that SHP2 is selectively required for GAB2High ovarian cancer cell lines for proliferation, survival, and activation of ERK1/2 signaling.
Figure 1.

GAB2High ovarian cancer cell lines are selectively dependent on SHP2 for proliferation and survival. (A) Gene copy number and expression data of GAB2 in 51 ovarian cancer cell lines characterized in the Cancer Cell Line Encyclopedia project. This study used 4 cell lines with GAB2 amplification/overexpression (highlighted in red color) and 5 cell lines without alterations (black) that were available in our laboratory. Gray color indicates other cell lines not used in this study. Dotted lines indicate arbitrary cut-off for GAB2 amplification (> 4 gene copies) or GAB2 overexpression (1.5-fold increase in expression). OVCAR5 cell line was not present in the graph as only gene copy number information was available for this cell line. (B) Quantitative real-time PCR measurement of GAB2 mRNA levels and (C) immunoblot of GAB2 protein in a panel of 9 genetically characterized ovarian cancer cell lines. Four cell lines with GAB2 gene amplification and overexpression (OVCAR3 and JHOS4) or overexpression (FUOV1 and IGROV1) in the absence of gene amplification are highlighted in red color. Five cell lines with normal GAB2 gene copy number and low expression levels (HEYA8, OVCAR5, OV90, OVCAR4, SKOV3) are highlighted in black color. (D) Dose-response curves of SHP099. Each cell line was exposed to increasing doses of SHP099 for 3 days, and cell viability was measured by CellTiter-Glo assays. EGFR-mutant HCC827 lung cancer cell line was highlighted in blue color. Data were represented as mean ± SEM (n = 3). (E) Clonogenic growth after exposure to SHP099. Each cell line was seeded at low density in 6-well plates, cultured in the presence of DMSO or SHP099 (5 μM) for 12-14 days, and stained by crystal violet. Representative images from three independent experiments are shown. (F) Quantitation of the number of colonies determined in (E). Data were represented as mean ± SEM (n = 3). ****P < 0.0001 by Student’s t test. (G) Immunoblots for p-ERK1/2, ERK1/2, p-AKT, and AKT in indicated cell lines after exposure to three different doses of SHP099 (5, 10, or 20 μM) for 24 hours.
Synergistic effects of SHP2 and PI3K pathway inhibitors in GAB2High ovarian cancer cell lines
We previously reported that GAB2High ovarian cancer cell lines were sensitive to PI3K pathway inhibition [6,21]. Here we investigated the effect of SHP2 inhibition cooperating with PI3K pathway inhibitors at suppressing proliferation/survival of ovarian cancer cells. We first assessed the dose-response curves of BKM120 alone or in combination with a relatively low dose of SHP099 (5 μM), which had been shown to be effective and specific at SHP2 inhibition in vitro previously [25], in 4 GAB2High and 3 GAB2Low ovarian cell lines. We observed that additional SHP099 effectively improved the therapeutic effect of BKM120 by more than 20% of inhibition of growth in 4 GAB2High ovarian cancer cell lines, but not in 3 GAB2Low ovarian cancer cell lines (Figure 2A). We next used the Chou-Talalay method for drug combination studies [27] and determined the dose-response curves of SHP099 and BKM120 individually and in combination at a constant potency ratio in the 4 GAB2High cell lines. BKM120 is a pan-class I PI3K inhibitor and is being evaluated in many clinical trials [39]. The calculated combination index (CI) values for OVCAR3, JHOS4, FUOV1, and IGROV1 cells at doses effective in reducing cell viability by 90% were 0.41, 0.75, 0.33, 0.49, respectively (Figure 2B). We further examined whether SHP099 also synergized with other inhibitors against the PI3K pathway, including GDC0941 (a pan-class I PI3K inhibitor), BEZ235 (a dual PI3K/mTOR inhibitor) and KU63794 (an mTOR inhibitor). We determined the CI values for different drug combinations, including SHP099+GDC0941, SHP099+BEZ235, and SHP099+KU63794 were < 1 (Figure 2B), indicating that SHP099 had a synergistic effect with each of these PI3K pathway inhibitors. To examine whether inhibition of RAF-MEK signaling contributes to the synergistic inhibitory effect of SHP099 with BKM120, we assessed the dose response curves of BKM120 in combination with AZD628 (a pan-inhibitor of BRAF and c-RAF) or AZD6244 (an inhibitor of MEK1) in FUOV1 cells. The CI values for AZD628+BKM120 and AZD6244+BKM120 were < 1, indicating synergistic effects (Figure 2C). These findings support that inhibition of RAF-MEK signaling contributes to the synergy between SHP2 with PI3K pathway inhibition.
Figure 2.

Synergistic effect of SHP2 and PI3K inhibition at suppressing proliferation and survival of GAB2High ovarian cancer cell lines. A. Dose-response curves of BKM120 alone or in combination with SHP099 (5 μM). Cell viability was measured by CellTiter-Glo assays after 72 hours treatment. Data were represented as mean ± SEM (n = 3). *P < 0.05 by Student’s t test. B, C. The combination index (CI) plots. Fraction inhibited (or affected) refers to the fraction of cell viability inhibited. Dose-response curves of SHP099, BKM120, GDC0941, BEZ235, KU63794, AZD628 or AZD6244 individually or in combination were determined in each cell line. Each cell line was seeded in 96-well plates for 24 hours and then exposed to 5 different doses of indicated inhibitors for another 72 hours. Cell viability was measured by CellTiter-Glo assays. The CI values were calculated using the median-effect equation described by the Chou-Talalay method. CI < 1 indicates synergism, CI = 1 indicates an additive effect, and CI > 1 indicates antagonism.
To examine the longer-term effects of SHP2 and PI3K inhibition, we determined the effects of SHP099 and BKM120 on clonogenic growth of the 4 GAB2High cell lines. Cells were exposed to low doses of SHP099 (5 μM) (comparable to reported effective dose [25]) and BKM120 (0.3-0.8 μM) individually or in combination for up to 2 weeks. We observed that treatment with individual inhibitor at low doses suppressed clonogenic growth, but combined SHP099 and BKM120 treatment was more effective (Figure 3A), thus corroborating with the CI data. Quantitation of colonies revealed a greater reduction in the number of colonies after treatment with SHP099+BKM120 combination than individual inhibitors (Figure 3B), indicating an inhibition of cell survival/viability. To determine if apoptosis contributed to the synergistic effect of SHP099 and BKM120, we assessed the effects of SHP099 and BKM120 at the half maximal inhibitory concentration (IC50) doses (i.e., concentrations inhibited 50% of cell viability as determined by the CellTiter-Glo assays in Figure 2B) for 48 hours on apoptosis by performing Annexin V staining followed by flow cytometry. We observed that combined SHP099+BKM120 treatment significantly increased apoptotic cell death compared with individual inhibitor (Figure 3C). These results indicate that the synergistic effect of SHP2 and PI3K inhibition is in part due to increased induction of apoptotic cell death.
Figure 3.

Induction of apoptotic cell death contributes to the synergistic effect of SHP2 and PI3K inhibition. (A) Clonogenic growth assays. Ovarian cancer cell lines with GAB2 amplification/overexpression were seeded at low density, cultured in the presence of DMSO, BKM120 (0.3-0.8 μM), SHP099 (5 μM), or SHP099+BKM120 combination for 12-14 days, and stained by crystal violet solution. Representative images from three independent experiments were shown. (B) Quantitation of the number of colonies determined in (A). Data were represented as mean ± SEM (n = 3). **P < 0.01, ***P < 0.001, ****P < 0.0001 by one way ANOVA. (C) Flow cytometry analysis of Annexin V-positive cells. Each cell line was treated with IC50 doses (determined in Figure 2B) of each inhibitor alone or in combination for 48 hours and stained with APC-conjugated Annexin V. Data were represented as mean ± SEM (n = 3). **P < 0.01, ***P < 0.001, by one way ANOVA.
Combinatorial SHP2 and PI3K inhibition activates BIM and BAD, and inhibits c-MYC
To investigate the molecular mechanisms underlying the synergistic effects of SHP2 and PI3K inhibition, we performed reverse phase protein array (RPPA) analysis in FUOV1 cells after treatment with SHP099 and BEZ235 individually or in combination for 48 hours. As a control, cells were treated with equal amount of DMSO. Averaged signals from 2 independent experiments were calculated as log2 fold change relative to DMSO-treated cells. As expected, SHP099 treatment alone decreased levels of p-ERK1/2 (T202/Y204) and p-c-Raf (p-S338), whereas BEZ235 treatment alone decreased levels of p-AKT (S473) and p-mTOR (S2448). Combined SHP099+BEZ235 treatment reduced phosphorylation levels of all 4 signaling molecules. The RPPA data also showed an increase in BIM levels after SHP099 or SHP099+BEZ235 treatment. Reduced MCL1 levels were observed in BEZ235 or SHP099+BEZ235 treated cells, whereas reduced p-BAD (S112) levels were observed in SHP099+BEZ235 treated cells only. In contrast, BCL-XL levels remain unchanged (data was not shown).
BIM and BAD are known pro-apoptotic proteins, whereas MCL1 is an anti-apoptotic protein [40]. To confirm these findings, we treated all 4 cell lines with GAB2 amplification/overexpression with SHP099 and BKM120 alone or in combination for 24 hours, and performed immunoblotting and quantitative PCR to examine their effects on apoptotic regulators. We observed that SHP099 treatment increased BIM protein levels in all 4 cell lines but the BIM mRNA levels did not increase in 3 out of 4 cell lines (Figure 4A, 4B), suggesting that increased BIM protein by SHP099 may be due to protein stabilization. We also observed that BKM120 treatment reduced p-BAD (S112) levels in all 4 cell lines. Reduction of p-BAD (S136) levels was observed in 3 cell lines after combined SHP099+BKM120 treatment only. In IGROV1 cells, BKM120 treatment alone was sufficient to reduce p-BAD (S136). Reduction in MCL1 protein levels was only observed in FUOV1 cells, but not in the other 3 cell lines, after BKM120 or SHP099+BKM120 treatment (Figure 4A). Therefore, these results suggest that coordinate activation of BIM by SHP099 and activation of BAD by BKM120 contribute to increased apoptosis after combinatorial SHP099+BKM120 treatment. While the dual PI3K/mTOR inhibitor BEZ235 was used for RPPA, these findings show that inhibition of PI3K alone contributes to the changes detected by RPPA.
Figure 4.

Combined SHP2 and PI3K inhibition activates BIM and BAD and inhibits c-MYC. A. Immunoblots for indicated proteins in 4 ovarian cancer cell lines with GAB2 amplification/overexpression after treatment with DMSO, BKM120, SHP099 or SHP099+BKM120 for 24 hours. IC50 doses (determined in Figure 2A) of each inhibitor alone or in combination were used. Representative images from two independent experiments are shown. B. Quantitative real-time PCR analysis showing relative mRNA levels of BIM (left) and c-MYC (right) after exposure to DMSO, BKM120, SHP099 or SHP099+BKM120 for 24 hours. Data were represented as mean ± SEM (n = 3). *P < 0.05, **P < 0.01, ***P < 0.001, ****P < 0.0001 by one way ANOVA.
Our RPPA data also indicated that SHP099 treatment reduced c-MYC levels in FUOV1 cells. Using immunoblotting and quantitative PCR, we confirmed that SHP099 treatment resulted in a more pronounced reduction of c-MYC proteins than BKM120 treatment in all 4 cell lines with GAB2 amplification/overexpression (Figure 4A). SHP099 treatment also decreased the mRNA levels of c-MYC (Figure 4B). In contrast, BKM120 treatment increased c-MYC mRNA levels in 3 cell lines with the exception of IGROV1 cells (Figure 4B). The discordance between the protein and mRNA levels of c-MYC support the notion that the stability of c-MYC protein is in part regulated by ERK1/2 and AKT pathways. Importantly, we observed that combined SHP099+BKM120 treatment consistently reduced c-MYC proteins in all 4 cell lines tested. These results indicate that SHP099+BKM120 combination effectively reduces expression of c-MYC protein, through destabilization, suppression of transcription, or both in ovarian cancer cell lines with GAB2 amplification/overexpression.
Combinatorial SHP2 and PI3K inhibition induces regression of tumor xenograft
To examine the effect of combinatorial SHP099 and BKM120 treatment on tumor growth, we established subcutaneous tumor xenografts from IGROV1 cells. Mice bearing tumors were treated with SHP099 (50 mg/kg, daily) and BKM120 (22.5 mg/kg, daily) alone or in combination. We observed that treatment with individual inhibitor attenuated tumor growth (Figure 5A). Importantly, combinatorial SHP099 and BKM120 treatment induced rapid tumor regression (Figure 5A). Mice receiving drug treatments alone or in combination did not show adverse effects on body weight compared to vehicle-treated mice (Figure 5B), indicating that the drug combination was well tolerated in mice. To determine if inhibition of tumor cell proliferation or survival or both was responsible for the tumor regression, we peformed immunohistochemistry on xenograft sections three days after drug treatment. We observed that combined treatment with SHP099 and BKM120 resulted in greater inhibition of tumor cell proliferation (indicated by reduction in Ki67-positive cells) and induction of apoptosis (indicated by increased number of cleaved Caspase 3 positive cells) compared with individual treatment (Figure 5C and 5D). These results indicate that inhibition of tumor cell proliferation and induction of apoptosis contribute to tumor regression induced by combined PI3K and SHP2 inhibition.
Figure 5.
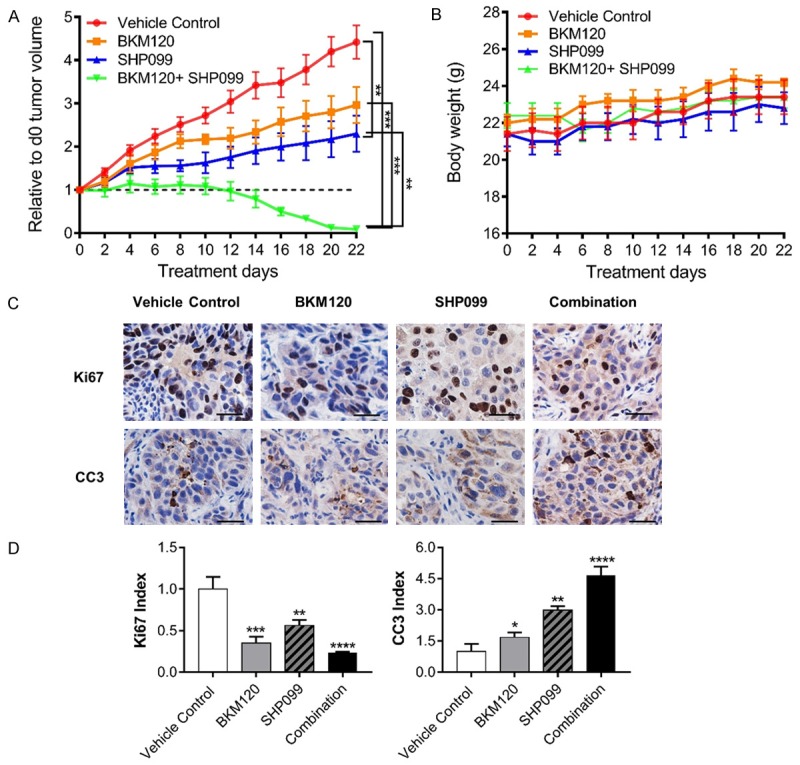
Combined SHP2 and PI3K inhibition induces tumor regression. A. Growth of IGROV1-derived tumor xenograft in nude mice treated with vehicle (n = 10), BKM120 (22.5 mg/kg), SHP099 (50 mg/kg), or SHP099+BKM120 by oral gavage. Data were represented as mean ± SEM. **P < 0.01, ***P < 0.001 by one way ANOVA. B. Body weight of nude mice receiving indicated drug treatment. Mean ± SEM values were presented. C. Immunohistochemical analyses of tumor xenografts with indicated antibodies at the conclusion of indicated drug treatment. D. The indicated bar graphes show the relative fraction of cells positive in Ki67, Cleaved Caspase 3 (CC3) in 4 mm2 tumor xenograft sections. Data were represented as mean ± SEM from 6 different tumor sections, *P < 0.05, **P < 0.01, ***P < 0.001, ****P < 0.0001 by one way ANOVA.
Discussion
In this study, we provide evidence that GAB2High HGSOCs are associated with enhanced ERBB, RAS, and ERK signaling. Serous ovarian cancer cell lines with GAB2 amplification/overexpression are selectively dependent on SHP2 for activation of ERK1/2 signaling, cell proliferation, survival, and clonogenic growth. Combinatorial SHP2 and PI3K pathway inhibition show a synergistic effect at suppressing proliferation and survival of GAB2High ovarian cancer cell lines in part through coordinate activation of pro-apoptotic BIM and BAD proteins and induction of apoptotic cell death. These findings suggest that co-targeting SHP2 and PI3K may be a highly promising therapeutic approach for GAB2High HGSOCs.
Aberrant activation of SHP2 has been shown in several human diseases and malignancies [17]. Germline activating mutations in the SHP2 gene cause 50% of Noonan Syndrome, whereas somatic SHP2 mutations were reported in several types of leukemia including ~35% of sporadic juvenile myelomonocytic leukemia (JMML), 10% of childhood myelodysplastic syndromes, 7% of B-cell acute lymphoblastic leukemia (B-ALL), and 4% of adult acute myelogenous leukemia (AML) [41]. Somatic SHP2 mutations are rare in solid tumors [41], while aberrant activation of upstream receptor tyrosine kinases or intracellular kinases, such as overexpression of ERBB2 in breast cancer [7], mutation of EGFR in lung cancer [42], overexpression of EGFR in colon cancer [43], and translocation of BCR/ABL in chronic myelogeneous leukemia (CML) [44], has been reported to activate SHP2 to promote cancer development, progression, and resistance to targeted therapies. GAB2 protein contains two consensus tyrosyl phosphorylation sites at Y614LAL and Y643VQV to bind to the SH2 domain of SHP2. Corroborating with our previous observation that ovarian cancer cell lines with GAB2 amplification/overexpression depend on high GAB2 levels for activation of ERK1/2 and AKT signaling [6,21], this study identified a highly selective dependency of GAB2 overexpressing-ovarian cancer cells on SHP2. Thus, SHP2 inhibitor is likely to have a high therapeutic index in ovarian cancer. Our findings indicate that SHP2 is one of the key effectors of GAB2 contributing to the observed oncogene dependency. Previous studies have established SHP2 as a key signaling molecule of programmed cell death (PD-1), cytotoxic T-lymphocyte associated antigen 4 (CTLA-4), and B- and T-lymphocyte attenuator (BTLA) immune checkpoint pathways [45]. Future studies should also investigate how combinatorial SHP2 and PI3K inhibition affects tumor and immune cells.
Both BIM and BAD are pro-apoptotic Bcl-2 family members that influence responsiveness of ovarian cancer to chemotherapy and prognosis [46,47]. BIM protein is localized at microtubules by direct interaction with dynein, and disruption of microtubule dynamics by paclitaxel releases BIM to induce apoptosis [48]. Activation of the RAS-ERK1/2 signaling has been shown to phosphorylate BIM and target BIM for proteasome-mediated degradation and inhibit paclitaxel-induced apoptosis [49]. In addition, ERK1/2 suppresses FOXO3A-dependent transcription of BIM by phosphorylating FOXO3A and targeting FOXO3A for degradation in proteasomes [50], whereas activation of AKT suppresses FOXO3A-dependent transcription of BIM by phosphorylating FOXO3A at different sites to promote cytosolic sequestration of FOXO3A. The activity of BAD is negatively regulated by phosphorylation at S112 and S136 residues which induces cytosolic sequestration of BAD by 14-3-3 proteins and inhibits the ability of BAD to heterodimerize with the anti-apoptotic proteins BCLXL or BCL2 [40]. RAS-ERK1/2 signaling phosphorylates BAD at S112 whereas AKT phosphorylates BAD at S136 [51]. Expression of a phosphorylation-defective BAD mutant (S112A, S136A) sensitized ovarian cancer cells to paclitaxel and cisplatin-induced cytotoxicity [51]. The present study extends from these lines of evidence and shows that combinatorial inhibition of SHP2 and PI3K coordinately activates both BIM and BAD, and more effectively induces apoptotic cell death and tumor regression than individual inhibition.
In summary, we observed that the overexpression of GAB2 is associated with enhanced ERBB, RAS, and MAPK signaling in HGSOCs. We provided evidence that SHP2 was selectively required for activation of ERK1/2 signaling and proliferation/survival of serous ovarian cancer cell lines with GAB2 amplification/overexpression compared with ovarian cancer cell lines without GAB2 alterations. Inhibition of SHP2 synergized with PI3K inhibition at suppressing proliferation and survival in part through activation of pro-apoptotic BIM and BAD and inhibition of c-MYC. Our findings suggest that combinatorial SHP2 and PI3K inhibition may be a promising therapeutic approach for GAB2High HGSOCs.
Acknowledgements
This research was supported by grants from an American Cancer Society Institutional Research Grant awarded to the Hollings Cancer Center, Medical University of South Carolina (Q.W.), the Ovarian Cancer Research Fund Alliance [292377] (H.W.C.); the V Foundation for Cancer Research (H.W.C.); the Marsha Rivkin Center for Ovarian Cancer Research (H.W.C.); Colleen’s Dream Foundation (H.W.C.); the Abney Foundation Scholarship (N.J.); the National Cancer Institute [R21-CA209848] (D.C.); the National Institute of General Medical Sciences [R01-GM122078] (D.C.); This research was supported by the Cell Evaluation & Therapy Shared Resource, Hollings Cancer Center, Medical University of South Carolina (P30 CA138313).
Disclosure of conflict of interest
None.
References
- 1.Cho KR, Shih Ie M. Ovarian cancer. Annu Rev Pathol. 2009;4:287–313. doi: 10.1146/annurev.pathol.4.110807.092246. [DOI] [PMC free article] [PubMed] [Google Scholar]
- 2.Chan JK, Brady MF, Penson RT, Huang H, Birrer MJ, Walker JL, DiSilvestro PA, Rubin SC, Martin LP, Davidson SA, Huh WK, O’Malley DM, Boente MP, Michael H, Monk BJ. Weekly vs. every-3-week paclitaxel and carboplatin for ovarian cancer. N Engl J Med. 2016;374:738–748. doi: 10.1056/NEJMoa1505067. [DOI] [PMC free article] [PubMed] [Google Scholar]
- 3.Liu JF, Matulonis UA. What is the place of PARP inhibitors in ovarian cancer treatment? Curr Oncol Rep. 2016;18:29. doi: 10.1007/s11912-016-0515-z. [DOI] [PubMed] [Google Scholar]
- 4.Matulonis UA, Sood AK, Fallowfield L, Howitt BE, Sehouli J, Karlan BY. Ovarian cancer. Nat Rev Dis Primers. 2016;2:16061. doi: 10.1038/nrdp.2016.61. [DOI] [PMC free article] [PubMed] [Google Scholar]
- 5.Cancer Genome Atlas Research Network. Integrated genomic analyses of ovarian carcinoma. Nature. 2011;474:609–615. doi: 10.1038/nature10166. [DOI] [PMC free article] [PubMed] [Google Scholar]
- 6.Dunn GP, Cheung HW, Agarwalla PK, Thomas S, Zektser Y, Karst AM, Boehm JS, Weir BA, Berlin AM, Zou L, Getz G, Liu JF, Hirsch M, Vazquez F, Root DE, Beroukhim R, Drapkin R, Hahn WC. In vivo multiplexed interrogation of amplified genes identifies GAB2 as an ovarian cancer oncogene. Proc Natl Acad Sci U S A. 2014;111:1102–1107. doi: 10.1073/pnas.1311909111. [DOI] [PMC free article] [PubMed] [Google Scholar]
- 7.Bentires-Alj M, Gil SG, Chan R, Wang ZC, Wang Y, Imanaka N, Harris LN, Richardson A, Neel BG, Gu H. A role for the scaffolding adapter GAB2 in breast cancer. Nat Med. 2006;12:114–121. doi: 10.1038/nm1341. [DOI] [PubMed] [Google Scholar]
- 8.Yang Y, Wu J, Demir A, Castillo-Martin M, Melamed RD, Zhang G, Fukunaga-Kanabis M, Perez-Lorenzo R, Zheng B, Silvers DN, Brunner G, Wang S, Rabadan R, Cordon-Cardo C, Celebi JT. GAB2 induces tumor angiogenesis in NRAS-driven melanoma. Oncogene. 2013;32:3627–3637. doi: 10.1038/onc.2012.367. [DOI] [PMC free article] [PubMed] [Google Scholar]
- 9.Wang Y, Sheng Q, Spillman MA, Behbakht K, Gu H. Gab2 regulates the migratory behaviors and E-cadherin expression via activation of the PI3K pathway in ovarian cancer cells. Oncogene. 2012;31:2512–2520. doi: 10.1038/onc.2011.435. [DOI] [PMC free article] [PubMed] [Google Scholar]
- 10.Davis SJ, Sheppard KE, Anglesio MS, George J, Traficante N, Fereday S, Intermaggio MP, Menon U, Gentry-Maharaj A, Lubinksi J, Gronwald J, Pearce CL, Pike MC, Wu A, Kommoss S, Pfisterer J, du Bois A, Hilpert F, Ramus SJ, Bowtell DD, Huntsman DG, Pearson RB, Simpson KJ, Campbell I, Gorringe KL. Enhanced GAB2 expression is associated with improved survival in high-grade serous ovarian cancer and sensitivity to PI3K inhibition. Mol Cancer Ther. 2015;14:1495–1503. doi: 10.1158/1535-7163.MCT-15-0039. [DOI] [PubMed] [Google Scholar]
- 11.Mira A, Isella C, Renzulli T, Cantarella D, Martelli ML, Medico E. The GAB2 signaling scaffold promotes anchorage independence and drives a transcriptional response associated with metastatic progression of breast cancer. Oncogene. 2009;28:4444–4455. doi: 10.1038/onc.2009.296. [DOI] [PubMed] [Google Scholar]
- 12.Chernoff KA, Bordone L, Horst B, Simon K, Twadell W, Lee K, Cohen JA, Wang S, Silvers DN, Brunner G, Celebi JT. GAB2 amplifications refine molecular classification of melanoma. Clin Cancer Res. 2009;15:4288–4291. doi: 10.1158/1078-0432.CCR-09-0280. [DOI] [PMC free article] [PubMed] [Google Scholar]
- 13.Ding C, Luo J, Yu W, Gao S, Yang L, Chen C, Feng J. Gab2 is a novel prognostic factor for colorectal cancer patients. Int J Clin Exp Pathol. 2015;8:2779–2786. [PMC free article] [PubMed] [Google Scholar]
- 14.Zhang X, Dong Z, Zhang C, Ung CY, He S, Tao T, Oliveira AM, Meves A, Ji B, Look AT, Li H, Neel BG, Zhu S. Critical role for GAB2 in neuroblastoma pathogenesis through the promotion of SHP2/MYCN cooperation. Cell Rep. 2017;18:2932–2942. doi: 10.1016/j.celrep.2017.02.065. [DOI] [PMC free article] [PubMed] [Google Scholar]
- 15.Shi L, Sun X, Zhang J, Zhao C, Li H, Liu Z, Fang C, Wang X, Zhao C, Zhang X, Zhou F, Lu S, Luo R, Zhang B. Gab2 expression in glioma and its implications for tumor invasion. Acta Oncol. 2013;52:1739–1750. doi: 10.3109/0284186X.2012.750032. [DOI] [PubMed] [Google Scholar]
- 16.Adams SJ, Aydin IT, Celebi JT. GAB2 - a scaffolding protein in cancer. Mol Cancer Res. 2012;10:1265–1270. doi: 10.1158/1541-7786.MCR-12-0352. [DOI] [PMC free article] [PubMed] [Google Scholar]
- 17.Neel BG, Gu H, Pao L. The ‘Shp’ing news: SH2 domain-containing tyrosine phosphatases in cell signaling. Trends Biochem Sci. 2003;28:284–293. doi: 10.1016/S0968-0004(03)00091-4. [DOI] [PubMed] [Google Scholar]
- 18.Cuevas BD, Lu Y, Mao M, Zhang J, LaPushin R, Siminovitch K, Mills GB. Tyrosine phosphorylation of p85 relieves its inhibitory activity on phosphatidylinositol 3-kinase. J Biol Chem. 2001;276:27455–27461. doi: 10.1074/jbc.M100556200. [DOI] [PubMed] [Google Scholar]
- 19.Bunda S, Burrell K, Heir P, Zeng L, Alamsahebpour A, Kano Y, Raught B, Zhang ZY, Zadeh G, Ohh M. Inhibition of SHP2-mediated dephosphorylation of Ras suppresses oncogenesis. Nat Commun. 2015;6:8859. doi: 10.1038/ncomms9859. [DOI] [PMC free article] [PubMed] [Google Scholar]
- 20.Hanafusa H, Torii S, Yasunaga T, Matsumoto K, Nishida E. Shp2, an SH2-containing protein-tyrosine phosphatase, positively regulates receptor tyrosine kinase signaling by dephosphorylating and inactivating the inhibitor Sprouty. J Biol Chem. 2004;279:22992–22995. doi: 10.1074/jbc.M312498200. [DOI] [PubMed] [Google Scholar]
- 21.Duckworth C, Zhang L, Carroll SL, Ethier SP, Cheung HW. Overexpression of GAB2 in ovarian cancer cells promotes tumor growth and angiogenesis by upregulating chemokine expression. Oncogene. 2016;35:4036–4047. doi: 10.1038/onc.2015.472. [DOI] [PMC free article] [PubMed] [Google Scholar]
- 22.Giubellino A, Gao Y, Lee S, Lee MJ, Vasselli JR, Medepalli S, Trepel JB, Burke TR Jr, Bottaro DP. Inhibition of tumor metastasis by a growth factor receptor bound protein 2 Src homology 2 domain-binding antagonist. Cancer Res. 2007;67:6012–6016. doi: 10.1158/0008-5472.CAN-07-0022. [DOI] [PubMed] [Google Scholar]
- 23.Simister PC, Luccarelli J, Thompson S, Appella DH, Feller SM, Hamilton AD. Novel inhibitors of a Grb2 SH3C domain interaction identified by a virtual screen. Bioorg Med Chem. 2013;21:4027–4033. doi: 10.1016/j.bmc.2012.10.023. [DOI] [PMC free article] [PubMed] [Google Scholar]
- 24.Zeng LF, Zhang RY, Yu ZH, Li S, Wu L, Gunawan AM, Lane BS, Mali RS, Li X, Chan RJ, Kapur R, Wells CD, Zhang ZY. Therapeutic potential of targeting the oncogenic SHP2 phosphatase. J Med Chem. 2014;57:6594–6609. doi: 10.1021/jm5006176. [DOI] [PMC free article] [PubMed] [Google Scholar]
- 25.Chen YN, LaMarche MJ, Chan HM, Fekkes P, Garcia-Fortanet J, Acker MG, Antonakos B, Chen CH, Chen Z, Cooke VG, Dobson JR, Deng Z, Fei F, Firestone B, Fodor M, Fridrich C, Gao H, Grunenfelder D, Hao HX, Jacob J, Ho S, Hsiao K, Kang ZB, Karki R, Kato M, Larrow J, La Bonte LR, Lenoir F, Liu G, Liu S, Majumdar D, Meyer MJ, Palermo M, Perez L, Pu M, Price E, Quinn C, Shakya S, Shultz MD, Slisz J, Venkatesan K, Wang P, Warmuth M, Williams S, Yang G, Yuan J, Zhang JH, Zhu P, Ramsey T, Keen NJ, Sellers WR, Stams T, Fortin PD. Allosteric inhibition of SHP2 phosphatase inhibits cancers driven by receptor tyrosine kinases. Nature. 2016;535:148–152. doi: 10.1038/nature18621. [DOI] [PubMed] [Google Scholar]
- 26.Fedele C, Ran H, Diskin B, Wei W, Jen J, Geer MJ, Araki K, Ozerdem U, Simeone DM, Miller G, Neel BG, Tang KH. SHP2 inhibition prevents adaptive resistance to mek inhibitors in multiple cancer models. Cancer Discov. 2018;8:1237–1249. doi: 10.1158/2159-8290.CD-18-0444. [DOI] [PMC free article] [PubMed] [Google Scholar]
- 27.Chou TC. Theoretical basis, experimental design, and computerized simulation of synergism and antagonism in drug combination studies. Pharmacol Rev. 2006;58:621–681. doi: 10.1124/pr.58.3.10. [DOI] [PubMed] [Google Scholar]
- 28.Cheung HW, Cowley GS, Weir BA, Boehm JS, Rusin S, Scott JA, East A, Ali LD, Lizotte PH, Wong TC, Jiang G, Hsiao J, Mermel CH, Getz G, Barretina J, Gopal S, Tamayo P, Gould J, Tsherniak A, Stransky N, Luo B, Ren Y, Drapkin R, Bhatia SN, Mesirov JP, Garraway LA, Meyerson M, Lander ES, Root DE, Hahn WC. Systematic investigation of genetic vulnerabilities across cancer cell lines reveals lineage-specific dependencies in ovarian cancer. Proc Natl Acad Sci U S A. 2011;108:12372–7. doi: 10.1073/pnas.1109363108. [DOI] [PMC free article] [PubMed] [Google Scholar]
- 29.Barretina J, Caponigro G, Stransky N, Ven-katesan K, Margolin AA, Kim S, Wilson CJ, Lehar J, Kryukov GV, Sonkin D, Reddy A, Liu M, Murray L, Berger MF, Monahan JE, Morais P, Meltzer J, Korejwa A, Jane-Valbuena J, Mapa FA, Thibault J, Bric-Furlong E, Raman P, Shipway A, Engels IH, Cheng J, Yu GK, Yu J, Aspesi P Jr, de Silva M, Jagtap K, Jones MD, Wang L, Hatton C, Palescandolo E, Gupta S, Mahan S, Sougnez C, Onofrio RC, Liefeld T, MacConaill L, Winckler W, Reich M, Li N, Mesirov JP, Gabriel SB, Getz G, Ardlie K, Chan V, Myer VE, Weber BL, Porter J, Warmuth M, Finan P, Harris JL, Meyerson M, Golub TR, Morrissey MP, Sellers WR, Schlegel R, Garraway LA. The Cancer Cell Line Encyclopedia enables predictive modelling of anticancer drug sensitivity. Nature. 2012;483:603–607. doi: 10.1038/nature11003. [DOI] [PMC free article] [PubMed] [Google Scholar]
- 30.Khazak V, Astsaturov I, Serebriiskii IG, Golemis EA. Selective Raf inhibition in cancer therapy. Expert Opin Ther Targets. 2007;11:1587–1609. doi: 10.1517/14728222.11.12.1587. [DOI] [PMC free article] [PubMed] [Google Scholar]
- 31.Yeh TC, Marsh V, Bernat BA, Ballard J, Colwell H, Evans RJ, Parry J, Smith D, Brandhuber BJ, Gross S, Marlow A, Hurley B, Lyssikatos J, Lee PA, Winkler JD, Koch K, Wallace E. Biological characterization of ARRY-142886 (AZD6244), a potent, highly selective mitogen-activated protein kinase kinase 1/2 inhibitor. Clin Cancer Res. 2007;13:1576–1583. doi: 10.1158/1078-0432.CCR-06-1150. [DOI] [PubMed] [Google Scholar]
- 32.Maira SM, Pecchi S, Huang A, Burger M, Knapp M, Sterker D, Schnell C, Guthy D, Nagel T, Wiesmann M, Brachmann S, Fritsch C, Dorsch M, Chene P, Shoemaker K, De Pover A, Menezes D, Martiny-Baron G, Fabbro D, Wilson CJ, Schlegel R, Hofmann F, Garcia-Echeverria C, Sellers WR, Voliva CF. Identification and characterization of NVP-BKM120, an orally available pan-class I PI3-kinase inhibitor. Mol Cancer Ther. 2012;11:317–328. doi: 10.1158/1535-7163.MCT-11-0474. [DOI] [PubMed] [Google Scholar]
- 33.Folkes AJ, Ahmadi K, Alderton WK, Alix S, Baker SJ, Box G, Chuckowree IS, Clarke PA, Depledge P, Eccles SA, Friedman LS, Hayes A, Hancox TC, Kugendradas A, Lensun L, Moore P, Olivero AG, Pang J, Patel S, Pergl-Wilson GH, Raynaud FI, Robson A, Saghir N, Salphati L, Sohal S, Ultsch MH, Valenti M, Wallweber HJ, Wan NC, Wiesmann C, Workman P, Zhyvoloup A, Zvelebil MJ, Shuttleworth SJ. The identification of 2-(1H-indazol-4-yl)-6-(4-methanesulfonyl-piperazin-1-ylmethyl)-4-morpholin-4-yl-thieno[3,2-d] pyrimidine (GDC-0941) as a potent, selective, orally bioavailable inhibitor of class I PI3 kinase for the treatment of cancer. J Med Chem. 2008;51:5522–5532. doi: 10.1021/jm800295d. [DOI] [PubMed] [Google Scholar]
- 34.Maira SM, Stauffer F, Brueggen J, Furet P, Schnell C, Fritsch C, Brachmann S, Chene P, De Pover A, Schoemaker K, Fabbro D, Gabriel D, Simonen M, Murphy L, Finan P, Sellers W, Garcia-Echeverria C. Identification and characterization of NVP-BEZ235, a new orally available dual phosphatidylinositol 3-kinase/mammalian target of rapamycin inhibitor with potent in vivo antitumor activity. Mol Cancer Ther. 2008;7:1851–1863. doi: 10.1158/1535-7163.MCT-08-0017. [DOI] [PubMed] [Google Scholar]
- 35.Garcia-Martinez JM, Moran J, Clarke RG, Gray A, Cosulich SC, Chresta CM, Alessi DR. Ku-0063794 is a specific inhibitor of the mammalian target of rapamycin (mTOR) Biochem J. 2009;421:29–42. doi: 10.1042/BJ20090489. [DOI] [PMC free article] [PubMed] [Google Scholar]
- 36.Cerami E, Gao J, Dogrusoz U, Gross BE, Sumer SO, Aksoy BA, Jacobsen A, Byrne CJ, Heuer ML, Larsson E, Antipin Y, Reva B, Goldberg AP, Sander C, Schultz N. The cBio cancer genomics portal: an open platform for exploring multidimensional cancer genomics data. Cancer Discov. 2012;2:401–404. doi: 10.1158/2159-8290.CD-12-0095. [DOI] [PMC free article] [PubMed] [Google Scholar]
- 37.Subramanian A, Tamayo P, Mootha VK, Mukherjee S, Ebert BL, Gillette MA, Paulovich A, Pomeroy SL, Golub TR, Lander ES, Mesirov JP. Gene set enrichment analysis: a knowledge-based approach for interpreting genome-wide expression profiles. Proc Natl Acad Sci U S A. 2005;102:15545–15550. doi: 10.1073/pnas.0506580102. [DOI] [PMC free article] [PubMed] [Google Scholar]
- 38.Wohrle FU, Daly RJ, Brummer T. Function, regulation and pathological roles of the Gab/DOS docking proteins. Cell Commun Signal. 2009;7:22. doi: 10.1186/1478-811X-7-22. [DOI] [PMC free article] [PubMed] [Google Scholar]
- 39.Massacesi C, Di Tomaso E, Urban P, Germa C, Quadt C, Trandafir L, Aimone P, Fretault N, Dharan B, Tavorath R, Hirawat S. PI3K inhibitors as new cancer therapeutics: implications for clinical trial design. Onco Targets Ther. 2016;9:203–210. doi: 10.2147/OTT.S89967. [DOI] [PMC free article] [PubMed] [Google Scholar]
- 40.Czabotar PE, Lessene G, Strasser A, Adams JM. Control of apoptosis by the BCL-2 protein family: implications for physiology and therapy. Nat Rev Mol Cell Biol. 2014;15:49–63. doi: 10.1038/nrm3722. [DOI] [PubMed] [Google Scholar]
- 41.Bentires-Alj M, Paez JG, David FS, Keilhack H, Halmos B, Naoki K, Maris JM, Richardson A, Bardelli A, Sugarbaker DJ, Richards WG, Du J, Girard L, Minna JD, Loh ML, Fisher DE, Velculescu VE, Vogelstein B, Meyerson M, Sellers WR, Neel BG. Activating mutations of the noonan syndrome-associated SHP2/PTPN11 gene in human solid tumors and adult acute myelogenous leukemia. Cancer Res. 2004;64:8816–8820. doi: 10.1158/0008-5472.CAN-04-1923. [DOI] [PubMed] [Google Scholar]
- 42.Schneeberger VE, Ren Y, Luetteke N, Huang Q, Chen L, Lawrence HR, Lawrence NJ, Haura EB, Koomen JM, Coppola D, Wu J. Inhibition of Shp2 suppresses mutant EGFR-induced lung tumors in transgenic mouse model of lung adenocarcinoma. Oncotarget. 2015;6:6191–6202. doi: 10.18632/oncotarget.3356. [DOI] [PMC free article] [PubMed] [Google Scholar]
- 43.Prahallad A, Heynen GJ, Germano G, Willems SM, Evers B, Vecchione L, Gambino V, Lieftink C, Beijersbergen RL, Di Nicolantonio F, Bardelli A, Bernards R. PTPN11 is a central node in intrinsic and acquired resistance to targeted cancer drugs. Cell Rep. 2015;12:1978–1985. doi: 10.1016/j.celrep.2015.08.037. [DOI] [PubMed] [Google Scholar]
- 44.Gu S, Chan WW, Mohi G, Rosenbaum J, Sayad A, Lu Z, Virtanen C, Li S, Neel BG, Van Etten RA. Distinct GAB2 signaling pathways are essential for myeloid and lymphoid transformation and leukemogenesis by BCR-ABL1. Blood. 2016;127:1803–1813. doi: 10.1182/blood-2015-06-653006. [DOI] [PMC free article] [PubMed] [Google Scholar]
- 45.Salmond RJ, Alexander DR. SHP2 forecast for the immune system: fog gradually clearing. Trends Immunol. 2006;27:154–160. doi: 10.1016/j.it.2006.01.007. [DOI] [PubMed] [Google Scholar]
- 46.Marchion DC, Cottrill HM, Xiong Y, Chen N, Bicaku E, Fulp WJ, Bansal N, Chon HS, Stickles XB, Kamath SG, Hakam A, Li L, Su D, Moreno C, Judson PL, Berchuck A, Wenham RM, Apte SM, Gonzalez-Bosquet J, Bloom GC, Eschrich SA, Sebti S, Chen DT, Lancaster JM. BAD phosphorylation determines ovarian cancer chemosensitivity and patient survival. Clin Cancer Res. 2011;17:6356–6366. doi: 10.1158/1078-0432.CCR-11-0735. [DOI] [PMC free article] [PubMed] [Google Scholar]
- 47.Wang J, Zhou JY, Wu GS. Bim protein degradation contributes to cisplatin resistance. J Biol Chem. 2011;286:22384–22392. doi: 10.1074/jbc.M111.239566. [DOI] [PMC free article] [PubMed] [Google Scholar]
- 48.Puthalakath H, Huang DC, O’Reilly LA, King SM, Strasser A. The proapoptotic activity of the Bcl-2 family member Bim is regulated by interaction with the dynein motor complex. Mol Cell. 1999;3:287–296. doi: 10.1016/s1097-2765(00)80456-6. [DOI] [PubMed] [Google Scholar]
- 49.Tan TT, Degenhardt K, Nelson DA, Beaudoin B, Nieves-Neira W, Bouillet P, Villunger A, Adams JM, White E. Key roles of BIM-driven apoptosis in epithelial tumors and rational chemotherapy. Cancer Cell. 2005;7:227–238. doi: 10.1016/j.ccr.2005.02.008. [DOI] [PubMed] [Google Scholar]
- 50.Sunters A, Fernandez de Mattos S, Stahl M, Brosens JJ, Zoumpoulidou G, Saunders CA, Coffer PJ, Medema RH, Coombes RC, Lam EW. FoxO3a transcriptional regulation of Bim controls apoptosis in paclitaxel-treated breast cancer cell lines. J Biol Chem. 2003;278:49795–49805. doi: 10.1074/jbc.M309523200. [DOI] [PubMed] [Google Scholar]
- 51.Fang X, Yu S, Eder A, Mao M, Bast RC Jr, Boyd D, Mills GB. Regulation of BAD phosphorylation at serine 112 by the Ras-mitogen-activated protein kinase pathway. Oncogene. 1999;18:6635–6640. doi: 10.1038/sj.onc.1203076. [DOI] [PubMed] [Google Scholar]