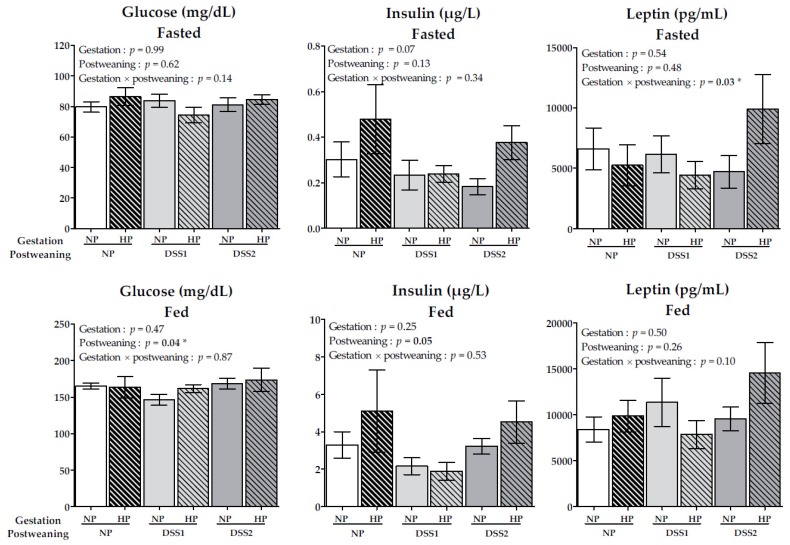
Figure 4.
Fasted and fed (90 minutes after calibrated meal) blood and plasma glucose (mg/dL), insulin (µg/L) and leptin (pg/mL) levels. Data are means ± SEMs. Effects of diets were tested within model W (*, P < 0.05). NP, Normal-Protein (control); HP, High-Protein; DSS1, Dietary Self-Selection 1 (P and G/L in 2 different cups); DSS2, Dietary Self-Selection 2 (P, G and L in 3 different cups).

