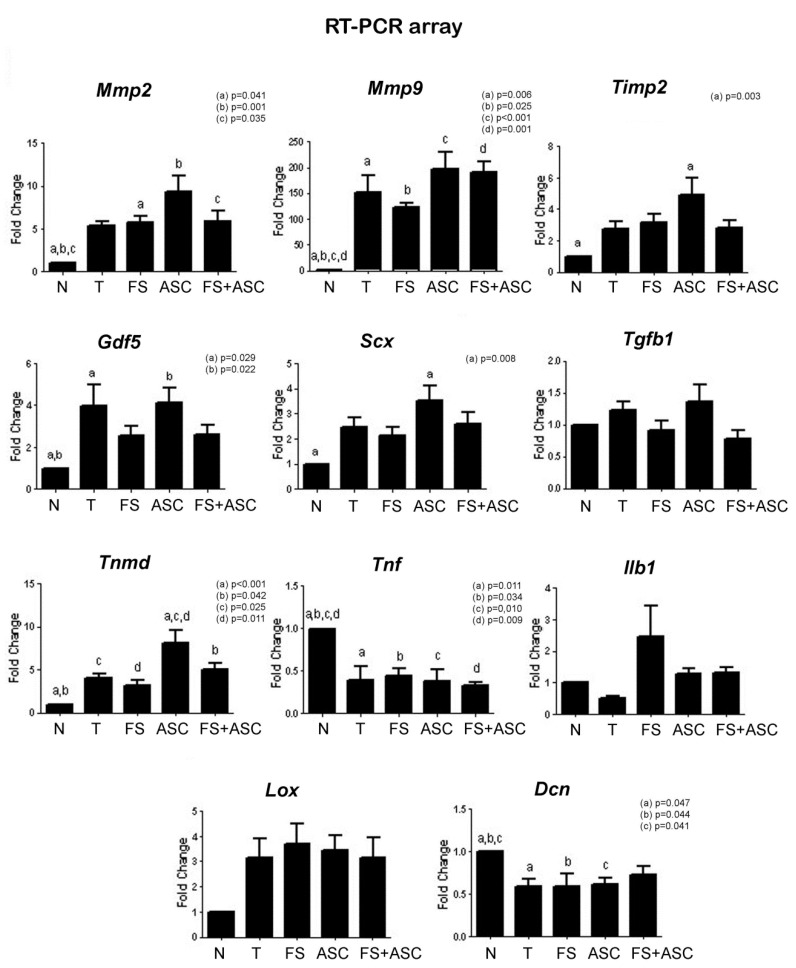
Figure 6.
Real-time PCR array data of genes on the 21st day after the tendon transection (n = 4). Note the higher Tnmd expression in the ASC group in relation to the T and FS. Difference between N group and T, FS, ASC and FS + ASC groups can be observed for genes expression of Mmp2, Mmp9, Timp2, Gdf5, Scx, Tnmd, Tnf and Dcn. Same letters (a, b, c, d) = significant difference between the groups.

