Abstract
Combining statistical significances (P-values) from a set of single-locus association tests in genome-wide association studies is a proof-of-principle method for identifying disease-associated genomic segments, functional genes and biological pathways. We review P-value combinations for genome-wide association studies and introduce an integrated analysis tool, Omnibus P-value Association Tests (OPATs), which provides popular analysis methods of P-value combinations. The software OPATs programmed in R and R graphical user interface features a user-friendly interface. In addition to analysis modules for data quality control and single-locus association tests, OPATs provides three types of set-based association test: window-, gene- and biopathway-based association tests. P-value combinations with or without threshold and rank truncation are provided. The significance of a set-based association test is evaluated by using resampling procedures. Performance of the set-based association tests in OPATs has been evaluated by simulation studies and real data analyses. These set-based association tests help boost the statistical power, alleviate the multiple-testing problem, reduce the impact of genetic heterogeneity, increase the replication efficiency of association tests and facilitate the interpretation of association signals by streamlining the testing procedures and integrating the genetic effects of multiple variants in genomic regions of biological relevance. In summary, P-value combinations facilitate the identification of marker sets associated with disease susceptibility and uncover missing heritability in association studies, thereby establishing a foundation for the genetic dissection of complex diseases and traits. OPATs provides an easy-to-use and statistically powerful analysis tool for P-value combinations. OPATs, examples, and user guide can be downloaded from http://www.stat.sinica.edu.tw/hsinchou/genetics/association/OPATs.htm.
Keywords: OPATs, P-value combination, genetic association, genome-wide association study
Introduction
The P-values from a set of statistical tests in the same or different studies have been combined to summarize the statistical significance of multiple tests. Tippett [1] proposed the minimum P-value method (MPM), Fisher [2] proposed the product P-value method (PPM) and Good [3] proposed the weighted PPM (WPPM). Other P-value combination methods have been developed by Stouffer et al. [4], Pearson [5], Wilkinson [6] and Edgington [7] but did not attract as much attention as did the PPM and MPM in real applications.
Zaykin et al. [8] proposed the truncated PPM (TPPM), which combines only P-values less than a prespecified P-value threshold (e.g. ) in the PPM. In this study, the TPPM was introduced as a multilocus association test with a multiple-test adjustment that aimed to increase the statistical power of multiple individual tests in a genetic association study. Neuhäuser and Bretz [9] suggested an adaptive TPPM (ATPPM) procedure and applied it to clinical trials. Since 2006, we have applied the TPPM in practical studies and extended the method. Yang et al. [10] introduced a sliding window empirical P-value test as one of the earliest pooled DNA multipoint association tests by implementing the MPM, PPM, TPPM, sum P-value method (SPM) and truncated SPM (TSPM) in each slide window. The method was implemented in the PDA software [10]. Yang et al. [11] proposed a unified (weighted) P-value combination method that incorporated linkage disequilibrium (LD) and/or physical distance (PD) as weights; the MPM, PPM, TPPM, SPM and TSPM became special cases of this approach. For example, the WPPM-LD, WPPM-PD and WPPM-LDPD are three weighted tests of the PPM. This approach supersedes the conventional unweighted approaches by alleviating the false-positive rate and increasing the testing power when nuisance markers are included. Yang et al. [12] further proposed the kernel-based association test (KBAT) by modifying the weight functions reported in Yang et al. [11]; the KBAT-PD uses a PD weight, and the KBAT-PDLD combines PD and LD weights. In addition to sharing merits with the weighted methods in Yang et al. [11], the KBAT is invariant to the genetic map scale. The method was implemented in the KBAT software. Yang et al. [13] applied the TPPM to a genome-wide gene-based association study, and Yang and Chen [14] further applied the TPPM to region- and biopathway-based quantitative trait locus mapping in a DNA sequencing study.
In contrast to the TPPM, some researchers developed their P-value combination methods by using the rank truncated PPM (RTPPM) [15], which combines a fixed number of the most significant P-values (e.g. K = 10) in the PPM. Statistical power of the RTPPM is sensitive to the choice of the prespecified number K, particularly in a genome-wide association study involving of a large number of statistical tests. To address this problem of the choice of rank truncation, the adaptive RTPPM (ARTPPM), which calculates the minimum of RTPPM statistics over different candidate K’s, has been developed [16–18]. Zhang et al. [19] and Chen et al. [20] have further considered all possible rank truncation points in the RTPPM.
In addition to the PPMs, Taylor and Tibshirani [21] proposed the tail strength method (TSM), which calculates the mean deviations of P-values from their expected values. Jiang et al. [22] proposed the truncated TSM (TTSM), which combines only P-values less than a prespecified P-value threshold in the TSM. Recently, Hu et al. [23] proposed the group-combined P-value (GCP) method. The GCP statistic is defined as the product of the group-level P-values; each of the group-level P-values was estimated using the TPPM or TTSM. Some P-value combination methods have been advocated to use additional data information such as LD and map information [10–12], gene information [13, 24], pathway information [14, 16, 25–27] and effect size information [28].
The exact sampling distributions of some P-value combinations, including the PPM [2], WPPM [3], TPPM [8] and RTPPM [15], can be derived under the independence assumption of P-values. However, the distribution becomes intractable if the P-values are dependent. Some studies have accounted for P-value dependency, but strong model assumptions are required. The sampling distribution approximations highly rely on the model assumptions and restrict their real applications (Brown [29]; Kost and McDermott [30]). To address this problem, resampling procedures [e.g. permutation (PT) and Monte Carlo (MC)] have been used to calculate empirical P-values [8, 31]. Phenotype-based PT, which randomly shuffles phenotypic data [32], is a method to generate a large amount of replicated data according to a null hypothesis (i.e. no genetic association between a genetic marker and disease). This procedure is computationally intensive and requires phenotypic data. Genotype-based PT is an alternative to phenotype-based PT. However, this procedure is not recommended in a genetic association study because (1) highly intensive PTs are required, particularly for a genome-wide association study and (2) the original LD structures are destroyed. The MC method is another suitable resampling procedure, particularly for P-value combinations [8, 11, 12]. This method can generate P-value sequence data according to a null hypothesis without needing raw phenotype and genotype data. Typically, this method involves less computation compared with PT, but some parametric assumptions are required. With PT or the MC method, the computational burden is a concern, particularly in a large-scale genome-wide association study. Some computationally efficient sampling procedures were proposed to reduce computation burden and not sacrifice the estimation accuracy of empirical P-values [33]. Additional methods have been introduced to evaluate the statistical significance of dependent P-values, such as the estimation of an effective number of independent tests [17, 34] and decorrelation procedure [17, 25].
In contrast to single-locus association tests, a P-value combination method is a set-based association test (i.e. a multilocus association test) in genetic and genomic research. This method is advantageous because it can boost the statistical power by incorporating the joint effects of multiple genetic variants, alleviate the multiple-testing problem by reducing the number of association tests, reduce the impact of genetic heterogeneity, increase the replication efficiency of association tests by considering all genetic variants in the same biological units (region, gene or pathway) and facilitate the interpretation of association signals through reference to biologically relevant annotations of genes and pathways [24, 35]. According to study aims, a set is defined as a sliding window, gene, biopathway or other biological units of interest (e.g. an LD block). In addition to a single-nucleotide polymorphism (SNP)-based association study [36], P-value combination methods have been broadly applied in various fields, including transcriptomics [37–40], proteomics [41] and DNA sequencing studies [14, 42].
Although some software, such as PLINK [43], VEGAS2 [44] and GCTA-fastBAT [45], address set-based genome-wide association tests, Omnibus P-value Association Tests (OPATs), which comprises threshold and rank truncation procedures, represents a user-friendly and statistically powerful analysis tool with reasonable computational efficiency for set-based association tests in a genetic or genomic association study.
Method
Window-based association test
Let from SNP-based association tests indicate a P-value sequence of c SNPs ordered according to physical position on a chromosome. Let indicate a window anchored at the jth SNP that contains m SNPs before and after the anchor SNP. Let indicate a weight assigned to the kth SNP in the window. The function indicates a P-value transformation (e.g. log transformation). The constant is a threshold for P-value truncation. The indicator function corresponds to 1 in case of event A; otherwise, the value is 0. The threshold-truncated Window-based association test (WBAT) partitions into sliding windows and the following P-value combinations are calculated in each window as follows:
where the weights satisfy . The rank-truncated WBAT is written as follows:
where are the K smallest order statistics of , and the corresponding weights satisfy .
Let and indicate standardized PD and LD between the kth SNP and the anchor SNP j in window , respectively. The weight of the kth SNP in window is defined as a function of PD and/or LD [11, 12] as follows:
where when calculating in the threshold-truncated WBAT and when calculating in the rank-truncated WBAT. PD can be obtained from SNP positions or further transformed by using a kernel function [12]. LD can be obtained from public databases such as the International HapMap Project [46] and the 1000 Genomes Project [47], or calculated based on genotype data.
The empirical P-value of a WBAT is calculated using resampling procedures, as shown in the ‘Resampling’ subsection, and this empirical P-value is used to examine the genetic association of the sliding window with a study disease. OPATs provides several test statistics of the WBAT, namely, the MPM, PPM, weighted PPM (WPPM-PD, WPPM-LD and WPPM-PDLD) and KBAT (KBAT-PD and KBAT-PDLD).
Gene-based association test
For notational convenience, the gene-based association test (GBAT) and biopathway-based association test (BBAT) are introduced in a three-layer structure of P-values as follows. Let indicate the P-value of the kth SNP in the jth gene involved in the ith biopathway from a single-locus association test. Let indicate a weight assigned to the kth SNP in the jth gene involved in the ith biopathway. Let indicate the number of SNPs in the jth gene involved in the ith biopathway, indicate the number of genes involved in the ith biopathway and indicate the number of biopathways. In a single-locus association analysis, is used to identify SNPs associated with a study disease. In a threshold-truncated gene-based association analysis, a gene-based P-value of the jth gene involved in the ith biopathway is calculated according to the following P-value combination of SNPs by using a resampling procedure:
where weights satisfy . The rank-truncated GBAT is written as follows:
where are the K smallest order statistics of , and the corresponding weights satisfy . The weight in the threshold-truncated GBAT (i.e. ) and the weight in the rank-truncated GBAT (i.e. ) can be assigned according to SNP importance (e.g. effect size, biological functionality and marker informativeness) that the information can come from the studied data or external resources. The details about weight assignment in OPATs can refer to the ‘Data input’ section in the online user guide.
The obtained empirical P-value is used to identify genes associated with a study disease. If a gene is not involved in any biopathway, the aforementioned procedures still apply. Index i can be omitted or imagined as an index for pseudo biopathway containing the gene. OPATs provides several test statistics of the GBAT, namely the MPM and PPM. In addition to SNPs in a gene region, OPATs provides several options for GBAT to include important SNPs outside a gene body (e.g. SNPs on promoters or transcription starting sites). OPATs enables a gene region to be extended upstream and downstream by a prespecified width. Moreover, two analysis strategies, namely a pure gene-based analysis and a SNP/gene-based analysis, are implemented. A pure gene-based analysis only analyzes intragenic SNPs. In a SNP/gene-based analysis, intergenic SNPs are analyzed individually through SNP-based association tests and intragenic SNPs are analyzed through GBATs.
Biopathway-based association test
The BBAT is divided into two types: gene- and SNP-level BBATs. To consider a gene-level BBAT, a threshold-truncated biopathway-based P-value of the ith biopathway is calculated according to the following P-value combination of genes by using a resampling procedure:
where and weights satisfy . The rank-truncated BBAT is written as follows:
where are the K smallest order statistics of , and the corresponding weights satisfy . The empirical P-value is used to identify the biopathways associated with a study disease.
To consider a SNP-level BBAT, a threshold-truncated biopathway P-value of the ith biopathway can be calculated according to the following P-value combination of SNPs by using a resampling procedure:
where the weights satisfy . The rank-truncated BBAT is written as follows:
where are the K smallest order statistics of , and the corresponding weights satisfy . This empirical P-value can also be used to identify the biopathways associated with a study disease. Similar to the GBAT, weights in BBAT can be assigned according to SNP or gene importance and study purposes. The details can refer to the ‘Data input’ section in the online user guide.
OPATs provides several test statistics of the BBAT, namely, the MPM and PPM. The test statistics are provided with and without P-value truncations. Similar to the GBAT, gene regions in a biopathway can be extended. OPATs provides both pure gene-level and SNP-level biopathway analyses.
OPATs can apply the adaptive rank truncation or adaptive threshold truncation procedure to the test statistics in the ‘Window-based association test’, ‘Gene-based association test’ and ‘Biopathway-based association test’ subsections by providing multiple truncation thresholds or ranks. For a specific test statistic, the minimum of the empirical P-values of the test statistic over different truncation thresholds ’s or truncation ranks K’s is calculated. Finally, the empirical P-value of the minimum statistic is calculated by resampling procedures to evaluate the genetic association of the window, gene and biopathway with a study disease.
Resampling
Two resampling procedures for the calculation of an empirical P-value are implemented in OPATs. One is a MC procedure proposed by Zaykin et al. [8]. This resampling procedure can be applied to P-value sequence data analysis. The other is a PT procedure that requires phenotype and genotype data. Genotype data are fixed, but phenotypes of all study samples are randomly shuffled in a continuous phenotype analysis, or sample groups (e.g. case and control) are randomly shuffled in a categorical phenotype analysis.
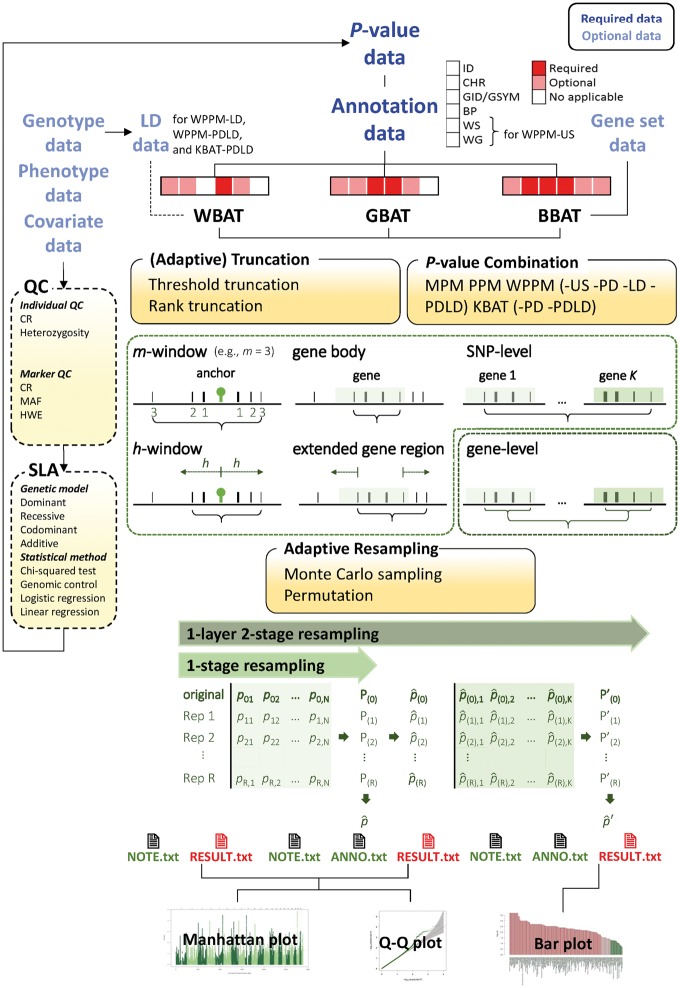
To maintain a balance between the computational time of a resampling and accuracy of the estimated empirical P-value, an adaptive procedure is implemented in OPATs. Resampled samples are generated batchwise rather than as a large initial number. To save computational time, resampling is stopped in an early batch if a low confidence limit for empirical P-value estimates according to a binomial model is higher than a prespecified significance level (default setting: 0.05) [43]. Moreover, to increase the accuracy of the estimated empirical P-value, more resampling samples are continuously generated batchwise (default setting: 1000 samples in a batch), and empirical P-values are calculated if no test statistics in the resampling samples exceed the statistic of the real data in the early batches. The procedure continues at least until an excess is observed or a Bonferroni level is achieved (see the ‘Implementation’ subsection). To alleviate the computational burden, OPATs applies the one-layer resampling procedure [16] to calculate the empirical P-values of the gene-level BBAT and adaptive truncation statistics. Structure of OPATs is shown in Figure 1.
Figure 1.
Structure of OPATs.
Initialization, implementation and input and output of OPATs
Initialization
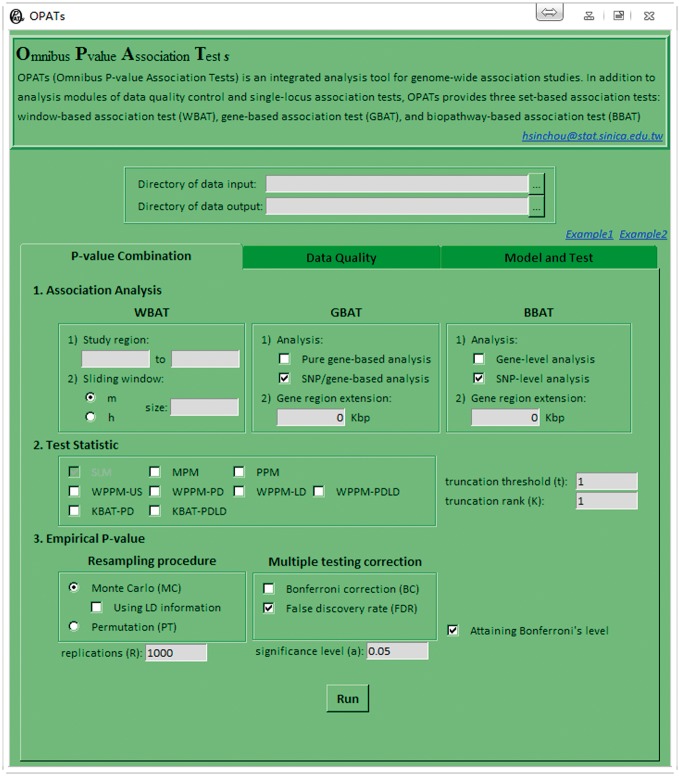
Once OPATs is downloaded and unzipped, all files must be saved in the same destination directory, such as ‘D:/OPATs’. OPATs can be initialized by double clicking the executable file OPATs.bat; then, the OPATs’ interface is activated, as shown in Figure 2.
Figure 2.
Initial OPATs’ interface (the P-value Combination tab).
Implementation
As shown in Figure 2, the OPATs’ interface comprises three parts. The first part is a preface to introduce OPATs. The second part contains the directories of data input and output. Users can either directly type the paths of directories into the edit boxes or press the Browse button to select directories. The input directory must be specified. An output directory named Output under the input directory is automatically generated if not specified. The final part contains the following three function tabs.
The first function tab: P-value Combination
This tab comprises the following components (Figure 2): (1) association analysis, (2) test statistic and (3) empirical P-value.
- The association analysis component provides three types of set-based association analyses, namely, the WBAT, GBAT and BBAT.
- The WBAT inherits a sliding window analysis from the KBAT, which was developed to analyze P-value sequence data (see the ‘Window-based association test’ subsection). When the directory of data input is specified, OPATs automatically detects the total number of genetic markers in the P-value file (.pv) (see the ‘Data input’ section in the online user guide) and displays the numbers of the first and last markers in the study region. These numbers can be changed to restrict the analysis to a subset of markers. The number of markers m and bandwidth h in size are used to determine the sliding window.
- The GBAT offers two types of gene-based association analyses, namely, the pure gene-based analysis and SNP/gene-based analysis (see the ‘Gene-based association test’ subsection). Moreover, by typing a value (unit: kb) in gene region extension, OPATs extends the study gene regions to a range between this value upstream of the first marker and downstream of the last marker. Physical positions of the first and last markers on a gene are provided in an Annotation file (.anno) (see the ‘Data input’ section in the online user guide).
- The BBAT offers two types of biopathway-based association analyses, namely, gene-level analysis and SNP-level analysis (see the ‘Biopathway-based association test’ subsection). Similar to the GBAT, users can extend the study gene regions by typing a value (unit: kb) in gene region extension. Biopathway information is provided in a gene set file (.gmt) (see the ‘Data input’ section in the online user guide).
The test statistic component offers several P-value combination statistics, namely, the MPM, PPM, WPPM-US, WPPM-PD, WPPM-LD, WPPM-PDLD, KBAT-PD and KBAT-PDLD. OPATs can run multiple statistics simultaneously. However, not all statistics are suitable for every set-based association analysis; the statistics not suitable to the specified set-based association analysis are disabled. OPATs provides a general P-value combination procedure combined with adaptive rank or threshold truncation. Users can consider different truncation methods individually or simultaneously and different truncation values by specifying multiple truncation points.
- The empirical P-value component offers two empirical P-value calculation methods and two multiple-testing correction methods.
- Resampling procedure offers MC and PT options. MC is suitable for analyzing P-value sequence and genotype data, and PT is only suitable for analyzing genotype data. When using LD information is applied, OPATs uses LD information in MC. The number of replications for MC and PT must be provided in replications (R). A minimum value of 1000 is recommended.
- Multiple-testing correction provides Bonferroni correction and false discovery rate (FDR). A significance level must be specified in the significance level (a).
- The attaining Bonferroni’s level option allows OPATs continue redrawing samples to increase the accuracy of the estimated empirical P-value when no test statistics in the resampling samples exceed the test statistic in the real data. For example, if the number of single-locus association tests is 106, and significance level is 0.01, then at most 108 replications can be resampled.
If only P-value data are provided, after the settings in the aforementioned steps, users can press the Run button at the bottom of OPATs to start the analysis. If genotype data are provided, users must set quality control criteria in the second function tab (Data Quality) and select a genetic model in the third function tab (Model and Test).
The second function tab: Data Quality
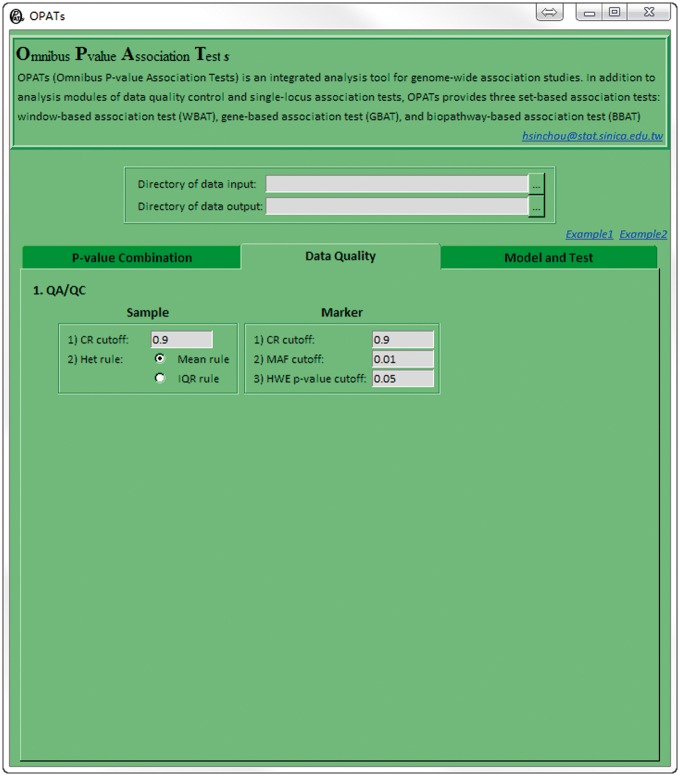
As shown in Figure 3, users can eliminate poor-quality individuals and markers by using genotypic data. For sample quality control, thresholds in the call rate (CR) cutoff and Het rule are set to exclude individuals with a low CR (i.e. a high missing rate) or with outliers of heterozygosity rates in terms of mean (Mean rule) or interquartile range (IQR; IQR rule), respectively. For marker quality control, thresholds in the CR, minor allele frequency (MAF) and Hardy–Weinberg equilibrium (HWE) P-value cutoffs are set to eliminate markers with a low CR, small MAF or deviation from the HWE, respectively. OPATs evaluates the HWE in a control group in a case-control study; otherwise, the HWE is assessed for all samples.
Figure 3.
Second OPATs’ interface (the Data Quality tab).
The third function tab: Model and Test
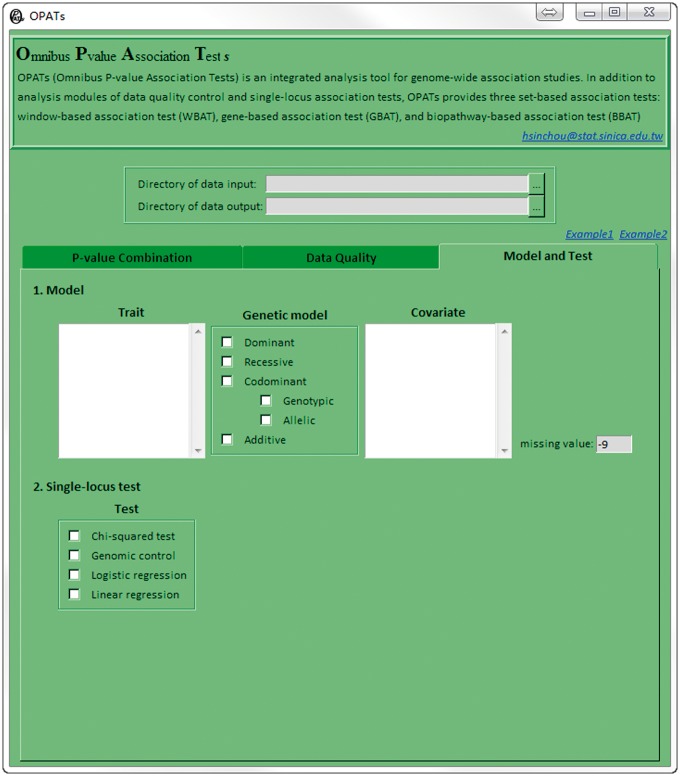
After data quality control, users must set genetic models and single-locus association tests in the third function tab (Model and Test; Figure 4). This tab comprises two components: (1) Model and (2) Single-locus test. OPATs cooperates with PLINK, one of the most popular data analysis toolsets with high computational efficiency for genome-wide association study, to conduct single-locus association tests.
Figure 4.
Third OPATs’ interface (the Model and Test tab).
-
The Model component is used to specify the following three settings:
Trait: This window lists all variables in the phenotype file (.pheno) (see the ‘Data input’ section in the online user guide). Users select one response variable. According to the variable type (continuous or dichotomous), OPATs suggests the suitable single-locus association tests in test.
Genetic model: Users can select dominant, recessive, codominant (genotypic and allelic) and/or additive models.
Covariate: This window lists all variables in a covariate file (.cov) (see the ‘Data input’ section in the online user guide). Users select the variables to be adjusted for in a regression model. When a covariate(s) is selected, the regression model is the only choice in test.
The Single-locus test component provides several single-locus association tests, namely, χ2 test, genomic control [48] and two regression models (logistic regression and linear regression). Selection of the tests is related to the setting in trait and covariate. For a continuous trait, only linear regression can be selected. For a dichotomous trait, χ2 test, genomic control and logistic regression can be selected if no covariate adjustment is applied, and only logistic regression can be selected if a covariate adjustment is applied.
In addition to the Windows graphical user interface (GUI) environment, OPATs can be executed using command lines under the Windows and Linux environments. The commands and options are provided in the ‘Initialization and Implementation’ section in the online user guide.
Data input
The WBAT and GBAT analyze P-value data (or genotypic data) and annotation data. The BBAT analyzes P-value data (or genotypic data), annotation data and gene set data. All data consist of P-value data (.pv), annotation data (.anno), gene set data (.gmt), genotypic data, phenotypic data (.pheno), covariate data (.cov) and LD data (.ld). The input data formats are illustrated in the ‘Data input’ section in the online user guide.
Result output
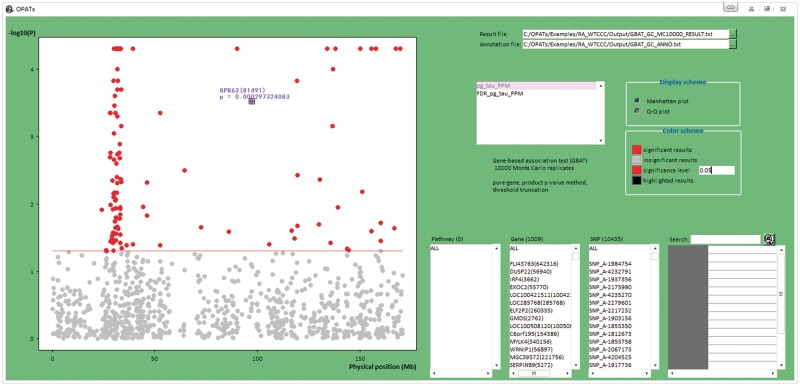
When an analysis is complete, numerical (.txt) and graphical (.pdf) results will be automatically generated and save in the specified output directory. Numerical results contain three files: Description file (_NOTE.txt), Annotation file (_ANNO.txt) and Result file (_RESULT.txt). The contents of each file can refer to the ‘Result output’ section in the online user guide. The graphical results are Manhattan plots and quantile–quantile (Q-Q) plots of empirical P-values from different types of set-based association analyses, P-value sequences, truncation thresholds, test statistics and resampling procedures. The details are illustrated in the ‘Result output’ section in the online user guide. Meanwhile, graphical results are visually represented in the Output Viewer of OPATs (Figure 5).
Figure 5.
Output Viewer of OPATs.
The Output Viewer can also be used to display graphical outputs of previous analyses from OPATs. Users can either directly type the paths of the result and annotation files into the edit boxes, or press the Browse button to select files. Users can select to show a Manhattan plot or Q-Q plot in the left-hand side panel. In a Manhattan plot, users can select different color schemes to indicate significant and insignificant markers and the markers to be highlighted. Users can input a significance level to draw a horizontal reference line for the P-value. The biopathways, genes and SNPs analyzed in the data set are listed. If users click a specific gene in the ‘Gene’ panel, all SNPs located on this gene and their corresponding annotations will be shown in the ‘SNP’ and final panels, respectively. Users can also use the ‘Search’ function to search for biopathways, genes and SNPs of interest in the data set. Finally, if users are interested in any point in the Manhattan plot, they can move the mouse cursor to the point and click to show the detailed annotation information of the point.
Examples
OPATs provides two real examples. The data are provided in ‘D:/OPATs/Examples’. The first example analyzes P-value sequence data from a case-control study. The second example analyzes genotypic data from a population genetics study. These examples can be easily executed through the Example 1 and Example 2 hyperlinks on the first function tab (P-value Combination).
P-value data from a Wellcome Trust Case Control Consortium study
The Wellcome Trust Case Control Consortium (WTCCC) recruited 1999 rheumatoid arthritis (RA) cases and 3002 normal controls in the British population [49]. All samples were genotyped using Affymetrix Human Mapping 500K Array Set. The sample contained 490 032 autosomal SNPs. The asymptotic P-values of Armitage trend tests with genomic control [48] for 31 439 SNPs on chromosome 6 were calculated (P-value file: WTCCC.pv). SNP annotations comprising chromosome, physical position and gene information were prepared according to the National Center for Biotechnology Information (NCBI) 37.3 (annotation file: WTCCC.anno). Quality control information comprising the CR, MAF and HWE were provided in the annotation file.
In this analysis, the cutoffs for excluding poor-quality SNPs were assigned as follows: a genotype CR of <0.9, an MAF of <0.01 and a P-value for the HWE test of <0.05. WTCCC.pv and WTCCC.anno are provided in ‘D:/OPATs/Examples/RA_WTCCC’. Users can click Example1 on the P-value Combination tab and press the Run button to run the GBAT, or click the BBAT frame and press the Run button to run the BBAT.
For the GBAT, a pure gene-based GBAT analysis was performed; a TPPM with a truncation threshold of 0.05 was considered; the number of MC simulations was 10 000; and FDRs were performed for a multiple-testing correction with a significance level of 0.05. After data quality control, 25 244 SNPs remained, and 10 435 were intragenic SNPs on 1009 genes and included in the subsequent pure gene-based GBAT analysis. Figure 6 shows the Manhattan plot for the analysis. Red and gray points indicate significant and insignificant genes, respectively. A horizontal reference line indicates a P-value of 0.05. All the 1009 genes are displayed. This analysis identified some previously reported RA-associated genes, such as BTNL2, TNFAIP3 and a number of genes in the major histocompatibility complex region.
Figure 6.
Manhattan plot in the GBAT analysis of Example 1.
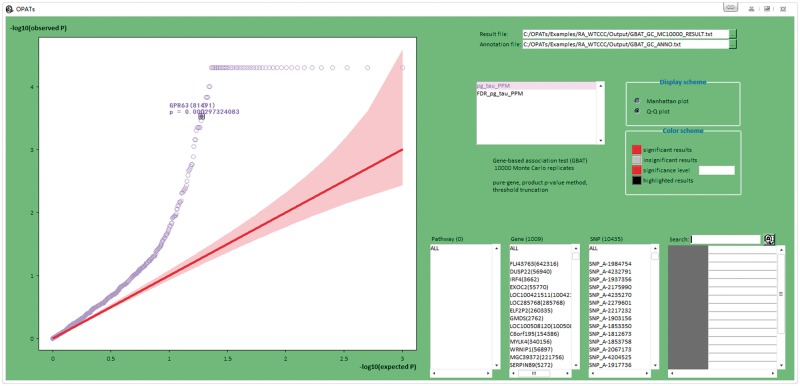
Figure 7 shows the Q-Q plot. The vertical axis (Y axis) indicates the observed P-values (in a −log10 scale), and horizontal axis (X axis) indicates the expected P-values (in a −log10 scale). A line of X = Y and the corresponding 95% confidence bands are provided.
Figure 7.
Q-Q plot in the GBAT analysis of Example 1.
A BBAT was conducted by using the BBAT. We used a gmt file (WTCCC.gmt) from Kyoto Encyclopedia of Genes and Genomes (KEGG) [50], which contains 303 biopathways. A pure gene-level biopathway analysis was performed; a TPPM with a truncation threshold of 0.05 was considered; the number of MC simulations was 10 000; and FDRs were performed for a multiple-testing correction with a significance level of 0.05. In total, 245 of the 303 biopathways provided data for analysis, and 91 biopathways were significant according to the FDR-adjusted P-values of <0.05. Some crucial biopathways associated with RA, such as mitogen-activated protein kinase signaling pathway and tumor necrosis factor signaling pathway, were identified in this example.
Sequencing data from the 1000 Genomes Project
The 1000 Genomes Project [47] provided a comprehensive catalog of different human genetic variations by performing next-generation sequencing experiments. In this example, we investigated ancestry informative markers for European and African ancestry populations according to 85 CEU (CEPH in Utah with European ancestry) and 88 YRI (Yoruba from Ibadan, Nigeria with African ancestry). Variant call format (VCF) files from the Web site of the 1KG Project (http://www.1000genomes.org/) were converted to transposed pedigree format files (genotype files: chr01_CEU.tped, chr01_CEU.tfam, chr01_YRI.tped, and chr01_YRI.tfam) by using VCFtools. To help users download data, we reduced the marker data through variant thinning that drew only one in every 100 variants on chromosome 1; this procedure retained 28 970 variants for the study. The Annotation file (chr01.anno) was prepared on the basis of NCBI 37.3. CEU and YRI were considered the case and control groups, respectively (phenotype file: chr01.pheno). All data files were saved in OPATs in ‘D:/OPATs/Examples/1KGP’. Users can click Example2 on the P-value Combination tab and press the Run button to run the WBAT.
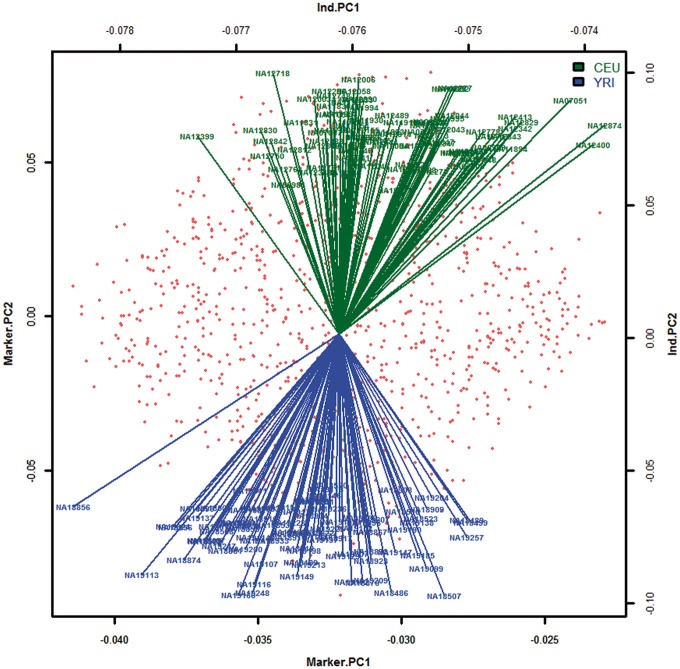
In data quality control, the cutoffs for the genotype CR, MAF and P-value for the HWE test were <0.9, <0 and <0.05, respectively. In total, 1047 variants were analyzed by the genotype-based χ2 test individually. Then a WBAT analysis was performed; a window size of 5 [i.e. an anchor marker in the middle and two additional variants on each side (m = 2)]; a TPPM with a truncation threshold of 0.05; the number of PTs was 10 000; and an FDR was performed with a significance level of 0.05. The results showed that 957 of the 1047 variants were statistically significant (i.e. ancestry informative markers) after FDR correction. On the basis of the identified ancestry informative variants, CEU and YRI samples were clearly separated in an allele frequency biplot (Figure 8).
Figure 8.
Biplot of 85 CEU and 88 YRI samples. CEU and YRI samples of Example 2 are shown with green and blue arrows, respectively. Red points indicate the identified ancestry informative markers.
Simulation study
We evaluated the performance of the main set-based association tests and two resampling procedures in OPATs, and compared with PLINK [43].
Simulation conditions
To mimic the real genomic structure, genotype data were generated from the WTCCC-RA data set in Example 1. The simulations considered the following factors and conditions: (1) phenotypes—a dichotomous disease status () and a quantitative trait (); (2) gene sizes ()—5, 10, 25, 50, 75 and 100 SNPs in the study gene region randomly chosen from the human genome; (3) resampling procedures—MC and PT; (4) test statistics—five core set-based association tests in OPATs [i.e. the PPM, TPPM, RTPPM, ATPPM and ARTPPM] and the default set-based test in PLINK [43]. Under each simulation condition, 1000 simulation replications were generated. Type 1 error and power of the set-based association tests were calculated.
Simulation procedures
The type 1 error analysis
In a dichotomous phenotype study, among 3002 normal controls in the WTCCC-RA data set, 500 individuals were randomly drawn and assigned to the case group (), and another 500 individuals were sampled and assigned to the control group (). In a quantitative trait study, phenotypes of 1000 individuals from the control group in the WTCCC-RA data set were generated from a standard normal distribution [i.e. )]. We included the SNPs that had passed quality control in the beginning of the simulation. Genotypes of the sampled individuals were adopted directly.
The power analysis
In a dichotomous phenotype study, 1000 individuals from the control group in the WTCCC-RA data set were sampled randomly and partitioned equally into the case group () and control group (). Genotypes of the control and case individuals were generated as follows: we considered a gene containing SNPs. Among the intragenic SNPs, SNPs were assigned as disease-associated SNPs. Let denote the joint genotypes of SNPs, where and denote genotypic values of d disease-associated SNPs and non-disease-associated SNPs, respectively. Genotypic value was coded as 0, 1 and 2 according to the counts of disease alleles. Let denote a collection of all possible genotype combinations of . Joint genotypes of the 500 case individuals were generated based on the following conditional distribution [16]:
where genotype distributions and can be estimated from the WTCCC-RA data set. Penetrance function was a logistic regression model as follows:
where indicates genetic effects of the disease-associated SNPs in the study gene, and indicates a log-scale disease odd unexplained by the study genes. Joint genotypes of the 500 control individuals were sampled according to the following conditional probability:
where . In this simulation study, we set d and , where .
In a quantitative trait study, 1000 individuals were randomly drawn from the control group in the WTCCC-RA data set. We considered quantitative trait loci in the study gene containing SNPs that they satisfied HWE and had no missing genotypes. We generated quantitative trait values of the 1000 individuals based on the conditional distribution: . In this simulation study, we set and , where .
Simulation results
The type 1 error analysis
Figures 9 and 10 summarize the results of the type 1 error analysis for a dichotomous and quantitative phenotype, respectively. We examine the impacts of phenotypes, gene sizes, resampling procedures and association tests on the type 1 error. Only resampling procedures show a non-negligible effect on the type 1 error. The PT-based methods (OPATs-PT and PLINK) control the type 1 error well; their type 1 errors are close to the prespecified significance level 0.05. Compared with the PT-based methods, the MC method (OPATs-MC) has reasonable type 1 errors with a slightly larger fluctuation range; the type 1 error ranges from 0.03 to 0.07.
Figure 9.
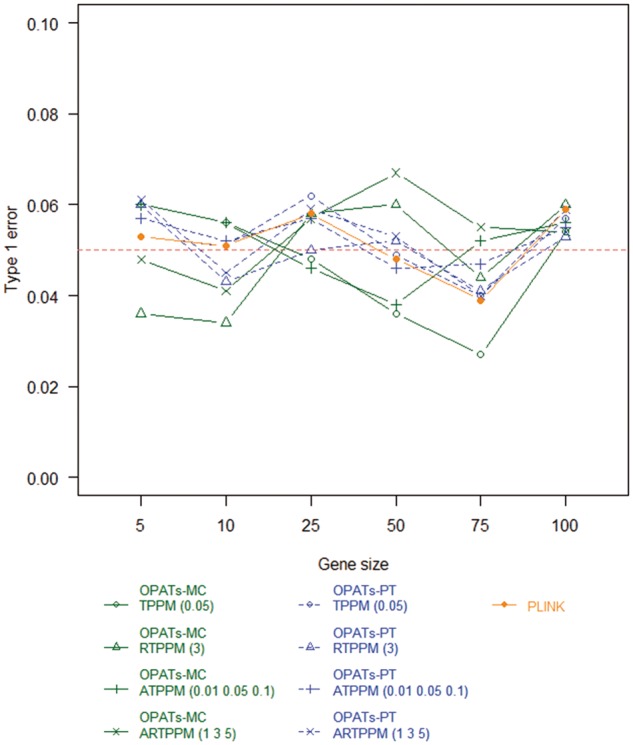
Type 1 errors of set-based association tests in a dichotomous phenotype analysis.
Figure 10.
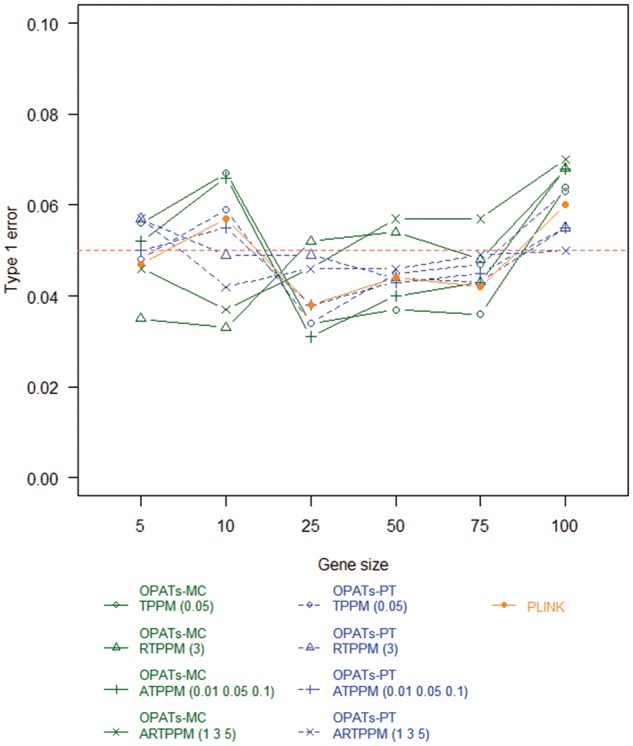
Type 1 errors of set-based association tests in a quantitative trait analysis.
The power analysis
Figures 11 and 12 summarize the results of the power analysis for a dichotomous and quantitative phenotype, respectively. We examine the impacts of phenotypes, gene sizes, resampling procedures and association tests on the power. First, a quantitative trait analysis shows a higher power than a dichotomous phenotype analysis. Second, no obvious relationship between gene size and power is observed. Third, no significant difference in power is found between the two resampling procedures. Finally, we investigate the impact of association tests on the power. RTPPM and ARTPPM in OPATs have a higher power than TPPM and ATPPM in OPATs and the set-based test in PLINK. RTPPM and ARTPPM in OPATs have similar statistical power. TPPM and ATPPM in OPATs and the set-based association test in PLINK have similar statistical power.
Figure 11.
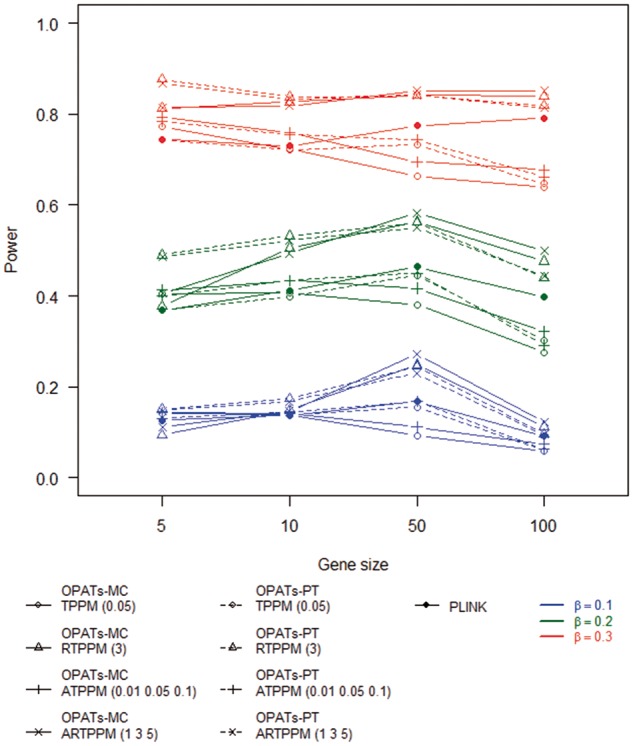
Statistical power of set-based association tests in a dichotomous phenotype analysis.
Figure 12.
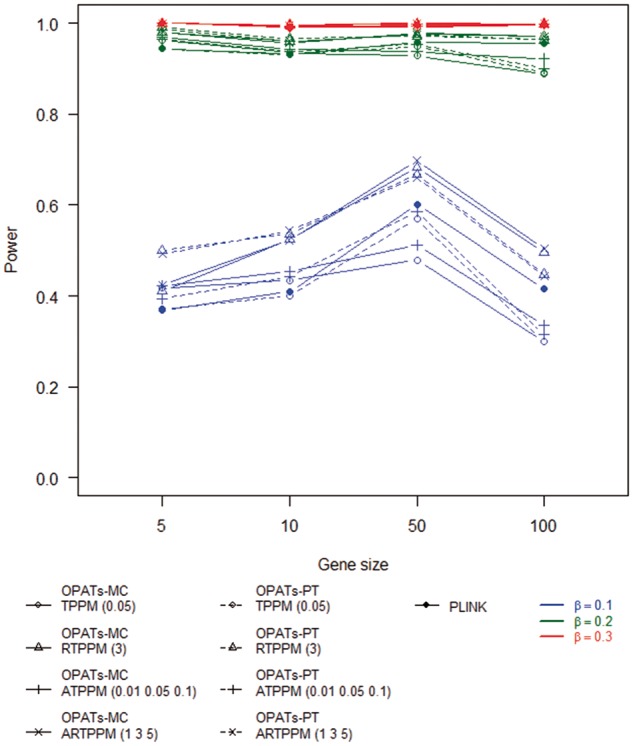
Statistical power of set-based association tests in a quantitative trait analysis.
Computational time
We evaluated computational time of association tests in OPATs and PLINK based on the aforementioned simulation studies of the type 1 error. In this simulation, gene size was set as 5, and the average computational time of 100 simulations was calculated. Figure 13 summarizes the results of computational time. First, we examine the impact of the numbers of resampling replications on computational time. All of the three methods (OPATs-MC, OPATs-PT and PLINK) have increased computational time when the number of resampling replications increases. Second, we investigate the impact of sample sizes on computational time. Only the PT-based methods (OPATs-PT and PLINK) have increased computational time when sample size increases; the MC method (OPATs-MC) is immune to a change of sample size. Finally, we evaluate the relative computational efficiency of the MC method (OPATs-MC) compared with the PT methods (OPATs-PT and PLINK). The relative efficiency of the MC method (OPATs-MC) increases as sample size increases. In a scenario of 1000 resampling replications, the MC method has 6.03, 9.39, 13.63 and 40.88-fold relative efficiency when sample size is 100, 500, 1000 and 5000, respectively. When the number of resampling replications increases to 104 (105 and 106), the MC method is 1.49 (3.50 and 2.72), 2.98 (6.42 and 6.95), 5.18 (9.31 and 9.22) and 13.69 (28.37 and 32.03)-fold more efficient than the PT methods.
Figure 13.
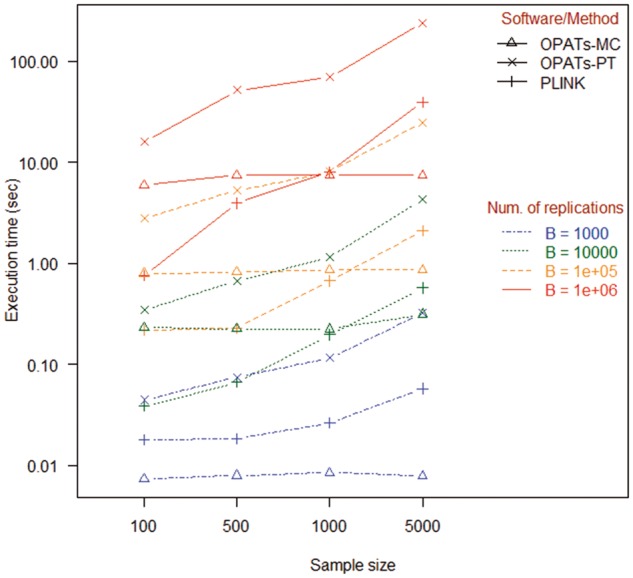
Comparison of computational time.
Conclusion and discussion
We review P-value combination in genome-wide association studies and develop user-friendly software OPATs under GPL_v2 license for a streamlined genetic and genomic association analysis. The analysis functions comprise data quality control (MAF, CR and HWE), SNP-based association tests (χ2 and genomic control tests as well as logistic and linear regression) and set-based association tests (WBAT, GBAT and BBAT). The set-based association tests can be applied for analyzing different phenotypic variables (continuous and categorical phenotype variables), modes of inheritance (dominant, recessive, codominant and additive models) and covariate information (demographic data and environment factors). Analyses by using OPATs are useful for identifying genetic markers and marker sets associated with complex diseases and traits of interest. OPATs can be downloaded from http://www.stat.sinica.edu.tw/hsinchou/genetics/association/OPATs.htm.
The P-value combination methods in OPATs share merits with set-based association tests mentioned in the ‘Introduction’ section and do not require genotypic and phenotypic data in an analysis. This feature accommodates OPATs to a number of genomic applications in P-value combination, including analysis of P-values from different types of molecular markers in an omics study, family- and population-based association studies, different analyses of phenotypes in a phenome-wide association study, SNP-based association tests in a pooled DNA study and different studies or clinical sites in a meta-analysis study.
In addition to practical methods in statistical genetics and genomics, OPATs features the following implementations: a convenient GUI for the parameter and condition settings and analysis execution, a flexible input and analysis of P-value and genotypic data, an interactive Output Viewer to visually represent the results of association tests, a convenient hyperlink function to connect to the NCBI genome browser and KEGG database to display gene and biopathway annotations for the identified genetic markers, an efficient adaptive resampling procedure to calculate empirical P-values [16] and multiple operating environments including Windows and Linux systems.
Future studies will explore several directions. More single-locus tests for the genetic and genomic association analyses of different types of phenotypic data, including ordinal, survival, longitudinal and multivariate data will be added to make OPATs comprehensive and self-contained. Parallel computing and graphics processing unit acceleration will be added to enhance the computational capacity of OPATs. More annotation resources, such as gene ontology and topology, will be incorporated into OPATs to identify more biologically relevant units associated with complex diseases and traits.
Key Points
P-value combination has been proved as a powerful set-based method for identifying disease-associated genomic segments, functional genes and biological pathways.
OPATs provides a general P-value combination procedure combined with adaptive rank or threshold truncation for three types of set-based association test (i.e. WBAT, GBAT and BBAT).
OPATs features a user-friendly interface, flexible input and interactive Output Viewer, convenient connection to the NCBI genome browser and KEGG database, efficient computational procedure and multiple operating environments.
OPATs can be applied to omics studies with different types of experimental designs, molecular markers and phenotypes.
Acknowledgments
This study used data generated by the WTCCC. A complete list of investigators who contributed to data generation is available at www.wtccc.org.uk. The authors sincerely thank anonymous reviewers for their constructive comments, which have led to a significant improvement of our manuscript.
Funding
The Career Development Award of Academia Sinica (AS-100-CDA-M03 to H.C.Y.) and by research grants from the National Science Council of Taiwan (MOST 103-2314-B-001-008-MY3, NSC 100-2314-B-001-005-MY3 to H.C.Y.). The funding for the project that generated the WTCCC-RA data was provided by the Wellcome Trust funding award: 076113.
Chia-Wei Chen is a research assistant in Institute of Statistical Science, Academia Sinica.
Hsin-Chou Yang is an associate research fellow in Institute of Statistical Science, Academia Sinica and also serves as adjunct associate professor in four universities and associate editor and review editor in seven international journals.
References
- 1. Tippett LMC. The Methods of Statistics. London: Williams & Norgate, 1931. [Google Scholar]
- 2. Fisher RA. Statistical Methods for Research Workers, 4th edn.London: Oliver and Boyd, 1932. [Google Scholar]
- 3. Good IJ. On the weighted combination of significance tests. J R Stat Soc Series B Stat Methodol 1955;17:264–5. [Google Scholar]
- 4. Stouffer SA, Suchman EA, DeVinney LC. The American Soldier: Adjustment During Army Life, Vol. 1 Princeton: Princeton University Press, 1949. [Google Scholar]
- 5. Pearson ES. On questions raised by the combination of tests based on discontinuous distributions. Biometrika 1950;37:383–93. [PubMed] [Google Scholar]
- 6. Wilkinson B. A statistical consideration in psychological research. Psychol Bull 1951;48:156–8. [DOI] [PubMed] [Google Scholar]
- 7. Edgington ES. An additive model for combining probability values from independent experiments. J Psychol 1972;80:351–63. [Google Scholar]
- 8. Zaykin DV, Zhivotovsky LA, Westfall PH. Truncated product method for combining P-values. Genet Epidemiol 2002;22:170–85. [DOI] [PubMed] [Google Scholar]
- 9. Neuhäuser M, Bretz F.. Adaptive designs based on the truncated product method. BMC Med Res Methodol 2005;5:30. [DOI] [PMC free article] [PubMed] [Google Scholar]
- 10. Yang HC, Pan CC, Lin CY. PDA: pooled DNA analyzer. BMC Bioinformatics 2006;7:233. [DOI] [PMC free article] [PubMed] [Google Scholar]
- 11. Yang HC, Lin CY, Fann CSJ.. A sliding-window weighted linkage disequilibrium test. Genet Epidemiol 2006;30:531–45. [DOI] [PubMed] [Google Scholar]
- 12. Yang HC, Hsieh HY, Fann CSJ.. Kernel-based association test. Genetics 2008;179:1057–68. [DOI] [PMC free article] [PubMed] [Google Scholar]
- 13. Yang HC, Liang YJ, Chung CM. Genome-wide gene-based association study. BMC Proc 2009;3(Suppl 7):S135. [DOI] [PMC free article] [PubMed] [Google Scholar]
- 14. Yang HC, Chen CW.. Region-based and pathway-based QTL mapping using a P-value combination method. BMC Proc 2011;5:S43. [DOI] [PMC free article] [PubMed] [Google Scholar]
- 15. Dudbridge F, Koeleman BPC.. Rank truncated product of P-values, with application to genomewide association scans. Genet Epidemiol 2003;25:360–6. [DOI] [PubMed] [Google Scholar]
- 16. Yu K, Li Q, Bergen AW. Pathway analysis by adaptive combination of P-values. Genet Epidemiol 2009;33:700–9. [DOI] [PMC free article] [PubMed] [Google Scholar]
- 17. Dudbridge F, Koeleman BPC.. Efficient computation of significance levels for multiple associations in large studies of correlated data, including genomewide association studies. Am J Hum Genet 2004;75:424–35. [DOI] [PMC free article] [PubMed] [Google Scholar]
- 18. Hoh J, Wille A, Ott J.. Trimming, weighting, and grouping SNPs in human case-control association studies. Genome Res 2001;11:2115–19. [DOI] [PMC free article] [PubMed] [Google Scholar]
- 19. Zhang S, Chen HS, Pfeiffer RM.. A combined P-value test for multiple hypothesis testing. J Stat Plan Inference 2013;143:764–70. [Google Scholar]
- 20. Chen HS, Pfeiffer RM, Zhang S.. A powerful method for combining P-values in genomic studies. Genet Epidemiol 2013;37:814–19. [DOI] [PubMed] [Google Scholar]
- 21. Taylor J, Tibshirani R.. A tail strength measure for assessing the overall univariate significance in a dataset. Biostatistics 2006;7:167–81. [DOI] [PubMed] [Google Scholar]
- 22. Jiang B, Zhang X, Zuo Y. A powerful truncated tail strength method for testing multiple null hypotheses in one dataset. J Theor Biol 2011;277:67–73. [DOI] [PubMed] [Google Scholar]
- 23. Hu X, Zhang W, Zhang S. Group-combined P-values with applications to genetic association studies. Bioinformatics 2016;32:2737–43. [DOI] [PMC free article] [PubMed] [Google Scholar]
- 24. Neale BM, Sham PC.. The future of association studies: gene-based analysis and replication. Am J Hum Genet 2004;75:353–62. [DOI] [PMC free article] [PubMed] [Google Scholar]
- 25. Luo L, Peng G, Zhu Y. Genome-wide gene and pathway analysis. Eur J Hum Genet 2010;18:1045–53. [DOI] [PMC free article] [PubMed] [Google Scholar]
- 26. Peng G, Luo L, Siu HC. Gene and pathway-based second-wave analysis of genome-wide association studies. Eur J Hum Genet 2010;18:111–17. [DOI] [PMC free article] [PubMed] [Google Scholar]
- 27. Li S, Williams BL, Cui Y.. A combined P-value approach to infer pathway regulations in eQTL mapping. Stat Interface 2011;4:389–402. [Google Scholar]
- 28. Won SH, Morris N, Lu Q. Choosing an optimal method to combine P-values. Stat Med 2009;28:1537–53. [DOI] [PMC free article] [PubMed] [Google Scholar]
- 29. Brown MB. A method for combining non-independent, one-sided tests of significance. Biometrics 1975;31:987–92. [Google Scholar]
- 30. Kost JT, McDermott MP.. Combining dependent P-values. Stat Probab Lett 2002;60:183–90. [Google Scholar]
- 31. Churchill GA, Doerge RW.. Empirical threshold values for quantitative trait mapping. Genetics 1994;138:963–71. [DOI] [PMC free article] [PubMed] [Google Scholar]
- 32. Doerge RW, Churchill GA.. Permutation tests for multiple loci affecting a quantitative character. Genetics 1996; 142:285–94. [DOI] [PMC free article] [PubMed] [Google Scholar]
- 33. Ge YC, Dudoit S, Speed TP.. Resampling-based multiple testing for microarray data analysis. Test 2003;12:1–77. [Google Scholar]
- 34. Li MX, Yeung JM, Cherny SS. Evaluating the effective numbers of independent tests and significant P-value thresholds in commercial genotyping arrays and public imputation reference datasets. Hum Genet 2012;131:747–56. [DOI] [PMC free article] [PubMed] [Google Scholar]
- 35. Manolio TA, Collins FS, Cox NJ. Finding the missing heritability of complex diseases. Nature 2009;461:747–53. [DOI] [PMC free article] [PubMed] [Google Scholar]
- 36. Zaykin DV, Zhivotovsky LA, Czika W. Combining P-values in large-scale genomics experiments. Pharm Stat 2007;6:217–26. [DOI] [PMC free article] [PubMed] [Google Scholar]
- 37. Hess A, Iyer H.. Fisher's combined P-value for detecting differentially expressed genes using Affymetrix expression arrays. BMC Genomics 2007;8:96. [DOI] [PMC free article] [PubMed] [Google Scholar]
- 38. Marot G, Foulley JL, Mayer CD. Moderated effect size and P-value combinations for microarray meta-analyses. Bioinformatics 2009;25:2692–9. [DOI] [PubMed] [Google Scholar]
- 39. Li J, Tseng GC.. An adaptively weighted statistic for detecting differential gene expression when combining multiple transcriptomic studies. Ann Appl Stat 2011;5:994–1019. [Google Scholar]
- 40. Moulos P, Hatzis P.. Systematic integration of RNA-Seq statistical algorithms for accurate detection of differential gene expression patterns. Nucleic Acids Res 2015;43:e25. [DOI] [PMC free article] [PubMed] [Google Scholar]
- 41. Yang P, Patrick E, Tan SX. Direction pathway analysis of large-scale proteomics data reveals novel features of the insulin action pathway. Bioinformatics 2014;30:808–14. [DOI] [PMC free article] [PubMed] [Google Scholar]
- 42. Lin WY, Lou XY, Gao G. Rare variant association testing by adaptive combination of P-values. PLoS One 2014;9:e85728. [DOI] [PMC free article] [PubMed] [Google Scholar]
- 43. Purcell S, Neale B, Todd-Brown K. PLINK: a tool set for whole-genome association and population-based linkage analyses. Am J Hum Genet 2007;81:559–75. [DOI] [PMC free article] [PubMed] [Google Scholar]
- 44. Mishra A, Macgregor S.. VEGAS2: software for more flexible gene-based testing. Twin Res Hum Genet 2015;18:86–91. [DOI] [PubMed] [Google Scholar]
- 45. Bakshi A, Zhu Z, Vinkhuyzen AA. Fast set-based association analysis using summary data from GWAS identifies novel gene loci for human complex traits. Sci Rep 2016;6:32894. [DOI] [PMC free article] [PubMed] [Google Scholar]
- 46. International HapMap Consortium. The International HapMap Project. Nature 2003;426:789–96. [DOI] [PubMed] [Google Scholar]
- 47. Sudmant PH, Rausch T, Gardner EJ. An integrated map of structural variation in 2,504 human genomes. Nature 2015;526:75–81. [DOI] [PMC free article] [PubMed] [Google Scholar]
- 48. Devlin B, Roeder K.. Genomic control for association studies. Biometrics 1999;55:997–1004. [DOI] [PubMed] [Google Scholar]
- 49. The Wellcome Trust Case Control Consortium. Genome-wide association study of 14,000 cases of seven common diseases and 3,000 shared controls. Nature 2007;447:661–78. [DOI] [PMC free article] [PubMed] [Google Scholar]
- 50. Kanehisa M, Goto S.. KEGG: Kyoto Encyclopedia of Genes and Genomes. Nucleic Acids Res 2000;28:27–30. [DOI] [PMC free article] [PubMed] [Google Scholar]


