Abstract
The objective was to determine the predictive abilities of HCW for loin, ham, and belly quality of 7,684 pigs with carcass weights ranging from 53.2 to 129.6 kg. Carcass composition, subjective loin quality, and ham face color were targeted on all carcasses, whereas in-plant instrumental loin color and belly quality were assessed on 52.0 and 47.5% of carcasses, respectively. Loin chop slice shear force (SSF), cured ham quality, and adipose iodine value (IV) were evaluated on at least 10% of the population. The slope of regression lines and coefficients of determination between HCW and quality traits were computed using PROC REG of SAS and considered significant at P ≤ 0.05. As HCW increased, boneless loins became darker and redder, evidenced by lower L* (β1 = −0.0243, P < 0.001) and greater a* values (β1 = 0.0106, P < 0.001); however, HCW accounted for only ≤0.80% of the variability in loin L* and a* values. Similarly, subjective loin color score (β1 = 0.0024, P < 0.001) increased with increasing carcass weight, but subjective marbling score was not affected by HCW (β1 = −0.0022, P = 0.06). After 20 d of aging, HCW explained only 0.98% of the variability in loin L* values (β1 = −0.0287, P < 0.01). Heavier carcasses had lower SSF values (β1 = −0.1269, P < 0.001) of LM chops, although HCW explained only 4.46% of the variability in SSF. Although heavier carcasses produced loins that exhibited lower ultimate pH values (β1 = −0.0018, P < 0.001), HCW explained only 1.23% of the variability in ultimate loin pH. Interestingly, cook loss decreased (β1 = −0.0521, P < 0.001) as HCW increased, with HCW accounting for 5.60% of the variability in cook loss. Heavier carcasses resulted in darker, redder ham face color (P < 0.001), but HCW accounted for only ≤2.87% of the variability in ham face L* values and 0.47% of the variability in a* values. Heavier carcasses produced thicker and firmer bellies, with HCW accounting for 37.81% of the variability in belly thickness (β1 = 0.0272, P < 0.001), 20.35% of the variability in subjective flop score (β1 = 0.0406, P < 0.001), and 10.35% of the variability in IV (β1 = −0.1263, P < 0.001). Overall, the proportion of variability in loin and ham quality explained by HCW was poor (≤5.60%), suggesting that HCW is a poor predictor of the primal quality of pigs within this weight range. Nonetheless, HCW was a moderate predictor of belly quality traits. The findings of this study suggest that increasing HCW did not compromise loin, ham, or belly quality attributes.
Keywords: heavy pigs, hot carcass weight, market weight, pork quality
INTRODUCTION
Since 1995, the average HCW of U.S. pork carcasses has increased from 82 to 95 kg, representing an increase of more than 0.6 kg/yr (USDA NASS, 2017b). In a trend that was not unforeseen, increasing weights present opportunities to multiple production sectors. Greater birth weights have translated into greater survivability and potential to reach slaughter at full value (Fix et al., 2010), and greater slaughter weights, unsurprisingly, have resulted in increased primal weights (Cisneros et al., 1996). Furthermore, production efficiencies associated with reduced overhead and diluted fixed costs have resulted in greater integrated margins for heavy-weight pigs (Wu et al., 2017). With benefits to producer and packer profitability, the trend for greater live and carcass weights is likely to continue. Using the USDA (USDA NASS, 2017b) value of 0.6 kg/yr, U.S. pork carcasses are predicted to reach an average weight of 104 kg by the year 2030, 111 kg by the year 2040, and more than 118 kg by 2050.
Raising and slaughtering larger, heavier pigs presents a unique set of challenges for processors. In a review of heavy-weight pigs, Wu et al. (2017) noted issues such as the additional rail height, shackle and cooler space, and chilling capacity needed to facilitate heavier carcass being a concern in older plants designed to handle smaller pigs. Given that chilling capacity is not likely to change in many packing plants, the rate of chilling may be compromised for heavier carcasses. Slower chilling has the potential to compromise pH decline, affecting water-holding capacity, color, and tenderness and resulting in reduced loin and ham quality. In contrast, heavy pigs tend to be fatter and produce thicker bellies (Correa et al., 2008). The authors' expectation was that increasing carcass weight would be detrimental to muscle quality but improve fat quality; therefore, the objective of the study was to determine the predictive abilities of HCW for loin, ham, and belly quality parameters.
MATERIALS AND METHODS
Pigs were slaughtered in a federally inspected facility under the supervision of the USDA Food Safety and Inspection Service. Meat purchased from that facility was transported to the University of Illinois Meat Science Laboratory (Urbana, IL) or the USDA Meat Animal Research Center (Clay Center, NE); therefore, Institutional Animal Care and Use Committee approval was not necessary.
Pigs and Experimental Design
Data were collected on 7,684 carcasses at the production facility (n = 7,684, the number of carcasses on which at least 1 observation was recorded; 100% data collection was not achieved for any specific trait, leading to the discrepancy in total number of observations for each quality trait; Table 1) and HCW was recorded on 7,576 pigs. Commercial pigs evaluated in this study are described in detail by Arkfeld et al. (2016b) and represented typical U.S. production practices with differences in sex, marketing group, season (hot vs. cold), and production focus (lean growth vs. meat quality). Pigs from barns A, B, C, and D were slaughtered over a 7-wk period in February and March (cold season). Similarly, in the hot season, pigs from barns E, F, G, and H were marketed over a 7-wk period from July through September. Producers of barns A, C, E, and G had production programs focused on lean growth of pigs, and producers of barns B, D, F, and H had production programs focused on meat quality. Pigs selected for the meat quality focus were pigs that were identified by the packer from proprietary suppliers to provide proprietary genetics that resulted in loins with increased intramuscular fat compared with pigs in the lean growth focus. Loins from pigs in the meat quality focus had 0.95 subjective units more marbling (P < 0.0001), were predicted to be more tender (P = 0.04), and had less purge loss (P = 0.03) than loins from pigs in the lean growth focus group (data not shown in tabular form). Similarly, pigs selected for the lean growth focus were pigs that were identified by the packer from proprietary suppliers to provide proprietary genetics that resulted in larger loins and greater estimates for carcass lean. Carcasses from pigs in the lean growth focus had 5.21 mm greater (P = 0.02) loin depths and 2.54 greater (P < 0.01) carcass lean estimates (data not shown in tabular form). Three groups were marketed from each barn following site-specific protocols. Pigs were selected for each marketing group by producer-designated criteria. The first, second, and third marketing groups from barns A and B were marketed on wk 1, 3, and 5, respectively. On wk 3, 5, and 7, marketing groups 1, 2, and 3, respectively, were marketed from barns C and D. Marketing schedules during the hot season followed the same pattern as the cold season, with barns E and F having their first groups marketed during wk 1 and barns G and H having their first groups marketed during wk 3. This allowed for direct comparison of first marketing groups with second marketing groups and second marketing groups with third marketing groups by removing the uncertainty caused by day of slaughter (Arkfeld et al., 2016b). To assess the effect increasing carcass weights would have on pork quality, 2,800 pigs with carcass weights between the mean HCW for this study (95 kg) and the predicted 2030 carcass weight of 104 kg were evaluated (Fig. 1). Furthermore, 939 pigs with carcass weights between the predicted 2030 and 2040 averages (104 to 111 kg) were evaluated, along with another 185 pigs above the predicted 2040 average HCW (>111 kg).
Table 1.
Population summary statistics of early postmortem and aged loin quality traits
| Variable | No. | Mean | Median | SD | Minimum | Maximum | CV |
|---|---|---|---|---|---|---|---|
| HCW, kg | 7,576 | 94.72 | 95.45 | 9.41 | 53.18 | 129.55 | 9.93 |
| Loin quality | |||||||
| 31-min pH | 774 | 6.55 | 6.57 | 0.2 | 5.68 | 7.07 | 3.08 |
| 1-d pH | 3,990 | 5.69 | 5.66 | 0.15 | 5.37 | 6.79 | 2.56 |
| 1-d NPPC1 subjective quality | |||||||
| Color2 | 7,381 | 3.09 | 3.00 | 0.56 | 1 | 5 | 18.27 |
| Marbling3 | 7,381 | 2.13 | 2.00 | 0.92 | 0.5 | 6 | 43.35 |
| Firmness4 | 7,381 | 2.75 | 3.00 | 0.62 | 1 | 5 | 22.49 |
| 20-d NPPC subjective quality | |||||||
| Color2 | 818 | 3.13 | 3.00 | 0.59 | 2 | 6 | 18.83 |
| Marbling3 | 818 | 1.58 | 1.50 | 0.35 | 1 | 4 | 21.89 |
| Firmness4 | 818 | 2.99 | 3.00 | 0.16 | 2 | 4 | 5.32 |
| 1-d instrumental loin color5 | |||||||
| L* | 3,937 | 52.66 | 52.61 | 2.49 | 44.3 | 62.05 | 4.73 |
| a* | 3,937 | 7.40 | 7.38 | 1.15 | 2.94 | 11.41 | 15.55 |
| b* | 3,937 | 13.64 | 13.66 | 1.04 | 9.92 | 17.63 | 7.61 |
| 20-d instrumental loin color5 | |||||||
| L* | 818 | 58.93 | 59.16 | 2.64 | 48.85 | 66.84 | 4.48 |
| a* | 818 | 10.06 | 10.06 | 1.40 | 4.77 | 15.22 | 13.88 |
| b* | 818 | 17.12 | 17.14 | 1.02 | 13.40 | 21.74 | 5.96 |
| 20-d purge loss, % | 805 | 0.92 | 0.79 | 0.62 | 0.00 | 4.71 | 67.39 |
| 21-d cook loss, % | 818 | 17.28 | 17.40 | 2.01 | 8.40 | 23.15 | 11.64 |
| Slice shear force, kg | 818 | 14.80 | 13.20 | 5.50 | 5.90 | 39.51 | 37.16 |
NPPC = National Pork Producers Council.
1 = pale, pinkish gray to 6 = dark, purplish red (NPPC, 1999).
1 = 1% intramuscular fat to 10 = 10% intramuscular fat (NPPC, 1999).
1 = very soft/very watery to 5 = very firm (NPPC, 1991).
L* measures darkness to lightness (greater L* value indicates a lighter color), a* measures redness (greater a* value indicates a redder color), and b* measures yellowness (greater b* value indicates a more yellow color). Fresh loin color values were the average of 2 readings per sample.
Figure 1.
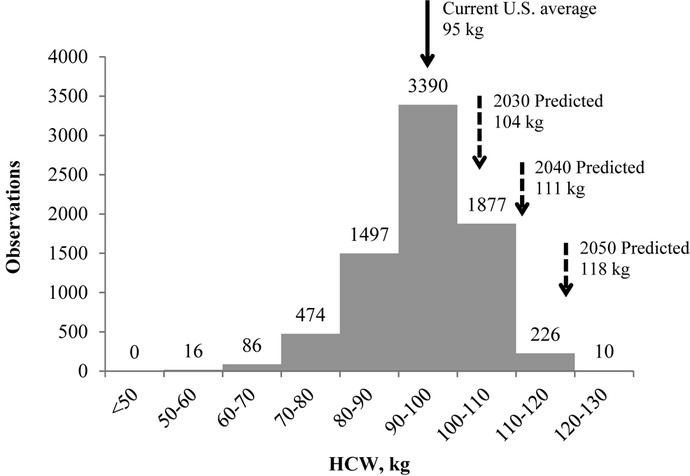
Frequency of observations at carcass weights from 80 to 130 kg including the predicted 2030, 2040, and 2050 average carcass weights based on a 0.6 kg/yr increase (USDA NASS, 2017b).
Abattoir Data Collection
Lairage followed normal operating procedures of the abattoir. Pigs were rendered insensible using CO2 stunning and terminated using exsanguination. Immediately after evisceration, carcasses were assigned a sequential identification number on the shoulder and ham, and each pig's respective lot tattoo was recorded. At approximately 31 min postmortem, loin pH was collected at the 10th rib of every 10th carcass (targeted 10% of the population). These carcasses were noted as the “select” pigs, used for analyses of loin and ham primal quality. Thirty-one minute postmortem pH data were measured with a REED SD-230 pH meter (Reed Instruments, Wilmington, NC) fitted with a PHE-2385 glass combo electrode (Omega Engineering, Inc., Stamford, CT) during the first and second weeks and a FC 200 B series electrode (Hanna Instruments, Woonsocket, RI) for all remaining weeks of the study.
Carcasses were evaluated for HCW, 10th-rib back fat depth, and loin depth using a Fat-O-Meater probe (SFK Technology A/S, Herlev, Denmark), before entering the blast-chiller for approximately 100 min. Carcasses were blast-chilled for approximately 2 h and reached a minimum of −15°C, at which point carcasses were stored at 0°C ambient temperature until fabrication at 22 h postmortem. Longissimus dorsi temperature reached equilibration with the ambient cooler temperature by 14 h postmortem (Arkfeld et al., 2016b). As carcasses exited the chiller, approximately 3.81-cm-diameter adipose tissue cores (consisting of all 3 adipose layers) were collected from the clear plate (adipose tissue located over the scapula and cervical vertebra) near the dorsal midline of the left side of every carcass. Adipose tissue cores from the selected 10% of carcasses were used to measure fatty acid composition using gas chromatography. Fatty acid methyl esters (FAME) were extracted from adipose samples using the American Oil Chemists' Society official method Ce 2-66 (AOCS, 1998), and the resulting FAME were analyzed using the procedures outlined in Arkfeld et al. (2015). Fatty acid methyl esters were normalized such that the area of each peak was represented as the percentage of the total area. Iodine values (IV) were calculated using fatty acid profile data (% FAME of total FAME) with the following American Oil Chemists' Society (1998) equation: [(C16:1) × 0.95 + (C18:1) ×0.86 + (C18:2) × 1.732 + (C18:3) × 2.616 + (C20:1) × 0.785 + (C22:1) × 0.723], where values in parentheses represent g-FAME/100 g total FAME. While carcasses chilled in equilibration bays, the vertebral column of all loins and the teat line of all bellies of odd sequence numbered carcasses were labeled with sequence numbers that matched the ham and shoulder. Approximately 22 h postmortem, carcasses were fabricated into primal pieces; skin-on bellies (North American Meat Processors Association [NAMP] number 408; NAMP, 2007) and whole legs (modified NAMP number 401; NAMP, 2007) were collected and placed into combos for further analyses that same day. Loins were fabricated into boneless Canadian back loins (NAMP number 414; NAMP, 2007). On the ventral side of the boneless loin, fresh muscle color (6-point subjective scale; NPPC, 1999), marbling (10-point subjective scale; NPPC, 1999), and firmness (5- point subjective scale; NPPC, 1991) were evaluated using National Pork Producers Council (NPPC) standards on the loin boning and trimming line at the time of cutting by an industry professional with over 10 yr of pork quality research experience. Color, marbling, and firmness scores were evaluated at a consistent location on the boning and trimming line to allow for a consistent bloom time.
Loins
Of the entire population, 3,937 loins were selected (odd numbered carcasses from above) for further quality analyses. Instrumental color (L*, a*, and b*) of the LM was measured on the ventral side at approximately 25 and 75% the length of the loin using a Hunter Miniscan XE Plus colorimeter (Hunter Associates Laboratory, Inc., Reston, VA) with illuminant D65, 10° observer angle, and 25-mm port. Ultimate (>22 h postmortem) pH was measured during the first week of the cold season using a REED SD-230 pH meter fitted with a PHE-2385 glass combo electrode. For all other weeks, ultimate pH was measured with a HI 98160 Microprocessor Logging pH/ORP Meter (Hanna Instruments).
Of the entire population, 818 loins (every 10th carcass) were vacuum packaged, boxed, and transported to the USDA Meat Animal Research Center, arriving within 58 h of carcass fabrication. Loins were immediately placed on carts in a single layer, ventral side up, and aged 20 d at 1°C. Loins were weighed (tared for vacuum packaging bag) to record initial loin weight. At 20 d postmortem, loins were removed from their packaging and weighed to determine aged weight, and purge loss was calculated as [({initial weight, kg − aged weight, kg}/initial weight, kg) × 100]. The posterior end of each loin (approximately 4 cm) was removed using a straight cut perpendicular to the length of the loin at a point 5 cm posterior to the anterior tip of gluteus accessories. The anterior end of the loin was removed using a second cut made 39.6 cm anterior to the first, leaving a center-cut loin section that was sliced with a Grasselli NSL 400 portion meat slicer (Grasselli S.p.A., Albinea, Italy). This approach maximized the yield of chops, with the greatest proportion of their mass/cross-sectional area made up of LM, and excluded chops with a high proportion of their mass/cross-sectional area made up of other muscles (spinalis dorsi, multifidus dorsi, gluteus medius, and gluteus accessorius). Additionally, this approach standardized anatomical location of chop assignment across loins. Chop number 10 (located approximately 10 cm anterior to the anterior tip of gluteus accessories) was placed on trays and exposed to air (bloomed) for 2 h before evaluating visual color, marbling, firmness score, instrumental color, and pH. The LM from chop number 10 was then denuded, vacuum packaged, and frozen for subsequent ether-extractable intramuscular fat content determination. Chops number 5 and number 6 (corresponding to the 11th rib region of the loin) were used for determination of slice shear force (SSF). Immediately after cutting, fresh (never frozen) chops were weighed to record initial weight. Chops were cooked the following day (21 d postmortem) using a belt grill (Magigrill, model TBG-60; MagiKitch'n Inc., Quakertown, PA) to a desired internal temperature of 71°C. Cooked chops were weighed, and cooking loss was calculated: [({initial weight, g − cooked weight, g}/initial weight, g) × 100]. Slice shear force was measured on 2 chops from each loin using the procedures of Shackelford et al. (2004) and averaged for statistical analyses.
Bellies
Skin-on bellies were weighed and measurements of belly length, depth, and width were recorded on 3,648 bellies (odd-numbered carcasses). Belly depth (thickness) was measured at 25, 50, and 75% of the distance from the anterior toward the posterior end halfway between the dorsal and ventral edge of the belly, and an average belly depth was determined by averaging these 3 depth values. A subjective flop score of 0.5 (soft) through 5.0 (firm) in 0.5-unit increments was assigned to each belly. Subjective flop scores were anchored such that a score of 0.5 was characterized as an approximate flop distance of less than 5 cm, a score of 1 was 5.1 to 10 cm, a score of 2 was 10.1 to 15 cm, a score of 3 was 15.1 to 20 cm, a score of 4 was 20.1 to 25 cm, and a score of 5 was greater than 25 cm. Flop scores were assigned to each belly by trained plant personnel with at least 5 yr of experience evaluating belly firmness.
Hams
Leg primal weight was recorded, and instrumental color (L*, a*, and b*) was measured with a Konica Minolta CR-400 colorimeter (Minolta Camera Company, Osaka, Japan) using illuminant D65, 10° observer angle, and an 8-mm aperture on the gluteus medius and gluteus profundus of the ham face on 7,420 hams in the population.
Select Hams
Fabrication and Quality Characteristics
Select pork legs (targeted 10%) were then transported in combos using a refrigerated (≤4°C) truck to the University of Illinois Meat Science Laboratory, where they were fabricated following procedures of Arkfeld et al. (2016a), as described in Boler et al. (2011). Briefly, a modified NAMP number 401 leg (rectus abdominus attached) was trimmed similar to a NAMP number 402. Hams were then separated into 5 pieces: inside ham (NAMP number 402F), outside ham (NAMP number 402D; NAMP, 2007), knuckle (NAMP number 402H; NAMP, 2007), inner shank portion (gastrocnemius muscle), and lite butt. Instrumental color values (L*, a*, and b*; Konica Minolta CR-400 colorimeter; illuminant D65) and ultimate pH (MPI pH meter; Meat Probes Inc., Topeka, KS; 2-point calibration at pH 4 and 7) were collected on the semimembranosus muscle (blonde spot, medial side of the inside ham).
Cured Ham Color
Each set of inside, outside, and knuckles originating from the same trimmed ham were made into NAMP number 402G 3-piece hams and processed into cured, cooked hams as described by Arkfeld et al. (2016a). A 2.54-cm-thick ham steak was cut, using a deli slicer, approximately 75% of the distance from the factory clipped end of the ham such that no portion of the knuckle was visible in the steak. Instrumental color measures (L*, a*, and b*; Konica Minolta CR-400 colorimeter; illuminant D65) were collected on the fresh cut surface of the processed ham. The ham was visually divided into 4 quadrants by dividing the ham in half both vertically and horizontally, and a color measurement was recorded in each quadrant. Reported values are the average of the 4 measurements.
Statistical Analysis
Potential confounding factors encountered in modern pork processing facilities, such as marketing group, sex, season, and production focus, accounted for less than 7% of the variation in HCW in this population of pigs (Arkfeld et al., 2017). Because of the limited potential for carcass weight to be confounded by these factors, the aforementioned variables were pooled to determine the effects of HCW on quality.
Predictive ability of HCW was calculated for each dependent variable using the regression procedure of SAS (version 9.4; SAS Inst. Inc., Cary, NC). Coefficients of determination (R2) and the slope of each regression line determined to predict trends in quality attributes were considered significantly different from 0 at P ≤ 0.05. Summary statistics were calculated using PROC MEANS of SAS.
RESULTS
Carcasses were representative of commercial pigs in the U.S. pork supply with an 80-kg range in HCW, from 53 to 129 kg. The mean HCW was 94.7 kg, similar to the 2016 national average of 94.9 kg (USDA NASS, 2017b). Evaluated quality parameters also exhibited commercially relevant ranges with a ventral loin ultimate pH range of 5.37 to 6.79, ventral loin NPPC color score range of 1 to 5, gluteus medius L* range of 20.64 to 68.04, and SSF range of 5.90 to 39.51 kg (Tables 1 and 2).
Table 2.
Population summary statistics of belly quality traits and fresh and cured ham quality
| Variable | No. | Mean | Median | SD | Minimum | Maximum | CV |
|---|---|---|---|---|---|---|---|
| HCW, kg | 7,576 | 94.72 | 94.45 | 9.41 | 53.18 | 129.55 | 9.93 |
| Belly quality | |||||||
| Flop score1 | 3,646 | 2.05 | 2.00 | 0.84 | 0.50 | 5.00 | 40.95 |
| Length, cm | 3,648 | 68.15 | 68.13 | 4.24 | 51.88 | 83.13 | 6.23 |
| Width, cm | 3,647 | 35.35 | 35.63 | 2.41 | 26.88 | 43.75 | 6.81 |
| Average depth, cm | 3,648 | 2.49 | 2.50 | 0.41 | 0.83 | 3.96 | 16.59 |
| Fresh ham quality | |||||||
| Gluteus profundus2 | |||||||
| L* | 7,418 | 40.60 | 40.31 | 3.61 | 22.88 | 56.98 | 8.89 |
| a* | 7,418 | 15.79 | 15.50 | 2.18 | 5.90 | 27.96 | 13.79 |
| b* | 7,416 | 3.73 | 3.69 | 1.69 | −4.64 | 14.04 | 45.25 |
| Gluteus medius2 | |||||||
| L* | 7,422 | 45.69 | 45.65 | 3.37 | 20.64 | 68.04 | 7.38 |
| a* | 7,420 | 9.09 | 8.91 | 1.83 | 2.83 | 24.45 | 20.19 |
| b* | 7,420 | 2.35 | 2.23 | 1.58 | −4.23 | 20.15 | 67.48 |
| Cured ham quality | |||||||
| Cured color2 | |||||||
| L* | 823 | 65.97 | 66.08 | 2.72 | 55.93 | 75.53 | 4.13 |
| a* | 823 | 12.22 | 12.26 | 1.29 | 8.13 | 15.89 | 10.58 |
| b* | 823 | 5.54 | 5.61 | 0.67 | 1.18 | 7.30 | 12.04 |
A subjective flop score of 0.5 (soft) through 5.0 (firm) in 0.5-unit increments was assigned to each belly. Subjective flop scores were anchored such that a score of 0.5 was characterized as an approximate flop distance of less than 5 cm, a score of 1 was 5.1 to 10 cm, a score of 2 was 10.1 to 15 cm, a score of 3 was 15.1 to 20 cm, a score of 4 was 20.1 to 25 cm, and a score of 5 was greater than 25 cm.
L* measures darkness to lightness (greater L* value indicates a lighter color), a* measures redness (greater a* value indicates a redder color), and b* measures yellowness (greater b* value indicates a more yellow color). Fresh ham color values were 1 reading per sample. Cured color values were the average of 4 readings per sample.
Hot Carcass Weight and Loin Quality
Carcass weight accounted for only 1.23% of the variability in ultimate pH, even though, statistically, heavier carcasses produced loins with a lower ultimate pH (β1 = −0.0018, P < 0.0001; Fig. 2). Despite the observed decrease in pH, boneless loins were actually darker and redder as the HCW of commercial pigs increased, as evidenced by lower L* (P < 0.0001; Fig. 3A) and greater a* values (P < 0.0001; Fig. 3B). Nonetheless, it is important to recognize that the slope of regression lines between HCW and L* (β1 = −0.0243) or a* values (β1 = 0.0106) demonstrated very little difference from 0. After 20 d of aging, the predictive ability of HCW for ventral loin lightness was unchanged (β1 = −0.0287, P < 0.01), with carcass weight still explaining only 0.98% of the variation in L* values (Fig. 3C), whereas no relationship between HCW and loin redness (a*) was observed (β1 = −0.0045, P = 0.41) after 20 d of aging (Fig. 3D).
Figure 2.
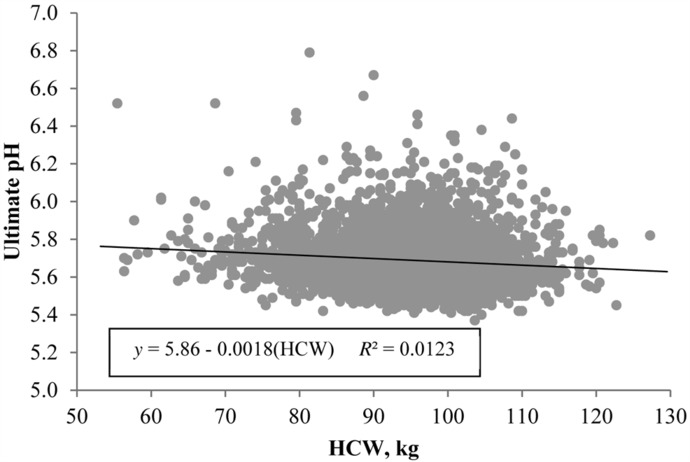
Effect of carcass weight on boneless loin ultimate pH. Data are depicted as the linear regression of the trait using carcass weight as the independent variable. Prediction equations and coefficients of determination included on figures where the slope of linear regression lines were different from 0 (P < 0.05).
Figure 3.
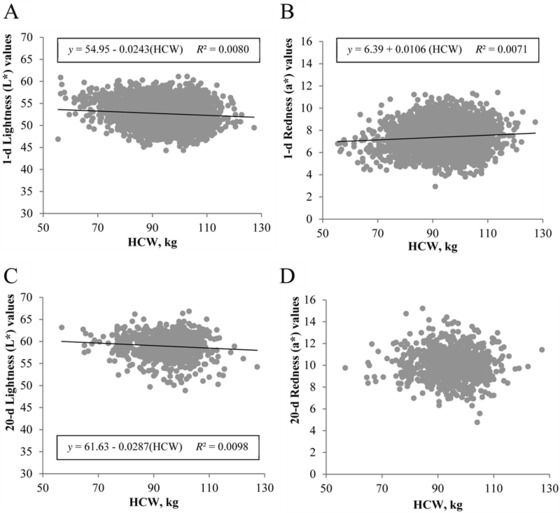
Effect of carcass weight on ventral loin surface color. Traits evaluated include (A) loin lightness (L*) at 1 d postmortem, (B) loin redness (a*) at 1 d postmortem, (C) aged loin lightness (L*) at 20 d postmortem, and (D) aged loin redness (a*) at 20 d postmortem. Data are depicted as the linear regression of the trait using carcass weight as the independent variable. Prediction equations and coefficients of determination are included on figures where the slope of linear regression lines was different from 0 (P < 0.05).
Similar to instrumental color findings, loin subjective color score increased (β1 = 0.0024, P < 0.001; Fig. 4A) with HCW. Heavier carcasses also resulted in firmer loins (β1 = 0.0110, P < 0.0001), with HCW accounting for 2.75% of the variability in subjective firmness scores (Fig. 4C). For this population of pigs, early postmortem (1 d) subjective marbling score was not affected by HCW (β1 = −0.0022, P = 0.06; Fig. 3B); however, after 20 d of aging, heavier carcasses exhibited greater ventral loin surface marbling (β1 = 0.0040, P < 0.01; Fig. 5B). Nonetheless, HCW still explained only 1.09% of the total variability in aged subjective marbling score. The predictive ability of HCW for loin subjective color (P < 0.01) or subjective firmness scores (P = 0.04) persisted through 20 d of aging, although, again, the slope of regression lines between HCW and subjective color (β1 = 0.0072; Fig. 5A) or subjective firmness (β1 = 0.0013; Fig. 5C) demonstrated little difference from 0.
Figure 4.
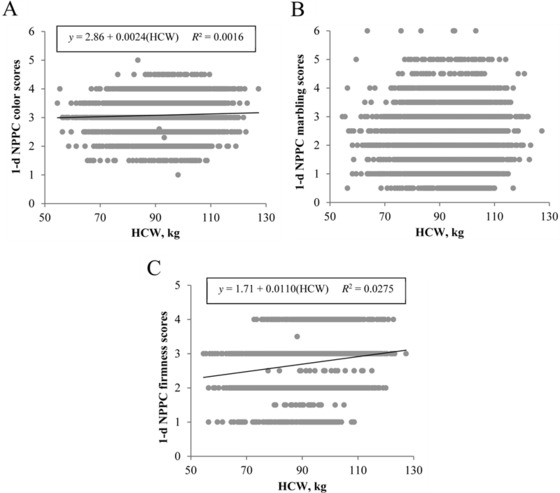
Effect of carcass weight on early postmortem (1 d) subjective loin quality. Traits evaluated include (A) National Pork Producers Council (NPPC) color score, (B) NPPC marbling score, and (C) NPPC firmness score. Data are depicted as the linear regression of the trait using carcass weight as the independent variable. Prediction equations and coefficients of determination are included on figures where the slope of linear regression lines was different from 0 (P < 0.05).
Figure 5.
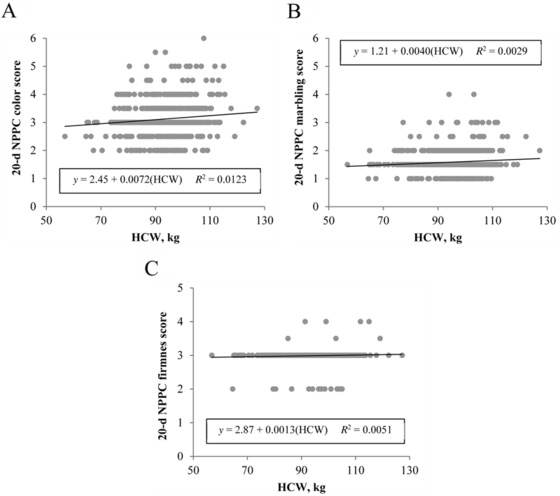
Effect of carcass weight on aged (20 d) subjective loin quality. Traits evaluated include (A) National Pork Producers Council (NPPC) color score, (B) NPPC marbling score, and (C) NPPC firmness score. Data are depicted as the linear regression of the trait using carcass weight as the independent variable. Prediction equations and coefficients of determination are included on figures where the slope of linear regression lines was different from 0 (P < 0.05).
For this population of pigs, heavier carcasses resulted in more tender loin chops, demonstrated by reduced SSF (β1 = −0.1269, P < 0.001; Fig. 6C). Carcass weight also predicted cook loss (β1 = −0.0521, P < 0.001), with heavier carcasses yielding loin chops with less total cook loss. Nevertheless, HCW explained only 4.46% of the variability in SSF values of loin chops and 5.60% of the variability in cook loss percentage (Fig. 6B). No relationship between HCW and purge loss was observed (β1 = −0.0040, P = 0.10; Fig. 6A) in this population of pigs.
Figure 6.
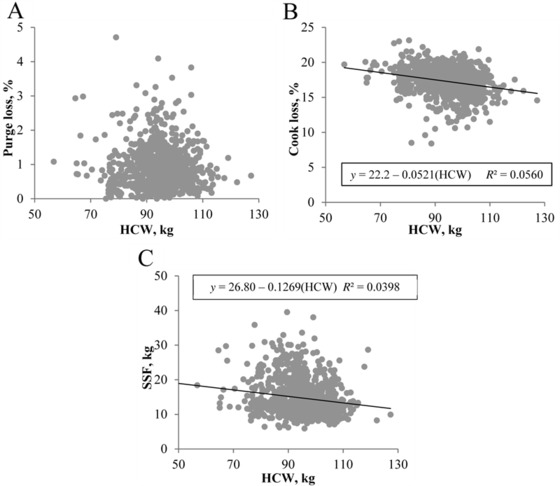
Effect of carcass weight on loin chop water holding capacity and tenderness at 21 d postmortem. Traits evaluated include (A) purge loss, (B) cook loss, and (C) tenderness (slice shear force [SSF]). Data are depicted as the linear regression of the trait using carcass weight as the independent variable. Prediction equations and coefficients of determination are included on figures where the slope of linear regression lines was different from 0 (P < 0.05).
Hot Carcass Weight and Fresh or Cured Ham Quality
Heavier carcasses resulted in darker ham face color, but HCW accounted for only 2.87% of the variability in gluteus profundus L* values (β1 = −0.0650, P < 0.001; Fig. 7A) and 0.47% of the variability in gluteus medius L* values (β1 = −0.0246, P < 0.001; Fig. 7C). Similar findings were observed for ham face redness, with heavier carcasses producing redder ham face color, as evidenced by greater a* values for both the gluteus profundus (β1 = 0.0094, P < 0.01; Fig. 7B) and gluteus medius (β1 = 0.0122, P < 0.001; Fig. 7D). Again, however, HCW accounted for only ≤0.39% of the variability in a* values. In the group of selected hams used for further fabrication and quality characteristics evaluation, heavier carcass produced hams with a redder (greater a* values) semimembranosus muscle (β1 = 0.0317, P < 0.001). However, HCW had no predictive ability for pH or lightness (L*) of the semimembranosus (P ≥ 0.08), and no relationships between HCW and instrumental color of cured ham slices were observed (P ≥ 0.18).
Figure 7.
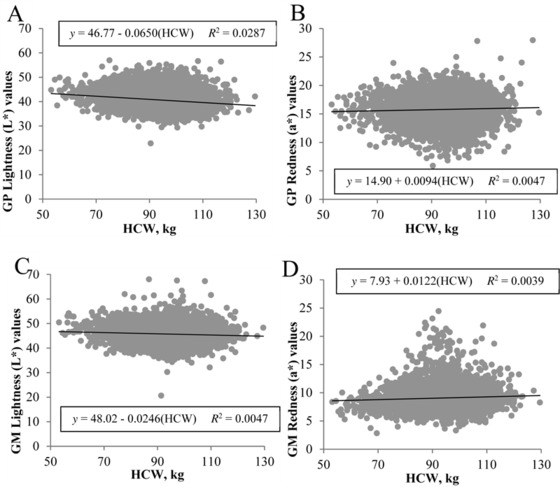
Effect of carcass weight on fresh ham face color at 1 d postmortem. Traits evaluated include (A) gluteus profundus (GP) lightness, (B) GP redness (a*), (C) gluteus medius (GM) lightness (L*), and (D) GM redness (a*). Data are depicted as the linear regression of the trait using carcass weight as the independent variable. Prediction equations and coefficients of determination are included on figures where the slope of linear regression lines was different from 0 (P < 0.05).
Hot Carcass Weight and Belly Quality
Not surprisingly, heavier carcasses produced thicker and firmer bellies, with HCW accounting for 37.81% of the variability in belly thickness (β1 = 0.0272, P < 0.001; Fig. 8A) and 20.35% of the variability in subjective flop score (β1 = 0.0406, P < 0.001; Fig. 8B). Adipose tissue cores taken from the clear plate had a greater degree of saturation as carcass weight increased (β1 = −0.1263, P < 0.001; Fig. 8C), with 10.35% of the variability in adipose tissue IV explained by HCW.
Figure 8.
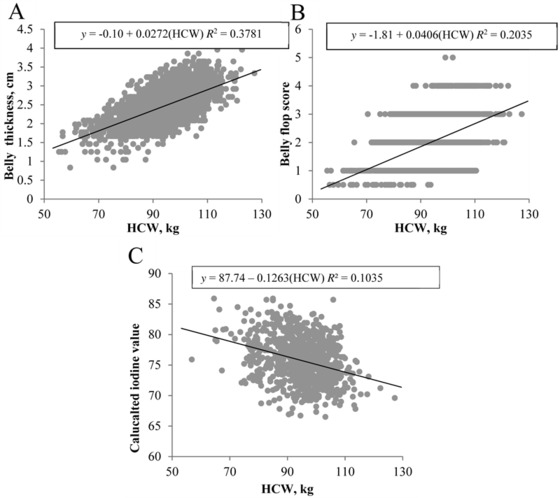
Effect of carcass weight on fresh belly quality. Traits evaluated include (A) belly thickness, (B) subjective flop score, and (C) American Oil Chemists' Society iodine value. Data are depicted as the linear regression of the trait using carcass weight as the independent variable. Prediction equations and coefficients of determination are included on figures where the slope of linear regression lines was different from 0 (P < 0.05).
DISCUSSION
Rapid increases in the growth rate and size of U.S. poultry have resulted in the development of muscle myopathies (woody breast and white striping), and associated meat quality defects have reduced consumer acceptability (Kuttappan et al., 2012). These events raise questions regarding the potential for weight-related pork quality issues. However, the rate of increase in HCW for pigs has not been as great as for poultry. Pork carcass weights have increased nearly 15% since 1995, but the change in growth rate for U.S. poultry, over the same period, is closer to 32% (USDA NASS, 2017a).
Despite the authors' hypothesis that increasing carcass weights would have a negative impact on muscle quality (a result of potential differences in chilling rate and muscle fiber type), increasing HCW statistically improved ventral loin color, firmness, and marbling and loin chop tenderness. Regardless of the negative or positive slope of linear regression lines between carcass weight and quality attributes, it is important to recognize the lack of loin and ham quality effects from a practical standpoint. Coefficients of determination (R2) provide more information regarding the “goodness of fit” of a linear regression line and act as a calculation for the percentage of variation in a dependent variable that can be explained by the independent variable (Taylor, 1990). For this reason, R2 values were discussed to enable more thorough interpretation of the observed relationships. Using this calculation, HCW accounted for less than 6% of the variability in any singular loin or ham quality trait.
Furthermore, although the slopes of calculated regression lines were statistically different than 0, the change in quality attributes over an 80-kg carcass weight range was minimal. Wu et al. (2017) reported an average decrease in L* of 0.25 units/10-kg increase in live market weight. Although carcass weight instead of live market weight was used this study, calculated slope for this population of pigs resulted in a similar decrease in L* of 0.24 units/10-kg increase in carcass weight. When put into the context of visually distinguishable L* differences, changes in L* must typically exceed 2 units to be visually detectable (Zhu and Brewer, 1999). Therefore, over the 80-kg range of carcasses observed in this study, only a 1.9 L* unit change was detected (the approximate equivalent of a one-half NPPC color score change). This makes sense, given that carcass weight accounted for only 0.80% of the variability in L* values. Interestingly, the relationships between pH and loin L* of pork carcasses approaching heavier weights did not follow expected biological patterns, as carcasses with a lower ultimate pH would be expected to produce paler loins (Bidner et al., 2004). However, because HCW accounted for such a small percentage of the total variability in both ultimate pH and L* value in this study, it appears that changes in the relationship between pH and loin L* of heavy-weight pigs are likely attributed to other factors.
Although subjective color scores statistically improved as carcass weight increased, regression line slopes demonstrated little change from 0. This interpretation of these data matches the findings of Correa et al. (2006), who demonstrated that slaughter weight had no effect on subjective color scores (Japanese color standards). In contrast to the findings of this study, Cisneros et al. (1996) found that heavier carcasses exhibited lighter loins but that the slope for subjective color (β1 = −0.006) showed little change from 0. Also, subjective loin quality parameters in the Cisneros et al. (1996) study were evaluated on the loin chop surface of ribbed carcasses with a narrower slaughter weight range of 100 to 160 kg live weight.
Similar to the early postmortem subjective marbling score findings of this study, Cisneros et al. (1996) and Correa et al. (2006) found no change in marbling score with increasing slaughter weight. Furthermore, when evaluating marbling from a muscle composition standpoint, Correa et al. (2006) reported no change in loin chop intramuscular fat content. In this population of pigs, although no relationship between HCW and subjective marbling score was shown at 1 d postmortem, marbling score increased with increasing HCW after 20 d of aging.
In agreement with Wu et al. (2017), 10th-rib fat depth in the current population of carcasses increased by 1.8 mm/10-kg increase in HCW. Previous literature has indicated a weak relationship between 10th-rib fat depth and subjective firmness scores (r = 0.24; Huff-Lonergan et al., 2002), and although, in this study, loin firmness measures did increase slightly with increased HCW, variability in loin firmness accounted for by HCW was only 2.75%. Given the slope of the line in the current study (β = 0.0110), it would take approximately a 90-kg change in HCW to result in a 1-unit increase in subjective firmness score. In contrast, some literature has reported softer loins in heavier carcasses (Cisneros et al., 1996).
A more surprising outcome was the substantial improvement in loin chop tenderness demonstrated by heavier carcasses. The calculated slope of this regression line (β1 = −0.1269) resulted in a larger-than-expected 1.26-kg decrease in SSF/10-kg increase in carcass weight, which is substantially greater than that reported by Wu et al. (2017), who reported an average increase in SSF of 0.06 kg/10-kg increase in market weight. Given the potential for reduced chilling rate in heavy carcasses, water-holding capacity of loins from heavy carcasses appeared to be unaffected or even improved in this study. Both Beattie et al. (1999) and Durkin et al. (2012) observed a reduction in the percent cook loss of LM chops from heavier pigs. Likewise, Wu et al. (2017) reported that heavier pigs exhibited LM chops with less drip loss; however, the average effect of each additional 10 kg of slaughter weight was a 0.1 percentage unit reduction in drip loss.
Relatively few studies have been conducted evaluating the effects of HCW on fresh ham color outside of the few studies specific to the production of Parma hams. Similar to the findings of this study, Bertol et al. (2015) found no relationship between slaughter weight and semimembranosus lightness, whereas redness linearly increased with HCW (β1 = 0.1968). Chizzolini et al. (1996) observed a moderate relationship between semimembranosus L* and HCW (r = −0.21), with heavy carcasses exhibiting darker ham color, but no relationship between HCW and semimembranosus redness was observed (Chizzolini et al., 1996).
Conclusions
Since 1995, the average HCW of pigs slaughtered in the United States has increased nearly 15%. If this rate of increase continues, pork carcasses are predicted to weigh 104 kg by the year 2030, 111 kg by 2040, and 118 kg by 2050. Despite current concerns fueled by meat quality issues in chicken, pork processors should not expect increasing HCW to have detrimental effects on lean quality traits, such as ultimate pH, instrumental or visual color, water-holding capacity, or tenderness. Slope estimates for some of these traits did differ from 0; however, the predicted change would be less than what would have practical impacts on quality traits. On the other hand, fat quality traits will likely improve with increasing carcass weight; therefore, bellies are projected to become thicker and, due to greater SFA composition, firmer.
Footnotes
Funding, wholly or in part, was provided by The National Pork Board.
The USDA is an equal opportunity provider and employer
LITERATURE CITED
- American Oil Chemists' Society (AOCS) 1998. Official methods and recommended practices of the AOCS. 5th ed.AOCS, Champaign, IL. [Google Scholar]
- Arkfeld E. K., Mancini S., Fields B., Dilger A. C., Boler D. D. 2015. Correlation of fresh muscle firmness with sensory characteristics of pork loins destined for a quality focused market. J. Anim. Sci. 93:5059–5072. doi: 10.2527/jas.2015-9316 [DOI] [PubMed] [Google Scholar]
- Arkfeld E. K., Mohrhauser D. A., King D. A., Wheeler T. L., Dilger A. C., Shackelford S. D., Boler D. D. 2017. Characterization of variability in pork carcass composition and primal quality. J. Anim. Sci. 95:697–708. doi: 10.2527/jas.2016.1097 [DOI] [PubMed] [Google Scholar]
- Arkfeld E. K., Wilson K. B., Overholt M. F., Harsh B. N., Lowell J. E., Hogan E. K., Klehm B. J., Bohrer B. M., Kroscher K. A., Peterson B. C., Stites C. R., Mohrhauser D. A., King D. A., Wheeler T. L., Dilger A. C., Shackelford S. D., Boler D. D. 2016a. Effects of marketing group on the quality of fresh and cured hams sourced from a commercial processing facility. J. Anim. Sci. 94:5144–5154. doi: 10.2527/jas.2016-0884 [DOI] [PubMed] [Google Scholar]
- Arkfeld E. K., Wilson K. B., Overholt M. F., Harsh B. N., Lowell J. E., Hogan E. K., Klehm B. J., Bohrer B. M., Mohrhauser D. A., King D. A., Wheeler T. L., Dilger A. C., Boler D. D. 2016b. Pork loin quality is not indicative of fresh belly or fresh and cured ham quality. J. Anim. Sci. 94:5155–5167. doi: 10.2527/jas.2016-0886 [DOI] [PubMed] [Google Scholar]
- Beattie V. E., Weatherup R. N., Moss B. W., Walker N. 1999. The effect of increasing carcass weight of finishing boars and gilts on joint composition and meat quality. Meat Sci. 52:205–211. doi: 10.1016/S0309-1740(98)00169-7 [DOI] [PubMed] [Google Scholar]
- Bertol T. M., Oliveira E. A., Coldebella A., Kawski V. L., Scandolera A. J., Warpechowski M. B. 2015. Meat quality and cut yield of pigs slaughtered over 100 kg live weight. Arq. Bras. Med. Vet. Zootec. 67:1166–1174. doi: 10.1590/1678-4162-8113 [DOI] [Google Scholar]
- Bidner B. S., Ellis M., Brewer M. S., Campion D., Wilson E. R., McKeith F. K. 2004. Effect of ultimate pH on the quality characteristics of pork. J. Muscle Foods 15:139–154. doi: 10.1111/j.1745-4573.2004.tb00717.x [DOI] [Google Scholar]
- Boler D. D., Holmer S. F., Duncan D. A., Carr S. N., Ritter M. J., Stites C. R., Petry D. B., Hinson R. B., Allee G. L., McKeith F. K., Killefer J. 2011. Fresh meat and further processing characteristics of ham muscles from finishing pigs fed ractopamine hydrochloride. J. Anim. Sci. 89:210–220. doi: 10.2527/jas.2010-3041. [DOI] [PubMed] [Google Scholar]
- Chizzolini R., Novelli E., Campanini G., Dazzi G., Madarena G., Zanardi E., Pacchioli M. T., Rossi A. 1996. Lean colour of green and matured Parma hams: Comparative evaluation and technological relevance of sensory and objective data. Meat Sci. 44:159–172. doi: 10.1016/S0309-1740(96)00034-4 [DOI] [PubMed] [Google Scholar]
- Cisneros F., Ellis M., McKeith F. K., McCaw J., Fernando R. L. 1996. Influence of slaughter weight on growth and carcass characteristics, commercial cutting and curing yields, and meat quality of barrows and gilts from two genotypes. J. Anim. Sci. 74:925–933. doi: 10.2527/1996.745925x [DOI] [PubMed] [Google Scholar]
- Correa J. A., Faucitano L., Laforest J. P., Rivest J., Marcoux M., Gariépy C. 2006. Effects of slaughter weight on carcass composition and meat quality in pigs of two different growth rates. Meat Sci. 72:91–99. doi: 10.1016/j.meatsci.2005.06.006 [DOI] [PubMed] [Google Scholar]
- Correa J. A., Gariépy C., Marcoux M., Faucitano L. 2008. Effects of growth rate, sex, and slaughter weight on fat characteristics of pork bellies. Meat Sci. 80:550–554. doi: 10.1016/j.meatsci.2007.12.018 [DOI] [PubMed] [Google Scholar]
- Durkin I., Dadić M., Brkić D., Lukić B., Kušec G., Mikolin M., Jerković I. 2012. Influence of gender and slaughter weight on meat quality traits of heavy pigs. Acta Agric. Slov. 3:211–214. [Google Scholar]
- Fix J. S., Cassady J. P., Holl J. W., Herring W. O., Culbertson M. S., See M. T. 2010. Effect of piglet birth weight on survival and quality of commercial market swine. Livest. Sci. 132:98–106. doi: 10.1016/j.livsci.2010.05.007 [DOI] [Google Scholar]
- Huff-Lonergan E., Baas T. J., Malek M., Dekkers J. C. M., Prusa K., Rothschild M. F. 2002. Correlations among selected pork quality traits. J. Anim. Sci. 80:617–627. doi: 10.2527/2002.803617x [DOI] [PubMed] [Google Scholar]
- Kuttappan V. A., Lee Y. S., Erf G. F., Meullenet J. F. C., McKee S. R., Owens C. M. 2012. Consumer acceptance of visual appearance of broiler breast meat with varying degrees of white striping. Poult. Sci. 91:1240–1247. doi: 10.3382/ps.2011-01947 [DOI] [PubMed] [Google Scholar]
- National Pork Producers Council (NPPC) 1991. Procedures to evaluate market hogs. 3rd ed.NPPC, Des Moines, IA. [Google Scholar]
- National Pork Producers Council (NPPC) 1999. Official color and marbling standards. NPPC, Des Moines, IA. [Google Scholar]
- North American Meat Processors Association (NAMP) 2007. The meat buyer's guide: Beef, lamb, veal, pork, and poultry. John Wiley & Sons, Hoboken, NJ. [Google Scholar]
- Shackelford S. D., Wheeler T. L., Koohmaraie M. 2004. Technical note: Use of belt grill cookery and slice shear force for assessment of pork longissimus tenderness. J. Anim. Sci. 82:238–241. [DOI] [PubMed] [Google Scholar]
- Taylor R. 1990. Interpretation of the correlation coefficient: A basic review. J. Diagn. Med. Sonogr. 6:35–39. doi: 10.1177/875647939000600106 [DOI] [Google Scholar]
- USDA National Agricultural Statistics Service (USDA NASS) 2017a. Chickens, slaughter, fi- slaughtered, measured in lb/head, live basis. https://quickstats.nass.usda.gov/results/710D2366-BDC7-302C-A46B-D9BF2B0EA661?pivot=short_desc. (Accessed 3 April 2017.)
- USDA National Agricultural Statistics Service (USDA NASS) 2017b. Hogs, barrows & gilts, slaughter, commercial, fi- slaughtered, measured in lb/head, dressed basis. https://quickstats.nass.usda.gov/results/E5149588-F4C9-3145-9DC0-8E55F1F42B28. (Accessed 3 March 2017.)
- Wu F., Vierck K. R., DeRouchey J. M., O'Quinn T. G., Tokach M. D., Goodband R. D., Dritz S. S., Woodworth J. C. 2017. A review of heavy weight market pigs: Status of knowledge and future needs assessment. Transl. Anim. Sci. 1:1–15. doi: 10.2527/tas2016.0004 [DOI] [PMC free article] [PubMed] [Google Scholar]
- Zhu L. G., Brewer M. S. 1999. Relationship between instrumental and visual color in a raw, fresh beef and chicken model system. J. Muscle Foods. 10:131–146. doi: 10.1111/j.1745-4573.1999.tb00391.x [DOI] [Google Scholar]


