Abstract.
Mammographic density is an important risk factor for breast cancer. In recent research, percentage density assessed visually using visual analogue scales (VAS) showed stronger risk prediction than existing automated density measures, suggesting readers may recognize relevant image features not yet captured by hand-crafted algorithms. With deep learning, it may be possible to encapsulate this knowledge in an automatic method. We have built convolutional neural networks (CNN) to predict density VAS scores from full-field digital mammograms. The CNNs are trained using whole-image mammograms, each labeled with the average VAS score of two independent readers. Each CNN learns a mapping between mammographic appearance and VAS score so that at test time, they can predict VAS score for an unseen image. Networks were trained using 67,520 mammographic images from 16,968 women and for model selection we used a dataset of 73,128 images. Two case-control sets of contralateral mammograms of screen detected cancers and prior images of women with cancers detected subsequently, matched to controls on age, menopausal status, parity, HRT and BMI, were used for evaluating performance on breast cancer prediction. In the case-control sets, odd ratios of cancer in the highest versus lowest quintile of percentage density were 2.49 (95% CI: 1.59 to 3.96) for screen-detected cancers and 4.16 (2.53 to 6.82) for priors, with matched concordance indices of 0.587 (0.542 to 0.627) and 0.616 (0.578 to 0.655), respectively. There was no significant difference between reader VAS and predicted VAS for the prior test set (likelihood ratio chi square, ). Our fully automated method shows promising results for cancer risk prediction and is comparable with human performance.
Keywords: breast cancer, mammographic density, deep learning, risk, visual analogue scales
1. Introduction
Mammographic density (MD) is one of the most important independent risk factors for breast cancer and can be defined as the relative proportion of radio-dense fibroglandular tissue to radio-lucent fatty tissue in the breast, as visualized in mammograms. Women with dense breasts have a four- to sixfold increased risk of breast cancer compared to women with fatty breasts,1 and breast density has been shown to improve the accuracy of current risk prediction models.2 The reliable identification of women at increased risk of developing breast cancer paves the way for the selective implementation of risk-reducing interventions.3 Additionally, dense tissue may mask cancers, reducing the sensitivity of mammography,4 and breast cancer mortality can be reduced if women at high risk are identified early and treated adequately.5 There is international interest in personalizing breast screening so that women with dense breasts are screened more regularly or with alternative or supplemental modalities.6
A number of methods have been used to measure MD. These include visual area-based methods, for example, BI-RADS breast composition categories,7 Boyd categories,8 percent density recorded on visual analogue scales (VAS),9 and semiautomated thresholding (Cumulus).10 The automated Densitas software11 operates in an area-based fashion on processed (for presentation) full-field digital mammograms (FFDM), while methods including Volpara12 and Quantra13 use raw (for processing) mammograms to estimate volumes of dense fibroglandular and fatty tissue in the breast. Density measures may be expressed in absolute terms (area or volume of dense tissue) or more commonly as a percentage expressing the relative proportion of dense tissue in the breast. Recent studies have investigated the relationship between breast density and the risk of breast cancer and found differences depending on the density method used.14,15
Subjective assessment of percentage density recorded on VAS has a strong relationship with breast cancer risk.16 In a recent case-control study14 with three matched controls for each cancer (366 detected in the contralateral breast at screening on entry to the study and 338 detected subsequently), the odds ratio for screen-detected cancers in the contralateral breast in the highest compared with the lowest quintile of percentage density using VAS was 4.37 (95% CI: 2.72 to 7.03) compared with 2.42 (95% CI: 1.56 to 3.78) and 2.17 (95% CI: 1.41 to 3.33) for Volpara and Densitas percent densities, respectively. Similar results were found for subsequent cancers, with odds ratios of 4.48 (95% CI: 2.79 to 7.18) for VAS, 2.87 (95% CI: 1.77 to 4.64) for Volpara, and 2.34 (95% CI: 1.50 to 3.68) for Densitas. This suggests that expert readers might recognize important features present in the mammographic images of high-risk women which existing automated methods may miss. In part, this may be due to their assessment of patterns of density as well as quantity of dense tissue; there is already evidence in the same case-control setting that explicit quantification of density patterns adds independent information to percent density for risk prediction.17 However, visual assessment of density is time consuming and significant reader variability has been observed.18,19
There have been numerous attempts to automate density assessment using computer vision algorithms20–22 that require hand-crafted descriptive features and prior knowledge of the data. Conversely, deep learning techniques extract and learn relevant features directly from the data, without prior knowledge.23 Convolutional neural networks (CNN) have been successfully used for a wide range of imaging tasks including image classification,24 object detection and semantic segmentation,25 and organ classification in medical images.26 In mammography, deep learning has been used for breast segmentation,27 breast lesion detection,28 breast mass detection,29,30 and breast mass segmentation.30 Various deep learning approaches have been proposed for other breast cancer related tasks such as differentiation between benign and malignant masses31 and discrimination between masses and microcalcifications.32
Deep learning methods for estimating MD have gained increased attention in recent years; however, the number of published studies is low. Petersen et al.33 were among the first to propose unsupervised deep learning, using a multiscale denoising autoencoder to learn an image representation to train a machine learning model to estimate breast density. Following Petersen’s study, Kallenberg et al.34 proposed a variant of the autoencoder that learns a sparse overcomplete representation of the features, achieving an ROC AUC of 0.61 for breast cancer risk prediction. A more recent study employed supervised deep learning to classify breast density into BI-RADS categories and to differentiate between scattered density and heterogeneously dense breasts, showing promising results.35 As VAS has been shown to be a better predictor of cancer than other automated methods, we developed a method of breast density estimation by predicting VAS scores using a supervised deep learning approach that learns features associated with breast cancer. The aim of this study is to create an automated method with the potential to match human performance on breast cancer risk assessment. Our model predicts MD VAS scores with the final goal of assessing breast cancer risk.
2. Data
We used data from the Predicting Risk Of Cancer At Screening (PROCAS) study.36 57,902 women were recruited to PROCAS between October 2009 and March 2015, with FFDM available for 44,505. Density was assessed by expert readers using VAS as described in Sec. 3.1. Data from women who had cancer prior to entering the PROCAS study were excluded from the current study, as were data from those women with additional mammographic views. PROCAS mammograms were in three different formats as shown in Table 1. Due to computational memory limitations, those with format C were excluded. The number of exclusions for all criteria () is shown in Table 2 leaving data from 36,606 women and 145,820 mammographic images for analysis.
Table 1.
Mammographic image formats in PROCAS.
| Format | Dimensions (pixels) | Pixel size () |
|---|---|---|
| A | 94.1 | |
| B | 94.1 | |
| C | 54.0 |
Table 2.
Exclusion table. Some exclusions fall into more than one category.
| Reason for exclusion | Number excluded |
|---|---|
| Additional mammographic views | 2384 |
| Format C mammographic image size | 6513 |
| Previous diagnosis of cancer | 1068 |
| No FFDM | 13,400 |
2.1. Training Data
The training set was built by randomly selecting 50% of the data that met the inclusion and exclusion criteria. Data from all women that were included in the two case control test sets described in Sec. 2.3 were further removed from the training set to ensure no overlap between training and test sets. The training set consisted of 67,520 images from 16,968 women (132 cancers and 16,836 noncancers). A validation set comprising of the training set was used for parameter selection and to avoid overfitting.
2.2. Model Selection Data
The model selection set consisted of data from the remaining 50% of women (73,128 images from 18,360 women, 393 cancers, and 17,967 noncancers) that were not included in the training set. We used all four mammographic views and analyzed data on a per mammogram and per woman basis (see Sec. 3.6). To ensure no overlap between model selection and test sets, all data included in the screen-detected cancers (SDC) and prior test sets were removed from the model selection set. The purpose of this set is to select the best model configuration in terms of VAS score prediction.
2.3. Test Data
We evaluated our method using two datasets: the SDC and prior datasets. The SDC and prior datasets are the same as those used by Astley et al.14 In both test datasets, control/noncancer data were from women who had both a cancer-free (normal) mammogram at entry to PROCAS, and a subsequent cancer-free (normal) mammogram. Cancers were either detected at entry to PROCAS, as interval cancers or at subsequent screens.
2.3.1. Screen-detected cancers dataset
The SDC dataset was a subset of PROCAS with mammographic images from 1646 women (366 cancers and 1098 noncancers). All cancers were detected during screening on entry to PROCAS. MD was assessed in the contralateral breast of women with cancer and in the same breast for the matched controls. Each case was matched to three controls based on age ( months), BMI category (missing, , 25.0 to 29.9, ), hormone replacement therapy (HRT) use (current versus never/ever), and menopausal status (premenopausal, perimenopausal, or postmenopausal).
2.3.2. Prior dataset
The prior dataset consisted of 338 cancers and 1014 controls also from the PROCAS study. All cases in this dataset were cancer-free on entry to PROCAS but diagnosed subsequently. The median time to diagnosis of cancer was 36 months (25th percentile: 32 months, 75th percentile: 39 months). We analyzed the mammographic images of these women on entry to PROCAS, using all four mammographic views. Similarly to the SDC dataset, cases were matched to three controls based on age, BMI category, HRT, menopausal status, and year of mammogram.
3. Method
3.1. Visual Assessment of Density
In the PROCAS study, mammograms had their density assessed by two of nineteen independent readers (radiologists, advanced practitioner radiographers, and breast physicians). The VAS used was a 10-cm line marked at the ends with 0% and 100%. Each reader marked their assessment of breast density on one scale for each mammographic view. Mammograms were assigned to readers on a pragmatic basis. The VAS score for each mammographic image was computed as the average of the two reader scores. The VAS score per woman was averaged across all four mammographic images and across the two readers.
3.2. Deep Learning Model
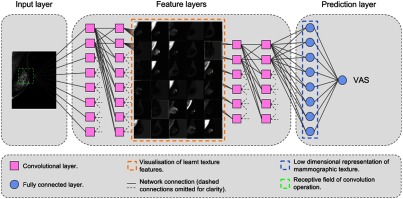
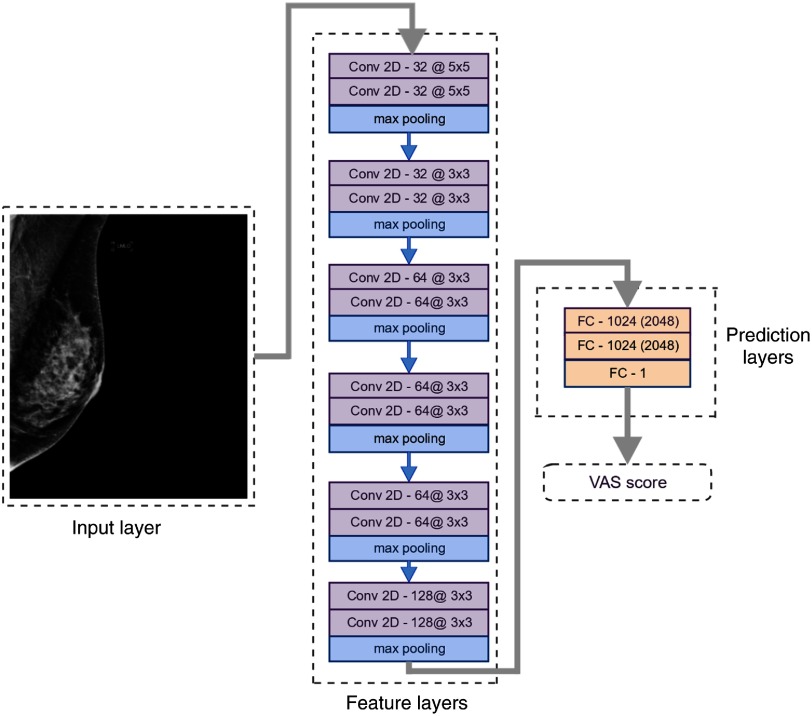
We propose an automated method for assessing breast cancer risk based on whole-image FFDM using reader VAS scores as a measure of breast density. As a first step, we built a deep CNN that takes whole-image mammograms as input and predicts a single number between 0 and 100. This number corresponds to the VAS score (percentage density). One of the main characteristics of CNNs is that features are learned from the training data without human input and are directly optimized for the prediction task. Features (often referred to as filters) are small patches, which are convolved with the input image and create activation maps that show how the input responds to the filters. The values of the features are automatically adjusted to optimize an objective function; in this case, the minimization of the squared difference between predicted and reader VAS scores. Our implementation uses the TensorFlow library.37 Our network consists of six groups of two convolutional layers and a max pooling layer. Our architecture is VGG-like, although there are some differences regarding the depth of the network and the number of feature maps, which were imposed by memory constraints. Figure 1 shows a conceptual representation of the network, the complete architecture is shown in Fig. 2. We use a nonsaturating nonlinear activation function ReLU38 after each convolutional layer and apply batch normalization39 before ReLU.
Fig. 1.
Conceptual diagram of our CNN for predicting VAS score.
Fig. 2.
Network architecture and characteristics of each layer. The number of feature maps and the kernel size of each convolutional layer are shown as: feature maps@kernel size. The fully connected layers are marked with FC followed by the number of neurons in the layer for the low-resolution input and the number of neurons for the high-resolution input in parenthesis.
3.3. Preprocessing
All mammographic images had the same spatial resolution. To have a single mammogram size, we padded format A mammograms with zeros on the bottom and right edges to match the image size of format B mammograms. Right breast mammograms were flipped horizontally before padding. Further, all mammograms were cropped to and downscaled using bicubic interpolation. Images were downscaled due to memory limitations. We used two downscaling factors to produce images of low and high resolution: and , respectively. The upper bound of the pixel values was set to 75% of the pixel value range, to reduce the difference between background and breast pixel intensity. Finally, we inverted the pixel intensities and applied histogram equalization (256 bins).40 All pixel values were normalized in the range 0 to 1 before images were fed into the network. Table 3 shows the two input image formats used for training and their pixel size after down-scaling original images. No data augmentation techniques were applied to our dataset.
Table 3.
Input image format used for training and pixel size after down-scaling original images.
| Format | Dimensions (pixels) | Pixel size () |
|---|---|---|
| Low resolution | 20.12 | |
| High resolution | 40.24 |
3.4. Training
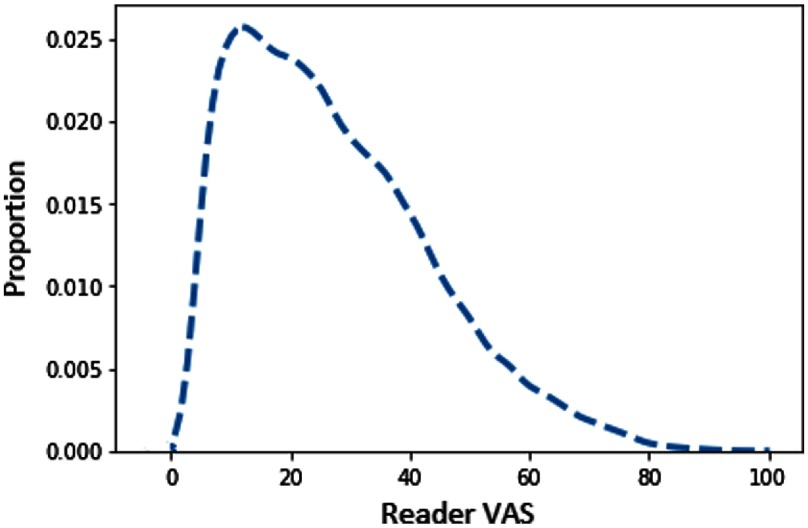
We trained two independent networks, one for cranio-caudal (CC) images and one for medio-lateral oblique (MLO) images, using the architecture shown in Fig. 2. Each network takes preprocessed mammographic images as input and outputs a single value, which represents a VAS score. We trained separate models for the two input size images. The CNN learns a mapping between the input mammographic image and the output VAS score. We used the Adam optimizer41 with different values of initial learning rate: , , , and ; we selected the models that performed best on the validation set. VAS scores do not have a uniform distribution across the population in PROCAS. The distribution is negatively skewed, over half of images have scores below 30% and only a fifth of images have scores above 50% as shown in Fig. 3. Over-exposing our model to low VAS scores could skew the predicted values toward small VAS scores. To avoid this, we built balanced minibatches by oversampling examples with high VAS scores. In the balanced mini-batch, there is one example for each VAS value range of 20: 1 to 20, 21 to 40, etc. To assess the impact of the sampling strategy, we also trained the networks with randomly sampled minibatches.
Fig. 3.
Distribution of VAS scores per image in PROCAS. The distribution is strongly skewed toward smaller values.
We trained the CNNs for 300,000 minibatch iterations. Minibatches consisted of five images. Weights were initialized with values from a normal distribution with 0 mean and standard deviation of 0.1. Biases were initialized with a value of 0.1. For the fully connected layers, we used a dropout rate of 0.5 at training time. As described in Sec. 2.1, 5% of the training data was used as a validation set, which was evaluated every 100 iterations, for early stopping. The best performing models on the validation set were evaluated on the model selection set. We used two cost functions: a mean squared error (MSE) and a weighted MSE. For the standard MSE, we computed loss as
| (1) |
where is the reader VAS and is the predicted VAS score. For the weighted function, each weight is inversely proportional to the inter-reader difference, so that examples where both readers agree, to give a larger contribution to the loss:
| (2) |
where is the reader VAS, is the predicted VAS score, and is the absolute difference between two reader estimates. We have eight different network configurations given by the input image size, sampling strategy, and cost function. Table 4 shows their assigned names which will be used throughout the paper.
Table 4.
Networks configurations. Each configuration is a different combination of input size, cost function, and sampling strategy. The low-resolution configurations have names starting with LR, and the high-resolution with HR. The cost function is reflected in the name as “w” for weighted cost function and “nw” for nonweighted. Finally, the sampling strategy adds “b” or “r” to the name, for balanced and random, respectively.
| Name | Input size (pixels) | Cost function | Mini-batch sampling strategy |
|---|---|---|---|
| LR-w-b | Weighted MSE | Balanced by VAS ranges of 20 | |
| LR-nw-b | MSE | Balanced by VAS ranges of 20 | |
| LR-w-r | Weighted MSE | Random | |
| LR-nw-r | MSE | Random | |
| HR-w-b | Weighted MSE | Balanced by VAS ranges of 20 | |
| HR-nw-b | MSE | Balanced by VAS ranges of 20 | |
| HR-w-r | Weighted MSE | Random | |
| HR-nw-r | MSE | Random |
The low-resolution networks were trained on a Tesla P100 GPU, while the high-resolution networks were trained on 4 Tesla P100 GPUs. Training time was for small resolution images and 6 days for high-resolution images.
3.5. Predicting Density Score
The MLO or CC network predicted a single VAS score for each previously unseen mammogram image. A small proportion of images () produced a negative VAS score and were set to zero. The VAS score for a woman was computed by averaging scores across all mammogram images available (both breasts and both views).
3.6. Model Selection and Testing
Breast cancer risk prediction was assessed by first selecting the CNN architecture that gave the highest accuracy on the model selection set. The predicted VAS scores from this model were used to assess breast cancer risk on both the prior and SDC datasets.
3.6.1. Model selection
VAS scores per image and woman were predicted for low- and high-resolution images for different parameter configurations (Table 4) for the model selection dataset, with the aim of selecting the best performing model. MSE with bootstrap confidence intervals were calculated for each configuration. Additionally, Bland–Altman plots42 were used to evaluate the agreement between reader and predicted VAS scores and to identify any systematic bias in predicted VAS. We computed the reproducibility coefficient (RPC), which quantifies the agreement between reader and predicted VAS. About 95% of predicted VAS scores are expected to be within one RPC from the median after adjusting for systematic bias.
3.6.2. Prediction of breast cancer
To evaluate the selected model’s ability to predict breast cancer, we used the screen detected cancer (SDC) and prior datasets described in Sec. 2.3. For this we used only predicted VAS per woman, which was calculated differently for the two datasets. For prior, scores for all views available were averaged. For the SDC set, only the contralateral side was used for cancer cases; for controls, we used the same side as their matched case.
The relationship between VAS and case-control status was analyzed using conditional logistic regression with density measures modeled as quintiles based on the density distribution of controls. The difference in the likelihood-ratio chi-square between models with reader and predicted VAS scores was compared. The matched concordance (mC) index,43 which provides a statistic similar to the area under the receiving operator characteristic curve (AUC) for matched case-control studies, was calculated with empirical bootstrap confidence intervals43 to compare the discrimination performance of the models. All -values are two-sided.
4. Results
4.1. Model Selection
For all network configurations and for both views, a learning rate of was found to give the lowest MSE on the validation set. Tables 5 and 6 show the MSE per image, per view and per woman obtained with different training strategies for the model selection set. The lowest MSE is obtained for the HR-nw-r configuration (high-resolution input, non-weighted cost function and random mini-batches) per image and HR-nw-b (high-resolution input, non-weighted cost function and balanced mini-batches) per woman. Overall, the high-resolution input configurations outperformed the corresponding low-resolution configurations by a small margin. Training with balanced mini-batches increased the MSE in the majority of cases with the exception of HR-nw-b per woman and HR-w-b both per image and per woman. This may be because balancing mini-batches has the equivalent effect of increasing the weight of under-represented VAS labels in the cost function.
Table 5.
MSE (95% confidence intervals) for the model selection set, for the high-resolution images. Each column represents a different network configuration. The first row shows values obtained for the predictions made per image; the second and third rows show MSE for CC and MLO, respectively; the fourth row shows results averaged per woman.
| HR-nw-r | HR-w-r | HR-nw-b | HR-w-b | |
|---|---|---|---|---|
| Per image | 96.1 (94.8 to 97.3) | 106.5 (105.1 to 107.9) | 99.2 (97.9 to 100.5) | 104.1 (102.8 to 105.2) |
| CC | 94.6 (93.0 to 96.3) | 103.3 (101.4 to 105.2) | 99.0 (97.3 to 100.8) | 103.1 (101.5 to 104.8) |
| MLO | 97.6 (95.8 to 99.5) | 109.8 (107.6 to 111.9) | 99.3 (97.5 to 101.0) | 105.0 (103.1 to 106.9) |
| Per woman | 79.3 (77.2 to 81.3) | 86.2 (84.0 to 88.7) | 77.3 (75.4 to 79.3) | 81.9 (79.8 to 84.1) |
Table 6.
MSE (95% confidence intervals) for the model selection set, for the low-resolution images. Each column represents a different network configuration. The first row shows values obtained for the predictions made per image; the second and third rows show MSE for CC and MLO, respectively; the fourth row shows results averaged per woman.
| LR-nw-r | LR-w-r | LR-nw-b | LR-w-b | |
|---|---|---|---|---|
| Per image | 98.0 (96.7 to 99.2) | 108.4 (107.0 to 109.9) | 104.0 (102.7 to 105.3) | 113.3 (112.0 to 114.8) |
| CC | 100.0 (98.2 to 101.7) | 110.8 (108.8 to 112.8) | 108.0 (106.2 to 109.8) | 116.8 (114.8 to 118.6) |
| MLO | 95.9 (94.1 to 97.7) | 106.1 (104.1 to 108.3) | 99.9 (97.9 to 101.8) | 109.9 (108.0 to 111.7) |
| Per woman | 79.4 (77.3 to 81.4) | 87.2 (84.8 to 89.7) | 82.1 (80.0 to 84.3) | 90.2 (88.0 to 92.4) |
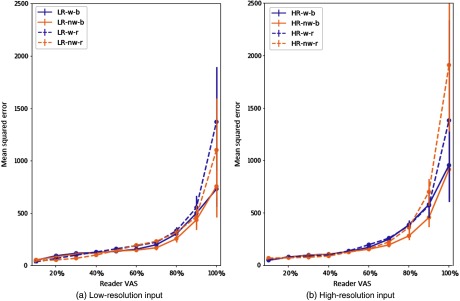
Figures 4(a) and 4(b) show the MSE value per range of 10 values of reader VAS for low- and high-resolution input, respectively. These plots show the impact of different training parameters on prediction error.
Fig. 4.
MSE with 95% CI per image for (a) and (b) low- and high-resolution input. All configurations are displayed with a different line style or color. Configurations with weighted cost function are displayed in purple, and nonweighted in orange. Balanced mini-batches are displayed with a solid line, and random ones with dashed lines. Data were analyzed in divisions of 10% of VAS score. The -axis shows the MSE of the predicted VAS score.
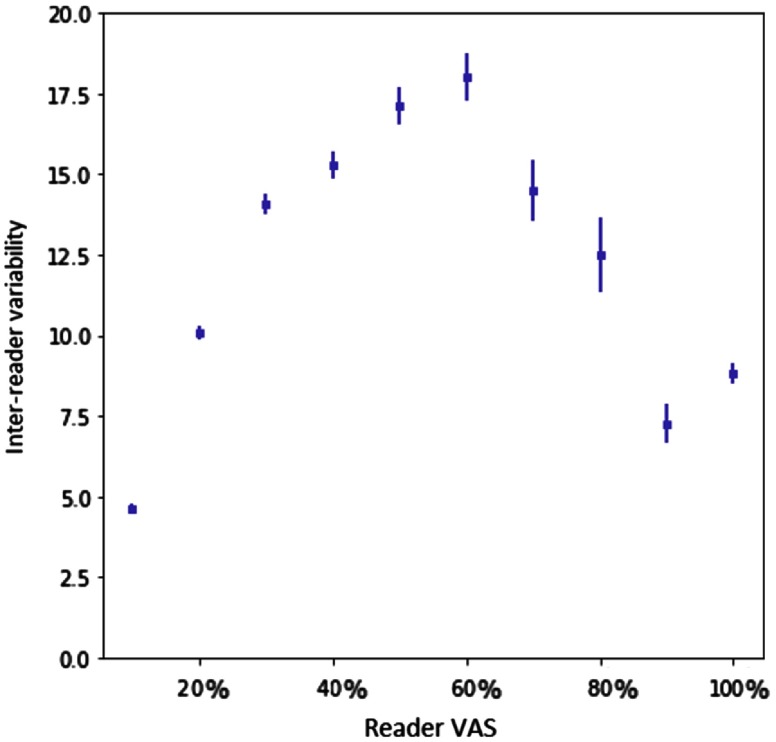
Using balanced mini-batches increased the error in the smaller values of VAS but decreased it for larger VAS values. The weighted cost function improves the error at the ends of the VAS range, where the inter-reader variability is low (shown in Fig. 5). The effects of balancing and weighted cost function are less prominent for the high-resolution images. The reduced performance with balanced mini-batches may have been caused by the impact this weighting had on changing the distribution of VAS labels between training and test data. The weighted cost function also increased the MSE across all models. This cost function reduced the weight of those samples for which there is disagreement between two readers. Figure 5 shows the distribution is heavily skewed toward the middle of the VAS range, thus the weighting of these samples would also change the distribution of VAS labels with respect to the test set. Similar plots for CC performance and MLO performance are shown in Fig. 6. Table 7 shows the mean squared difference between the two readers.
Fig. 5.
Plot of inter-reader variability with 95% CI for ranges of 10 values of reader VAS score. -axis shows the ranges of reader VAS (average of two readers) and -axis shows the average inter-reader variability. Inter-reader variability is computed as the absolute difference between the scores of two readers for each mammographic image.
Fig. 6.
MSE with 95% CI per image for low- and high-resolution input for CC and MLO views. All configurations are displayed with a different line style or color. Configurations with weighted cost function are displayed in purple, and nonweighted in orange. Balanced mini-batches are displayed with a solid line, and random ones with dashed lines. Data were analyzed in divisions of 10% of VAS score. The -axis shows the MSE of the predicted VAS score. (a) and (b) the MSE for low-resolution, (c) and (d) for high-resolution.
Table 7.
Mean squared difference between readers.
| MSE (95% CI) | |
|---|---|
| Per image | 267.5 (264.4 to 270.9) |
| Per woman | 258.7 (252.6 to 264.6) |
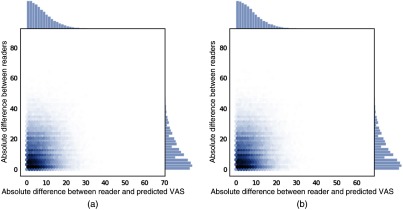
Plots of the inter-reader difference against predicted vs reader difference are shown in Fig. 7.
Fig. 7.
Plot of inter-reader absolute difference versus absolute difference between reader and predicted VAS on the model selection set for two models (a) HR-nw-b and (b) HR-nw-r.
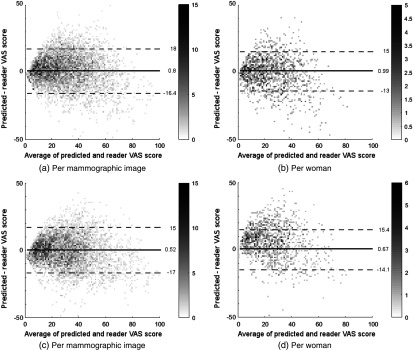
For all configurations, Bland–Altman analysis42 showed good agreement between predicted VAS and reader scores. The RPC for predicted VAS per mammographic image was for high-resolution input and for low-resolution input. When analyzed on a per woman basis, the RPC values were and for high- and low-resolution inputs, respectively. Systematic bias was low across all configurations with values between and 1.5% per image and between and 1.3% per woman. Table 8 shows the Pearson correlation values for the model selection set and the two test sets. Bland–Altman plots of HR-nw-r and HR-nw-b for the model selection set are shown in Fig. 8.
Table 8.
Correlation between predicted and reader VAS per image and per woman. All correlations have .
| Dataset | HR-nw-r | HR-nw-b | |
|---|---|---|---|
| Per image | Model selection set | 0.805 | 0.803 |
| SDC | 0.808 | 0.806 | |
| Prior | 0.812 | 0.812 | |
| Per woman | Model selection set | 0.838 | 0.843 |
| SDC | 0.834 | 0.845 | |
| Prior | 0.846 | 0.851 |
Fig. 8.
Bland–Altman plot of predicted and reader VAS score for the model selection set. The horizontal axis shows the average of reader and predicted VAS scores; the vertical axis shows the difference between predicted and reader VAS scores. Solid line represents median, dashed lines show the 95% confidence limits. The gray level of each point indicates the number of points as shown on the right hand side of each plot. (a) and (b) For Hr-nw-b, (c) and (d) for HR-nw-r.
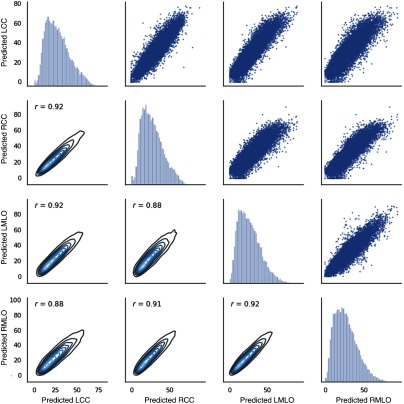
Figure 9 shows the reader scores plotted for all pairs of views. The Pearson correlation coefficient varies between 0.97 and 0.99. Figures 10 and 11 show the predicted scores for all pairs of views obtained with HR-nw-r and HR-nw-b, respectively. The Pearson correlation coefficient varies between 0.86 and 0.92 showing good agreement between scores across all four views.
Fig. 9.
Scatter plot and density plots of reader scores for all pairs of views.
Fig. 10.
Scatter plot and density plots of predicted scores for HR-nw-r, for all pairs of views.
Fig. 11.
Scatter plot and density plots of predicted scores for HR-nw-b, for all pairs of views.
4.2. Prediction of Breast Cancer
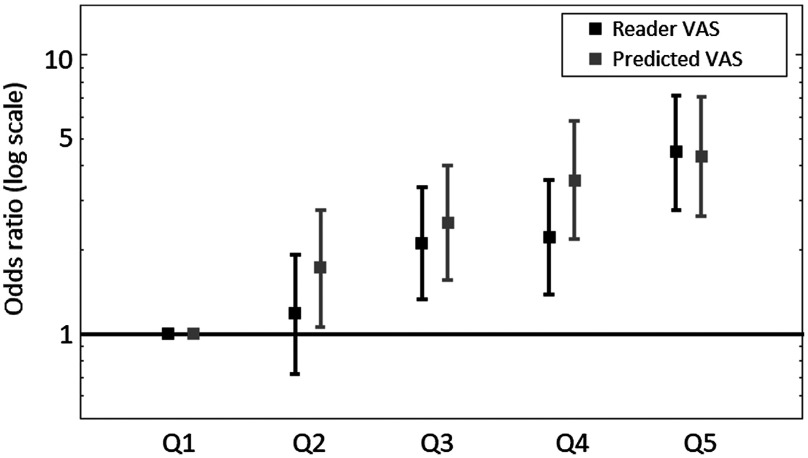
Figure 12 illustrates the odds of developing breast cancer for women in quintiles of predicted VAS score compared with women in the lowest quintile for the prior dataset. Table 9 shows the odds of developing breast cancer for women in the highest quintile of VAS score compared to women in the lowest quintile. Predicted and reader VAS both gave a statistically significant association with breast cancer risk for the SDC and prior datasets. However, the odds ratio associated with reader VAS was higher than that for predicted VAS. For the SDC dataset, the odds ratio for women in the highest quintile compared to women in the lowest quintile of predicted VAS was 2.49 (95% CI: 1.57 to 3.96) for HR-nw-r and 2.40 (95% CI: 1.53 to 3.78) for HR-nw-b. In the prior dataset, the OR for predicted VAS was 4.16 (95% CI: 2.53 to 6.82) for HR-nw-r and 4.06 (95% CI 2.51 to 6.56) for HR-nw-b.
Fig. 12.
Odds of developing breast cancer with 95% CIs for reader and predicted VAS on the prior dataset. Predicted VAS is computed with the HR-nw-r model (high-resolution input, nonweighted cost function, and random mini-batches).
Table 9.
Odds ratio (95% CI) for highest quintile compared with lowest quintile of VAS scores for both case-control datasets.
| Prior (OR, 95% CI) | SDC (OR, 95% CI) | |
|---|---|---|
| Reader VAS | 4.41 (2.76 to 7.06) | 4.63 (2.82 to 7.60) |
| HR-nw-r | 4.16 (2.53 to 6.82) | 2.49 (1.57 to 3.96) |
| HR-nw-b | 4.06 (2.51 to 6.56) | 2.40 (1.53 to 3.78) |
Table 10 shows the matched concordance index obtained for both case-control datasets. The matched concordance index for reader VAS was higher than predicted VAS for both datasets showing better discrimination between cases and controls for reader VAS. Table 11 shows the -values based on the likelihood ratio chi-square comparing the difference between models for each case-control dataset. In the SDC case control study, reader VAS was a significantly better predictor than predicted VAS for both HR-nw-r () and HR-nw-b (). For the prior dataset, there was no significant difference between reader VAS and predicted VAS for HR-nw-r (), but reader VAS was a better predictor than HR-w-b (). There was no significant difference between HR-w-r and HR-w-b on either the prior () or SDC () datasets.
Table 10.
Matched concordance index for predicted and reader VAS for both case-control datasets.
| Prior (95% CI) | SDC (95% CI) | |
|---|---|---|
| Reader VAS | 0.642 (0.602 to 0.678) | 0.645 (0.605 to 0.683) |
| HR-nw-r | 0.616 (0.578 to 0.655) | 0.587 (0.542 to 0.627) |
| HR-nw-b | 0.624 (0.586 to 0.663) | 0.589 (0.551 to 0.628) |
Table 11.
P-values based on likelihood ratio comparing different models.
| Model comparison | Prior (-values) | SDC (-values) |
|---|---|---|
| Reader versus HR-nw-r | ||
| Reader versus HR-w-b | ||
| HR-w-b versus HR-nw-r |
Bland–Altman plots of HR-nw-r and HR-nw-b for the two case control sets are shown in Figs. 13 and 14.
Fig. 13.
Bland–Altman plot of predicted and reader VAS score for the HR-nw-r model. The horizontal axis shows the average of reader and predicted VAS scores; the vertical axis shows the difference between predicted and reader VAS scores. Solid line represents median, dashed lines show the 95% confidence limits. The gray level of each point indicates the number of points as shown on the right hand side of each plot. (a) and (b) For the SDC set; (c) and (d) for the prior set.
Fig. 14.
Bland–Altman plot of predicted and reader VAS score for the HR-nw-b model. The horizontal axis shows the average of reader and predicted VAS scores; the vertical axis shows the difference between predicted and reader VAS scores. Solid line represents median, dashed lines show the 95% confidence limits. The gray level of each point indicates the number of points as shown on the right-hand side of each plot. (a) and (b) For the SDC set; (c) and (d) for the prior set.
5. Discussion
In this paper, we present a fully automated method to predict VAS scores for breast density assessment. Breast density is an important risk factor for breast cancer, although studies vary in their findings regarding which breast density measure is most predictive of cancer. Recent studies have shown that automated methods are capable of matching radiologists’ performance for breast density assessment. Kerlikowske et al.44 compared automatic BI-RADS with clinical BI-RADS and showed they similarly predicted both interval and screen-detected cancer risk, which indicates that either measure may be used for density assessment. A deep learning method proposed by Lehman et al.45 for assessing BI-RADS density in a clinical setting, showed good agreement between the model’s predictions and radiologists’ assessments. Duffy et al.46 investigated the association of different density measures with breast cancer risk using digital breast tomosynthesis and compared automatic and visual measures. All measures showed a positive correlation with cancer risk, but the strongest effect was shown by an absolute density measure. However, Astley et al.14 showed that subjective assessment of breast density was a stronger predictor of breast cancer than other automated and semiautomated methods.
Our method is the first automated method to attempt to reproduce reader VAS scores as an assessment of breast cancer risk, with results showing performance comparable to reader estimates. We used a large dataset with 145,820 mammographic FFDM from 36,606 women and tested our networks on two datasets. We showed that CNNs can predict a VAS score that reflects reader VAS as a first step toward building a model for cancer risk prediction. Results showed a strong agreement between reader VAS and predicted VAS for both low and high-resolution images. Bland–Altman analysis showed similar results for all network configurations and there was no substantial difference in performance between low and high-resolution images. The mean difference (systematic bias) between reader and predicted VAS was small; however, 95% limits of agreement showed considerable variation, which has been found to be a problem in the visual assessment of breast density both within and between readers.18
We investigated our method’s capacity to predict breast cancer in the datasets previously used by Astley et al.14 An important finding is that although there is not complete agreement between predicted and reader VAS, this does not hinder the capacity of our method to predict cancer. Our method performed well both in predicting breast cancer in women with screen detected cancer using the contralateral breast and in predicting the future development of the disease; however, ORs for predicted VAS were lower than those for reader VAS on both case-control datasets.
For predicting the future development of breast cancer, our method suggests a stronger association with breast cancer risk than other automated density methods (Volpara, Quantra and Densitas) as reported by Astley et al. using the same datasets. Matched concordance index analysis revealed that VAS scores predicted using our method are similar to reader VAS in terms of assessing cancer status on the prior set (0.64 for reader VAS, compared to 0.616 and 0.624 for our method with overlapping confidence intervals). On the SDC set, our predicted scores produced slightly lower matched concordance indices (0.587 and 0.589 for our method, and 0.645 for Reader VAS). This might be due to the use of only two predicted VAS scores to compute the average for each woman, rather than four for the prior dataset. However, the ability to identify women at risk before cancer is detected (as in the prior dataset) is more relevant for screening stratification. In this context, our method can identify women at risk similarly to radiologists.
One limitation of our study is that we used mammographic images produced with acquisition systems from a single vendor (GE Senographe Essential mammography system). Future work includes extending the method to work with images produced by different systems. The strengths of this approach include the fact that the method requires no human input and the preprocessing step is minimal. Our method aims to encapsulate expert perception of features that are associated with risk but may not be captured by methods that estimate the quantity of fibroglandular tissue. Predicted VAS is fully automatic, so does not suffer from the limitations of reader assessment such as inter-reader variability18 or variations in ability to identify women at higher risk of developing breast cancer.19 This would make it a pragmatic solution for population-based stratified screening.
Acknowledgments
We would like to thank the study radiologists, breast physicians, and advanced practitioner radiographers for VAS reading. We would also like to thank the many radiographers in the screening programme and the study centre staff for recruitment and data collection. This paper presents independent research funded by NIHR under its Programme Grants for Applied Research programme (reference number RP-PG-0707-10031: “Improvement in risk prediction, early detection and prevention of breast cancer”) with additional funding from the Prevent Breast Cancer Appeal and supported by the NIHR Manchester Biomedical Research Centre Award No. IS-BRC-1215-20007. The views expressed are those of the author(s) and not necessarily those of the NHS, the NIHR, or the Department of Health. We would like to thank the women who agreed to take part in the study, the study radiologists and advanced radiographic practitioners, and the study staff for recruitment and data collection. Preliminary results obtained with the method described in this paper have been published in a previous paper: “Using a convolutional neural network to predict readers’ estimates of mammographic density for breast cancer risk assessment.”47
Biographies
Georgia V. Ionescu is a PhD student in the School of Computer Science at University of Manchester. Her work focuses on developing automated methods for breast cancer risk assessment. She earned a bachelor of software engineering from University “Politehnica” of Timişoara and a master in computer science from the University of Geneva.
Susan M. Astley leads work at the University of Manchester on the development and evaluation of imaging biomarkers (breast density and texture) for breast cancer risk, and the science underpinning stratified screening. Her research encompasses a range of technologies, including computer aided detection, digital breast tomosynthesis, electrical impedance measurement of breast density, and breast parenchymal enhancement in MRI. A mathematician and physicist by training, she previously worked as an astronomer and cosmic ray scientist.
Biographies of the other authors are not available.
Disclosures
Dr. Adam R. Brentnall and Dr. Jack Cuzick receive a royalty from CRUK for licensing TC for commercial use. The PROCAS study was supported by the National Institute for Health Research (NIHR) under its Programme Grants for Applied Research programme (reference number RP-PG-0707-10031: Improvement in risk prediction, early detection and prevention of breast cancer) and Prevent Breast Cancer (references GA09-003 and GA13-006). The views expressed are those of the author(s) and not necessarily those of the NHS, the NIHR, or the Department of Health. Prof. Evans, Dr. Astley, and Dr. Harkness are supported by the NIHR Manchester Biomedical Research Centre. Otherwise no conflicts of interest, financial or otherwise, are declared by the authors. Ethics approval for the PROCAS study was through the North Manchester Research Ethics Committee (09/H1008/81). Informed consent was obtained from all participants on entry to the PROCAS study.
References
- 1.Huo C., et al. , “Mammographic density—a review on the current understanding of its association with breast cancer,” Breast Cancer Res. Treat. 144(3), 479–502 (2014). 10.1007/s10549-014-2901-2 [DOI] [PubMed] [Google Scholar]
- 2.Brentnall A. R., et al. , “Mammographic density adds accuracy to both the Tyrer–Cuzick and Gail breast cancer risk models in a prospective UK screening cohort,” Breast Cancer Res. 17(1), 147 (2015). 10.1186/s13058-015-0653-5 [DOI] [PMC free article] [PubMed] [Google Scholar]
- 3.Cuzick J., et al. , “First results from the International Breast Cancer Intervention Study (IBIS-I): a randomised prevention trial,” Lancet 360(9336), 817–824 (2002). 10.1016/S0140-6736(02)09962-2 [DOI] [PubMed] [Google Scholar]
- 4.Mohamed A. A., et al. , “Understanding clinical mammographic breast density assessment: a deep learning perspective,” J. Digital Imaging 31, 387–392 (2018). 10.1007/s10278-017-0022-2 [DOI] [PMC free article] [PubMed] [Google Scholar]
- 5.Gram I. T., Funkhouser E., Tabár L., “The Tabar classification of mammographic parenchymal patterns,” Eur. J. Radiol. 24(2), 131–136 (1997). 10.1016/S0720-048X(96)01138-2 [DOI] [PubMed] [Google Scholar]
- 6.Weber B., Hayes J., Evans W. P., “Breast density and the importance of supplemental screening,” Curr. Breast Cancer Rep. 10(2), 122–130 (2018). 10.1007/s12609-018-0275-x [DOI] [Google Scholar]
- 7.D’orsi C. J., et al. , Breast Imaging Reporting and Data System: ACR BI-RADS-Mammography, 4th edn., American College of Radiology, Reston, Virginia: (2003). [Google Scholar]
- 8.Boyd N. F., et al. , “Mammographic density and the risk and detection of breast cancer,” N. Engl. J. Med. 356(3), 227–236 (2007). 10.1056/NEJMoa062790 [DOI] [PubMed] [Google Scholar]
- 9.Sergeant J. C., et al. , “Volumetric and area-based breast density measurement in the predicting risk of cancer at screening (PROCAS) study,” Lect. Notes Comput. Sci. 7361, 228–235 (2012). 10.1007/978-3-642-31271-7 [DOI] [Google Scholar]
- 10.Byng J. W., et al. , “The quantitative analysis of mammographic densities,” Phys. Med. Biol. 39(10), 1629–1638 (1994). 10.1088/0031-9155/39/10/008 [DOI] [PubMed] [Google Scholar]
- 11.Abdolell M., et al. , “Methods and systems for determining breast density,” U. S. Patent App. 14/912,965 (2016).
- 12.Highnam R., et al. , “Robust breast composition measurement—VolparaRM,” Lect. Notes Comput. Sci. 6136, 342–349 (2010). 10.1007/978-3-642-13666-5 [DOI] [Google Scholar]
- 13.Pahwa S., et al. , “Evaluation of breast parenchymal density with Quantra software,” Indian J. Radiol. Imaging 25(4), 391 (2015). 10.4103/0971-3026.169458 [DOI] [PMC free article] [PubMed] [Google Scholar]
- 14.Astley S. M., et al. , “A comparison of five methods of measuring mammographic density: a case-control study,” Breast Cancer Res. 20(1), 10 (2018). 10.1186/s13058-018-0932-z [DOI] [PMC free article] [PubMed] [Google Scholar]
- 15.Eng A., et al. , “Digital mammographic density and breast cancer risk: a case-control study of six alternative density assessment methods,” Breast Cancer Res. 16(5), 439 (2014). 10.1186/s13058-014-0439-1 [DOI] [PMC free article] [PubMed] [Google Scholar]
- 16.James J. J., et al. , “Mammographic features of breast cancers at single reading with computer-aided detection and at double reading in a large multicenter prospective trial of computer-aided detection: CADET II,” Radiology 256(2), 379–386 (2010). 10.1148/radiol.10091899 [DOI] [PubMed] [Google Scholar]
- 17.Wang C., et al. , “A novel and fully automated mammographic texture analysis for risk prediction: results from two case-control studies,” Breast Cancer Res. 19(1), 114 (2017). 10.1186/s13058-017-0906-6 [DOI] [PMC free article] [PubMed] [Google Scholar]
- 18.Sergeant J. C., et al. , “Same task, same observers, different values: the problem with visual assessment of breast density,” Proc. SPIE 8673, 86730T (2013). 10.1117/12.2006778 [DOI] [Google Scholar]
- 19.Rayner M., et al. , “Reader performance in visual assessment of breast density using visual analogue scales: are some readers more predictive of breast cancer?” Proc. SPIE 10577, 105770W (2018). 10.1117/12.2293307 [DOI] [Google Scholar]
- 20.Kallenberg M. G., et al. , “Automatic breast density segmentation: an integration of different approaches,” Phys. Med. Biol. 56(9), 2715–2729 (2011). 10.1088/0031-9155/56/9/005 [DOI] [PubMed] [Google Scholar]
- 21.Heine J. J., et al. , “An automated approach for estimation of breast density,” Cancer Epidemiol. Prev. Biomarkers 17(11), 3090–3097 (2008). 10.1158/1055-9965.EPI-08-0170 [DOI] [PMC free article] [PubMed] [Google Scholar]
- 22.Petroudi S., Kadir T., Brady M., “Automatic classification of mammographic parenchymal patterns: a statistical approach,” in Proc. 25th Annual Int. Conf. IEEE Engineering in Medicine and Biology Society, Vol. 1, pp. 798–801 (2003). 10.1109/IEMBS.2003.1279885 [DOI] [Google Scholar]
- 23.Litjens G., et al. , “A survey on deep learning in medical image analysis,” Med. Image Anal. 42, 60–88 (2017). 10.1016/j.media.2017.07.005 [DOI] [PubMed] [Google Scholar]
- 24.Krizhevsky A., Sutskever I., Hinton G. E., “ImageNet classification with deep convolutional neural networks,” in Proc. 25th Int. Conf. Neural Information Processing Systems, Curran Associates, Inc., pp. 1097–1105 (2012). [Google Scholar]
- 25.Girshick R., et al. , “Rich feature hierarchies for accurate object detection and semantic segmentation,” in IEEE Conf. Computer Vision and Pattern Recognition (CVPR) (2014). 10.1109/CVPR.2014.81 [DOI] [Google Scholar]
- 26.Roth H. R., et al. , “Anatomy-specific classification of medical images using deep convolutional nets,” in 12th Int. Symp. on Biomedical Imaging (ISBI), pp. 101–104, IEEE; (2015). [Google Scholar]
- 27.Dubrovina A., et al. , “Computational mammography using deep neural networks,” Comput. Meth. Biomech. Biomed. Eng. 6, 243–247 (2018). 10.1080/21681163.2015.1131197 [DOI] [Google Scholar]
- 28.Dhungel N., Carneiro G., Bradley A. P., “Automated mass detection in mammograms using cascaded deep learning and random forests,” in Int. Conf. Digital Image Computing: Techniques and Applications (DICTA), IEEE, pp. 1–8 (2015). 10.1109/DICTA.2015.7371234 [DOI] [Google Scholar]
- 29.Jamieson A. R., Drukker K., Giger M. L., “Breast image feature learning with adaptive deconvolutional networks,” Proc. SPIE 8315, 831506 (2012). 10.1117/12.910710 [DOI] [Google Scholar]
- 30.Dhungel N., Carneiro G., Bradley A. P., “Deep learning and structured prediction for the segmentation of mass in mammograms,” Lect. Notes Comput. Sci. 9349, 605–612 (2015). 10.1007/978-3-319-24553-9 [DOI] [Google Scholar]
- 31.Cheng J.-Z., et al. , “Computer-aided diagnosis with deep learning architecture: applications to breast lesions in US images and pulmonary nodules in CT scans,” Sci. Rep. 6, 24454 (2016). 10.1038/srep24454 [DOI] [PMC free article] [PubMed] [Google Scholar]
- 32.Wang J., et al. , “Discrimination of breast cancer with microcalcifications on mammography by deep learning,” Sci. Rep. 6, 27327 (2016). 10.1038/srep27327 [DOI] [PMC free article] [PubMed] [Google Scholar]
- 33.Petersen K., et al. , “Breast density scoring with multiscale denoising autoencoders,” in Proc. STMI Workshop at 15th Int. Conf. Medical Image Computing and Computer Assisted Intervention (MICCAI) (2012). [Google Scholar]
- 34.Kallenberg M., et al. , “Unsupervised deep learning applied to breast density segmentation and mammographic risk scoring,” IEEE Trans. Med. Imaging 35(5), 1322–1331 (2016). 10.1109/TMI.2016.2532122 [DOI] [PubMed] [Google Scholar]
- 35.Mohamed A. A., et al. , “A deep learning method for classifying mammographic breast density categories,” Med. Phys. 45(1), 314–321 (2018). 10.1002/mp.2018.45.issue-1 [DOI] [PMC free article] [PubMed] [Google Scholar]
- 36.Evans D. G. R., et al. , “Assessing individual breast cancer risk within the U.K. National Health Service Breast Screening Program: a new paradigm for cancer prevention,” Cancer Prev. Res. 5(7), 943–951 (2012). 10.1158/1940-6207.CAPR-11-0458 [DOI] [PubMed] [Google Scholar]
- 37.Abadi M., et al. , “TensorFlow: large-scale machine learning on heterogeneous systems,” Software available from tensorflow.org (2015).
- 38.Nair V., Hinton G. E., “Rectified linear units improve restricted Boltzmann machines,” in Proc. 27th Int. Conf. Machine Learning (2010). [Google Scholar]
- 39.Ioffe S., Szegedy C., “Batch normalization: accelerating deep network training by reducing internal covariate shift,” in Proc. 32nd Int. Conf. Machine Learning, PMLR, Lille, France, Vol. 37, pp. 448–456 (2015). [Google Scholar]
- 40.Lim J. S., Two-Dimensional Signal and Image Processing, p. 710, Prentice Hall, Englewood Cliffs, New Jersey: (1990). [Google Scholar]
- 41.Kingma D. P., Ba J., “Adam: a method for stochastic optimization,” in Proc. of the 3rd Int. Conf. for Learning Representations (2014). [Google Scholar]
- 42.Altman D. G., Bland J. M., “Measurement in medicine: the analysis of method comparison studies,” The Statistician 32, 307–317 (1983). 10.2307/2987937 [DOI] [Google Scholar]
- 43.Brentnall A. R., et al. , “A concordance index for matched case–control studies with applications in cancer risk,” Stat. Med. 34(3), 396–405 (2015). 10.1002/sim.6335 [DOI] [PubMed] [Google Scholar]
- 44.Kerlikowske K., et al. , “Automated and clinical breast imaging reporting and data system density measures predict risk of screen-detected and interval cancers,” Ann. Intern. Med. 168(11), 757–765 (2018). 10.7326/M17-3008 [DOI] [PMC free article] [PubMed] [Google Scholar]
- 45.Lehman C. D., et al. , “Mammographic breast density assessment using deep learning: clinical implementation,” Radiology 290(1), 180694 (2018). 10.1148/radiol.2018180694 [DOI] [PubMed] [Google Scholar]
- 46.Duffy S. W., et al. , “Mammographic density and breast cancer risk in breast screening assessment cases and women with a family history of breast cancer,” Eur. J. Cancer 88, 48–56 (2018). 10.1016/j.ejca.2017.10.022 [DOI] [PMC free article] [PubMed] [Google Scholar]
- 47.Ionescu G. V., et al. , “Using a convolutional neural network to predict readers’ estimates of mammographic density for breast cancer risk assessment,” Proc. SPIE 10718, 107180D (2018). 10.1117/12.2318464 [DOI] [Google Scholar]


