

Abstract
Belinostat is a second-generation zinc-binding histone deacetylase inhibitor that is approved for peripheral T-cell lymphoma and is currently being studied in small cell lung cancer and other advanced carcinomas as a 48-hour continuous intravenous infusion. Belinostat is predominantly metabolized by UGT1A1, which is polymorphic. Preliminary analyses revealed a difference in belinostat clearance based on UGT1A1 genotype. A 2-compartment population pharmacokinetic (PK) model was developed and validated that incorporated the UGT1A1 genotype, albumin, and creatinine clearance on the clearance parameter; body weight was a significant covariate on volume. Simulated doses of 600 and 400 mg/m2/24 h given to patients considered extensive or impaired metabolizers, respectively, provided equivalent AUCs. This model and subsequent simulations supported additional PK/toxicity and pharmacogenomics/toxicity analyses to suggest a UGT1A1 genotype-based dose adjustment to normalize belinostat exposure and allow for more tolerable therapy. In addition, global protein lysine acetylation was modeled with PK and demonstrated a reversible belinostat exposure/response relationship, consistent with previous reports.
Keywords: clinical pharmacology, oncology, population, pharmacokinetics, pharmacometrics, pharmacogenetics
Belinostat is a second-generation zinc chelating-based histone deacetylase inhibitor (HDI) approved to treat relapsed or refractory peripheral T-cell lymphoma (Beleodaq). It is estimated that HDIs alter approximately 7%–10% of genes associated with cell growth, differentiation, and apoptosis1,2; however, these epigenetic modifiers have a multitude of additional mechanisms that are not fully characterized,3 and it is not certain that gene regulation per se underlies their efficacy.4 The US Food and Drug Administration–approved dose is 1000 mg/m2 as a 30-minute intravenous infusion, which typically produces a range of Cmax and AUC values between 32 000 and 41 000 ng/mL and between 10 000 and 32 000 ng · h/mL, respectively.5,6 Belinostat was shown to be rapidly eliminated, with a half-life ranging from 0.3 to 3.5 hours, a total systemic clearance of 29–110 L/h/m2, and a volume of distribution of 22–150 L/m2.5–8 There is high variability within each of these parameters, and prior to this study, the factors explaining this variability have not been clearly delineated, including the genetics of their metabolism.
Belinostat is predominantly eliminated through metabolism via UGT1A1-mediated glucuronidation.9,10 A well-studied polymorphism in the gene encoding UGT1A1, UGT1A1*28, is characterized by a (TA)7TAA repeat located in the TATA sequence of the promoter and results in decreased expression.11 Consequently, human liver microsomes carrying UGT1A1*28 demonstrate reduced belinostat glucuronidation compared with microsomes expressing the wild-type allele, (TA)6TAA.9 The UGT1A1*28 polymorphism is relatively common, having an allele frequency of 0.36–0.40 that occurs in 26%–31% of whites, 42%–56% of Africans, and 9%–16% of Asians.8,12,13 UGT1A1*60 is another commonly inherited promoter polymorphism that decreases UGT1A1 expression through a single-nucleotide polymorphism of −3279 T>G14 and occurs in 26% of Japanese, 47% of whites, and 85% of Africans.15,16 UGT1A1*6 (211 G>A in exon 1) is also a common polymorphism in Japanese (allele frequency > 80%), but not whites (<5%),17 that, along with *28 and *60, is known to be related to hyperbilirubinemia as well as Gilbert’s syndrome, a deficiency in UGT1A1-mediated bilirubin glucuronidation.16,18,19 A study in human liver microsomes suggested that UGT1A1*28 can reduce belinostat glucuronidation in vitro,9 which justified examining the pharmacogenomic and pharmacokinetic relationships for UGT1A1 and belinostat in this study.
A phase 1 trial was conducted at the National Cancer Institute (NCI) to study the pharmacokinetics, pharmacodynamics, safety, and efficacy of belinostat, given as a 48-hour continuous intravenous infusion (CIVI) along with etoposide and cisplatin. It was hypothesized that a continuous infusion of belinostat would prolong drug exposure and therefore the pharmacological effects, including histone acetylation, which would then permit these effects to overlap with those of the coadministered cytotoxic agents cisplatin and etoposide. Belinostat concentrations over 250 nM were shown to inhibit histone deacetylase (HDAC) enzymes,8 and the doses administered were expected to exceed that threshold. An initial noncompartmental pharmacokinetic analysis revealed parameters that were within previously reported ranges, with high interindividual variability. However, systemic exposure and toxicity appeared to be related to UGT1A1 genotype (including both *28 and *60 genotypes). It is therefore the intention of this report to describe the design and validation of a population pharmacokinetic (PPK) model for the 48-hour CIVI of belinostat and to ultimately adjust the dose based on the ideal genotype stratification involving both UGT1A1*28 and UGT1A1*60 to provide equivalent belinostat exposures. The relationship between the final PPK model and pharmacodynamic (PD) data (fold change in global protein lysine acetylation) was also explored.
Methods
Study Design
This trial (NCT00926640) was conducted at the NCI in Bethesda, Maryland, and was approved for human studies by the NCI Institutional Review Board. Informed consent was obtained from every patient prior to enrollment. Belinostat was administered as a 48-hour CIVI to adult patients with small cell lung carcinoma and other advanced cancers beginning in the evening on day 1, along with 80 mg/m2 cisplatin as a 1-hour intravenous infusion 14 hours into the belinostat CIVI (typically around noon on day 2) and 100 mg/m2 etoposide as a 1-hour intravenous infusion given immediately after the cisplatin, as well as that same time on days 3 and 4. Therapy was repeated every 3 weeks. Belinostat doses began at 400 mg/m2/24 h, and could be deescalated down to 100 mg/m2/24 h or escalated up to 800 mg/m2/24 h. Cisplatin and etoposide blood/plasma concentrations were not measured. Patient demographics are presented in Table 1. The primary objective of this single-center, single-arm, open-label phase 1 dose-escalation trial was to determine the optimal belinostat dose for phase 2 trials in terms of safety and tolerability with regard to the combination with cisplatin and etoposide. This trial was open to adults (≥18 years old) with confirmed cancers for which there is no known standard therapy capable of extending life expectancy who had to be ≥4 weeks removed from cytotoxic chemotherapy, have an Eastern Cooperative Oncology Group performance status of 0–2, and have at least 3 months of life expectancy with acceptable organ function.
Table 1.
Patient Characteristics at Screening (n = 25)
| Parameter | Value |
|---|---|
| Demographic | Median (Range) or n (%) |
| Age (y) | 54.5 (39.8–78.3) |
| Body weight (kg) | 82.4 (50.3–121.5) |
| BSA (m2) | 1.9 (1.2–2.49) |
| Sex (M/F) | 15 (60%)/10 (40%) |
| Ethnicity (white/AA/other) | 21 (84%)/2 (8%)/2 (8%) |
| Laboratory | Median (Range) |
| Albumin (g/dL) | 3.7 (2.1–4.2) |
| Alkaline phosphatase (U/L) | 99 (59–239) |
| Total bilirubin (mg/dL) | 0.3 (0.1–0.6) |
| ALT (U/L) | 28 (8–65) |
| CLCr (mL/min) | 117 (47.9–193.1) |
| Genetic | wt/het/var, n (%) |
| UGT1A1*6a,b | 22 (96%)/0 (0%)/1 (4%) |
| UGT1A1*28 | 11 (44%)/11 (44%)/3 (12%) |
| UGT1A1*60c | 5 (22%)/11 (48%)/7 (30%) |
| UGT1A1 SNP carrierd | 5 (22%)/18 (78%) |
BSA, body surface area; ALT, alanine aminotransferase; CLCr, estimated creatinine clearance; AA, African American; wt, wild-type genotype; het, heterozygous genotype; var, homozygous variant genotype.
Excluded from covariate analysis because only 1 person was variant.
Unable to determine UGT1A1*6 genotype in 2 patients.
Unable to determine UGT1A1*60 genotype in 2 patients.
Wild type in both UGT1A1*28 and UGT1A1*60 or carrier of at least 1 allele of UGT1A1*28 or UGT1A1*60.
Pharmacokinetic Sampling and Sample Bioanalysis
Blood for pharmacokinetic analysis was drawn just before starting the belinostat infusion; 0.5, 1, and 2 hours after the start of belinostat infusion on day 1; immediately prior to (approximately 14 hours post–belinostat start) and following the 1-hour cisplatin CIVI (approximately 15 hours post–belinostat start); immediately prior to (approximately 16 hours post–belinostat start) and following day 1 etoposide CIVI (approximately 17 hours post–belinostat start); immediately prior to (approximately 30 hours post–belinostat start) and following day 2 etoposide CIVI (approximately 31 hours post–belinostat start); at the end of 48 hours of belinostat CIVI and 5, 15, and 30 minutes and 1, 2, 4, 6, 8, and 12 hours after the end of belinostat CIVI. These samples were analyzed for measurement of belinostat plasma concentration using a validated ultra-high-performance liquid chromatography with tandem mass spectrometric detection (LC-MS/MS) assay with a lower limit of quantification (LLOQ) of 5 ng/mL, a dynamic range of 5–1500 ng/mL, and dilution capabilities up to 10 000 ng/mL. Belinostat was extracted from 100 uL of plasma using 1 mL of methyl tert-butyl ether, dried down and resuspended before injection into the LC-MS/MS system. Concentrations below the LLOQ were flagged as below quantifiable limits (BQL), and the Phoenix NLME version of the M3 method (as previously described20–22) was applied to reduce potential estimation bias and improve parameter estimate precision.
Genotyping Analysis
All enrolled patients were genotyped, per protocol, for UGT1A1*6, UGT1A1*28, and UGT1A1*60 polymorphisms. Deviation from Hardy-Weinberg equilibrium was assessed by chi-square statistics. The polymorphisms UGT1A1*6, UGT1A1*28, and UGT1A1*60 were determined from plasma samples using fragment analysis or direct sequencing. Genomic DNA was extracted from blood samples using either the QiAamp Ultrasens Viral DNA or QIAamp DNA Blood kits (Qiagen). Full sequencing methods can be found in the Supplemental Information.
Pharmacokinetic Model Development
A population pharmacokinetic (PPK) model using nonlinear mixed-effects (NLME) modeling was developed and validated using Pharsight Phoenix NLME 1.3 (Certara, Cary, North Carolina). A first-order conditional estimation method with Laplacian estimation algorithm was used to provide maximum likelihood estimates for fixed and random effects. A Windows 7–based computer, with a 2.2 GHz Intel Core i7 processor and 16 GB RAM was used to run the modeling and supporting software.
Development of a multicompartment structural model was initially based on previous PK studies on belinostat 30-minute CIVI either alone5,7 or in combination with other drugs6,23 that demonstrated multiphasic disposition. The between-subject variability (BSV) was described by an exponential function, in which the individual parameter estimate (θi) is the product of the population parameter estimate (θPOP) and the exponentiated BSV estimate for that individual (ηi).
| (1) |
Model Selection Criteria
The objective function value (OFV), calculated by Phoenix NLME 1.3 as minus 2 times the log likelihood (−2×LL), was primarily used for model selection; The Aikaike information criterion (AIC) was used for non-nested model comparisons. Using the likelihood ratio test, a significant (alpha = 05) improvement between nested models requires a delta OFV > 3.84, based on an approximately chi-square distribution. Visual inspection of the model included goodness-of-fit plots, such as observed concentrations (dependent variable, DV), population predicted (PRED) and individual predicted (IPRED) concentrations versus time, DV versus PRED, DV versus IPRED, and conditional weighted residuals (CWRES) versus time or IPRED. Quantile-quantile (QQ) plots for η were assessed for all parameters to check the assumption of eta normal distribution. The η-shrinkage for each parameter was also assessed, and the BSV estimates for parameters with high η-shrinkage (>40%) were used with caution because of insufficient individual observations that shrink the individual estimate toward the population estimate.24 Covariance between parameters was evaluated using a variance-covariance block matrix. Correlation between continuous covariates was assessed using a scatter matrix plot (R v3.1.3), in which a correlation > 0.5 was considered significant. All statistical analyses were performed in Phoenix NLME or R.
Analysis of Covariate Models
Patient sex, age, race, body weight, height, body surface area (BSA), alkaline phosphatase, creatinine clearance (CLCR), bilirubin, albumin, SGOT score, alanine transaminase (ALT), and UGT1A1*28, and *60 genotype status were covariates available for analysis (Table 1). UGT1A1 genotype was divided into 2 categories, extensive metabolizers (EMs) or impaired metabolizers (IMs), and was tested as a categorical covariate for fractional change (θfrc) when patient was IM (IsVar=1; equation 2).
| (2) |
Creatinine clearance and BSA were calculated using Cockcroft-Gault and Dubois and Dubois formulas, respectively, with creatinine clearance values adjusted for standard body size (CLCR×[1.73/BSA]). Continuous covariates were scaled to their median values with an estimable parameter for change (θchng):
| (3) |
Identification of potential covariate effects on parameters was made by visual and statistical relationships between individual post hoc eta (η) estimates for each parameter and covariate values. Inclusion of covariates was initially performed in a stepwise, univariate forward-inclusion approach based on significant reductions in the OFV for that parameter (P < .05). Covariates that significantly improved the base model in a univariate fashion were then added to each other in a multivariate forward-inclusion approach. Once a full model was achieved, a stepwise backward elimination (P < .01) approach was used to identify the final model.
PK Model Evaluation
The ability of the final model to predict the DV was tested by visual predictive checks (VPCs). Parameter estimates and variances were used to simulate data for 23 000 virtual patients (23 patients replicated 1000 times each), and the 5th, 50th, and 95th predicted percentiles were calculated in bins defined by explicit centers at 2, 6, 10, 14, 18, 22, 26, 30, 36, 42,48, 54, 60, and 66 hours, then visually compared with observed data and corresponding distributions. Standard errors and 95% confidence intervals were obtained through a nonparametric bootstrap (n = 1000 replicates). No runs were excluded in the calculation of standard errors and confidence intervals.
PK Model Simulations
Monte Carlo simulations were performed using Pharsight Phoenix NLME 1.3 (Certara Corp, Cary, North Carolina) as follows. Patients from this data set who were wild type for both UGT1A1*28 and UGT1A1*60 or carriers of 1 copy of *28 (n = 5), ultimately referred to as EMs, were given doses of 600 mg/m2/24 h, whereas carriers from this data set of 2 copies of UGT1A1*28 or at least 1 copy of *60 (n = 18), referred to as IMs, were given a dose of 400 mg/m2/24 h. The simulation was replicated 10 times. The resulting model-predicted plasma concentrations in each replicate for each patient over the course of 72 hours were analyzed with noncompartmental methods to calculate the AUCinf with the goal of normalizing mean AUC in IMs given the lower dose with mean AUC in EMs given the higher dose. To confirm the accuracy of the simulations, the suggested dose reduction from the Beleodaq prescribing information of 1000 mg/m2 as a 30-minute CIVI reduced to 750 mg/m2 in patients with UGT1A1*28 was simulated using the aforementioned genotype stratification using this data set.
Pharmacodynamic Model Development
Global protein lysine acetylation (AcK) was assessed by multiparametric flow cytometry (MACSQuant, Miltenyi Biotec, Bergisch Gladbach, Germany) as described previously,25 and flow cytometric data were analyzed using FlowJo (FlowJo LLC, Ashland, Oregon) single-cell analysis software. AcK data were collected for each patient predose, 12 hours after the start of belinostat, 36 hours after the start of belinostat, and 60 hours after the start of belinostat (12 hours after the end of the belinostat infusion). Fold changes in AcK at 12, 36, and 60 hours were normalized per patient based on predose AcK raw values. These fold changes were used to build an indirect response model based on equations below (model II26).
The fixed effects of the final PPK model were fixed, but random effects were allowed to be estimated, during PD model development and validation because of model complexity. A VPC was conducted with 500 replicates, and 200 nonparametric bootstraps were performed to obtain standard errors for the PD parameters. No covariate model was attempted on the PD data, as no covariate appeared to demonstrate an influence on any of the 4 PD parameters (Imax, IC50, kin, and kout). Model-predicted PK and PD output, that is, belinostat plasma concentrations and fold change in AcK, were graphed together to depict an exposure/response relationship.
Results
Data Set
Belinostat plasma concentration-versus-time data were available from 25 patients with full pharmacokinetic data available, encompassing 546 samples. Three of these 25 patients had their belinostat infusion cut short (end of infusion at 36–38 hours) because of the development of treatment-related toxicities. Full demographic data are available in Table 1. Two patients did not have UGT1A1*60 or UGT1A1*6 genotype information available because of PCR failure; 22 of 23 patients with UGT1A1*6 data were wild type. Therefore, UGT1A1*6 was eliminated as a potential covariate in this analysis because of insufficient numbers of patients carrying variant alleles. The 2 patients without *6 or *60 data were ultimately excluded from analysis, bringing the data set to 23 patients encompassing 475 sampling points. Concentration values up to 2 hours after the end of infusion were largely above the LLOQ (5 ng/mL), with only 1 of 22 available samples (4.5%) BQL, as opposed to the samples 4, 6, 8, and 12 hours after the end of infusion having 64%, 90%, 95%, and 95% BQL, respectively. The Phoenix NLME version of the M3 method, which uses a cumulative distribution function to calculate likelihoods for BQL-censored data, was applied to improve precision of parameter estimates and reduce potential bias. The final data set consisted of 399 uncensored samples and 76 censored samples from 23 patients (Figure 1).
Figure 1.
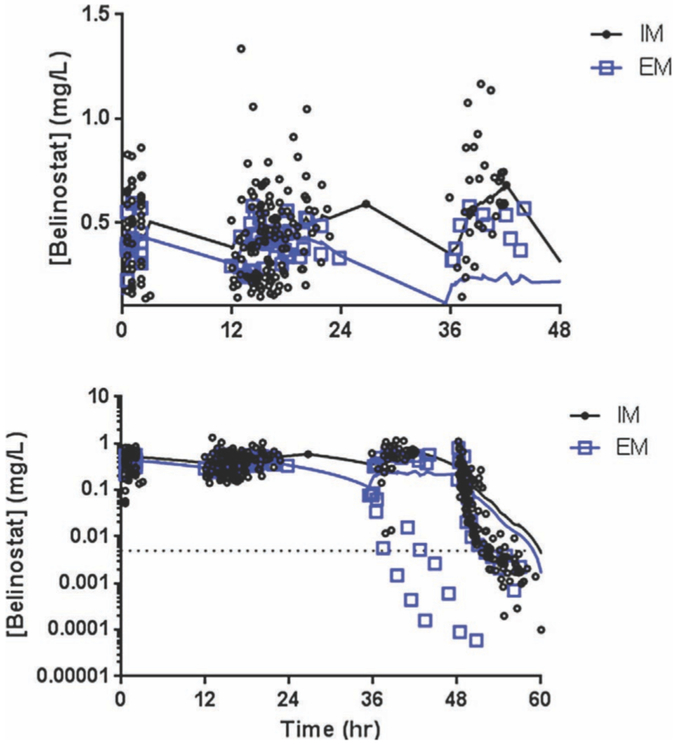
Belinostat plasma concentration versus time profiles. Measured belinostat plasma concentrations (n = 475) from 23 patients included in the final data set. Extensive metabolizers (blue squares) had visibly lower plasma levels during the infusion compared with impaired metabolizers (black circles); top, y-axis cropped at 0.02 mg/L to not count the patients with early infusion termination. Both demonstrated rapid elimination (bottom, log scale). A LOWESS smoothing curve was applied to each group to demonstrate trends in the data.
Base PK Model Development
A 3-compartment structural model did not significantly improve the model (P = .996, df = 4) compared with a 2-compartment structural model. The differential equations below describe the base structural PK model, where Q represents intercompartmental clearance between the central compartment and peripheral compartment, C is the predicted concentration, A is the drug amount, and V is the volume of distribution:
| (4) |
| (5) |
| (6) |
A proportional residual unexplained variability (RUV) model best fit the data, where ε was an estimable parameter for the proportional error with a point estimate and standard error (Table 2).
Table 2.
Final PPKPD Model Parameter Estimates
| Parameter | Point Estimate (%CV) |
Bootstrap Estimate a (%CV) |
Bootstrap 95%CI |
|---|---|---|---|
| CL (L/h) | 104.14 (0.82%) | 106.03 (5.47%) | 97.35–123.5 |
| BSV CL (%) | 32.11b (0.03%) | 30.21 (0.06%) | — |
| VI (L) | 32.24 (1.17%) | 31.82 (10.04%) | 24.07–39.57 |
| BSV VI (%) | 50.45 (0.55%) | 50.45 (0.08%) | — |
| Q (L/h) | 7.09 (1.13%) | 7.84 (23.19%) | 6.61–12.98 |
| BSV (% Q) | 92.53 (0.73%) | 93.59 (0.23%) | — |
| V2 (L) | 8.75 (1.60%) | 8.91 (11.05%) | 7.34–11.67 |
| BSV V2 (%) | 33.35 (0.37%) | 34.14 (0.09%) | — |
| CLCR on CLc | 0.3791 (1.29%) | 0.3799 (10.29%) | 0.2858–0.4613 |
| UGT genotype on CLd | 0.8615 (1.27%) | 0.8475 (5.34%) | 0.7337–0.9062 |
| Albumin on CLe | −0.3743 (1.15%) | −0.3897 (16.66%) | −0.5793 to −0.3520 |
| Body weight on Vf | 0.3965 (0.12%) | 0.3848 (22.48%) | 0.2314–0.4254 |
| Proportional RUV (%CV) | 39.92 (0.81%) | 40.39 (7.49%) | 0.3410–0.4730 |
| IMAX (fold change)g | 0.6179 | 0.6042 (11.52%) | 0.473–0.755 |
| BSV Imax | 24.7 | 25.8 (0.09%) | — |
| IC50 (ng/mL) | 165.7 | 164.3 (14.5%) | 0.101–0.212 |
| BSV IC50 | 31.8 | 34.2 (0.29%) | — |
| KIN (L/h) | 1.836 | 1.762 (17.0%) | 0.641–2.02 |
| BSV Kin | 16.3 | 17.2 (0.06%) | — |
| KOUT (L/h) | 1.54 | 1.46 (16.7%) | 0.562–1.64 |
| BSV Kout | 15.6 | 16.0 (0.05%) | — |
CI, confidence interval; BSV, between-subject variability, expressed as %CV; RSE, relative standard error; RUV, residual or unexplained variability.
Boostrap performed with 1000 replicates.
BSV for CLI in base model was 34.01%; covariate model explained ~4% of BSV in CL1 parameter.
CLCR scaled to median (107 mL/min); point estimate represents exponent (CLi = CLpop *exp[etaCLi]*[CLCR/median]PtEst).
Point estimate incorporated only if binary response is “I“ for presence of variant allele (CLi = CLpop*exp [etaCLi]*[PtEst]^IsVar=I) *calculates the fractional change.
Albumin scaled to median (3.7 g/dL); point estimate represents exponent (CLi = CLpop*exp[etaCLi]*[Alb/3.7]PtEst).
Body weight scaled to median (82.4 kg); point estimate represents exponent (Vi = Vpop*exp[etaVi]*[BW/82.4]PtEst).
Fold change relative to AcH3 values at predose.
| (7) |
The proportional RUV model greatly improved the overall base model compared with the additive (dOFV, −329.79; P = 1.27 × 10−73; using AIC). A mixed RUV model actually worsened the base model compared with proportional RUV alone (dOFV, 24.97) with no improvement in model diagnostics to justify inclusion. Several trends were observed in eta-eta plots; therefore, a variance-covariance block matrix was applied, resulting in significant improvement over a diagonal matrix (dOFV, −15.69; df= 6, P = .015) and decreasing eta shrinkage in V2 and Q from 40.4% and 40.5%, respectively, to 10.9% and 16.9%, respectively. The most significant covariance was between CL and V2 (rho = 0.879) and CL and V (rho = 0.566). BSV for V, CL, V2, and Q was 51.4%, 34%, 33.4%, and 88.4%, respectively.
Covariate Model Development
Several covariates were assessed to determine the impact on structural parameters, including sex, race, age, body weight, body surface area, UGT1A1 genotype, and other laboratory tests (albumin, bilirubin, ALT, AST). Figure 2 depicts apparent trends that were explored for covariate inclusion. Numerous UGT1A1 stratification scenarios involving *28 and *60 were tested as a binary categorical covariate to determine which scenario best improved the model. UGT1A1*28 and *60 genotypes were in Hardy-Weinberg equilibrium (P < .05). The first scenario (scenario 1) considered EMs as patients who carried no variant alleles at either locus (*28 or *60; n = 4) and IMs as patients carrying any of a possible 4 variant alleles (n = 19). This scenario of categorical genotype covariate on the CL parameter only slightly improved the model (dOFV, −2.301; P = .129). A second scenario (scenario 2) considered EMs as patients carrying no variant alleles or 1 copy of a *28 or *60 allele (n = 9); IMs were all others (patients carrying at least 2 variant alleles, n= 14). This scenario hardly improved the model (dOFV, −1.208; P =.272). Scenario 3 considered EMs as carriers of 0–2 copies of variant alleles, regardless of whether it was *28 or *60 (n = 18); IMs were carriers of 3–4 copies of variant alleles (n = 5) but did not significantly improve the model at all (dOFV, −0.329; P = . 566). The ideal scenario (scenario 4) was one in which patients were categorized as being either wild type for both UGT1A1*28 and UGT1A1*60 or having 1 copy of UGT1A1*28 (henceforth, referred to as EMs; n = 5) or a carrier of at least 1 copy of UGT1A1*60 and/or 2 copies of UGT1A1*28 (IMs; n=18). Scenario 4 differed from scenario 1 by a single patient who was wild type for *60 and heterozygous for *28, whose inclusion in scenario 1 as an IM lessened the difference in ηCL distributions between EMs and IMs. When this patient was considered an EM in scenario 4, the difference in ηCL distributions was greater, suggesting a single copy of *28 has no appreciable effect on belinostat CL. This was supported by a separate analysis using noncompartmental PK data that demonstrated UGT1A1*60 has a greater effect on lowering belinostat CL than UGT1A1*28.27 When scenario 4 genotype was factored into the CL parameter as a fractional-change binary categorical covariate, the model was significantly improved (dOFV, −4.89; P = .027).
Figure 2.
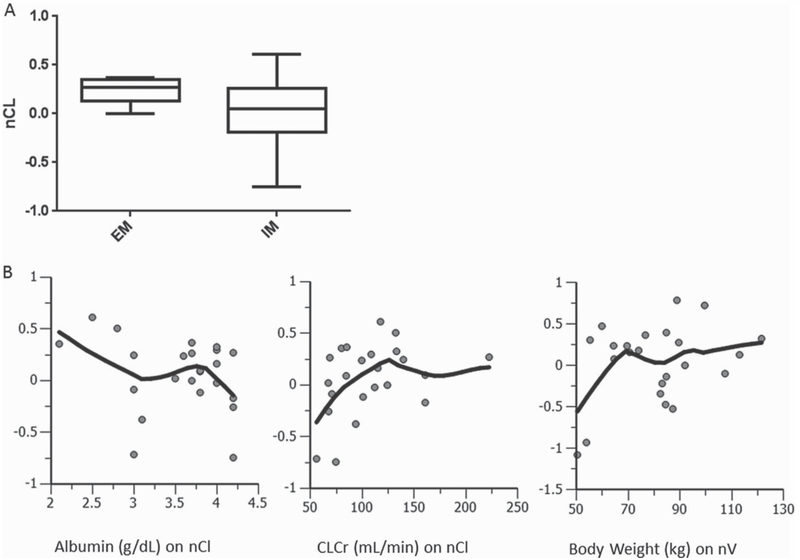
UGT1A1 genotype, albumin, body weight, and creatinine clearance were significant covariates on the CL parameter. (A) Inclusion of the categorical covariate for UGT1A1 genotype status (0 = wild type, I = variant) significantly improved the model and normalized the distribution of individual eta CL (nCL) estimates around zero. (B) Continuous covariate trends in base model (top) and final covariate model (bottom). The y-axis represents the individual eta CL (nCL) estimates.
Several continuous covariates (each scaled to the population medians) were added onto their respective parameter in a univariate manner, and each significantly improved the model: body weight on V (dOFV, −8.74; P = .0031); creatinine clearance on CL (dOFV, −7.387; P = .00657); albumin on CL (dOFV, −5.09; P = .0241). Using a stepwise forward inclusion/backward elimination approach, a full covariate model was arrived at, whereupon UGT1A1 genotype status, creatinine clearance, and albumin were all factored into the CL parameter and body weight on volume. Removal of genotype, CLCr, albumin, and body weight significantly worsened the model by P = .0055, P = .0042, P = .0026, and P = .0089, respectively, justifying their inclusion in the final model. As body weight and CLCr are commonly correlated with each other, this relationship was assessed, but the correlation was deemed nonsignificant (r2 < 0.002), as was correlations among any other significant covariate. The final model was significantly improved from the base model (dOFV, −17.079; df = 4; P = .0018), with covariates explaining roughly 1% of volume BSV and 4% of CL BSV.
Model Evaluation
Goodness-of-fit plots of the final PPK model demonstrated no misspecification or trends (Figure 3A,B). A visual predictive check (Figure 3C) demonstrated that the model can reliably predict the 5th, 50th, and 95th percentiles of observed data. The final PPK model had negligible epsilon shrinkage (0), an acceptable condition number (88867), and η shrinkage values for CL, V1, Q, and V2 of 14.9%, 10.8%, 22.7%, and 20.2%, respectively. Standard errors and 95% confidence intervals of all fixed and random (BSV) parameter estimates were calculated from nonparametric bootstrap estimates (n = 1000 replicates) and indicated precise parameter estimates (Table 2).
Figure 3.
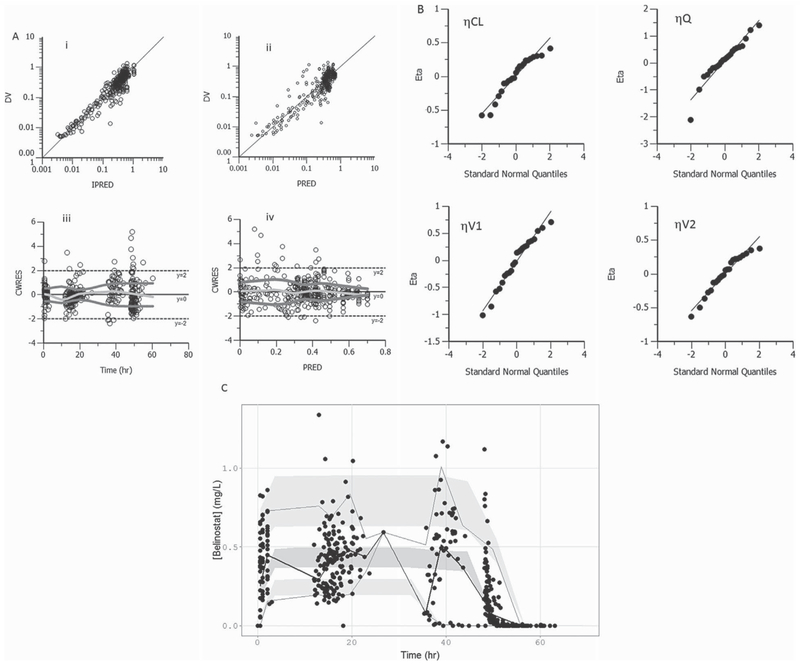
Model diagnostics. (A) Plots of the dependent variable (DV; observed plasma concentrations) versus individual predicted concentration (IPRED; mg/L; i), versus population predicted concentrations (PRED; mg/L; ii), CWRES versus time (iii), and CWRES versus PRED (iv) showed no model misspecification. In (iii) and (iv), a 20-point LOWESS regression to characterize trends in the conditional weighted residuals with respect to time and predicted concentrations was used. (B) Quantile-quantile plots of the eta estimates were normally distributed. (C) Visual predictive check was performed on the final PPK model, and the predicted 5th, 50th, and 95th percentiles (shaded with 95% confidence intervals) accurately predicted the observed 5th (dashed), 50th (solid), and 95th (dashed) percentiles.
Model Simulations
The final PPK model was used to simulate the optimal dosage based on genotype status (EMs vs IMs) to provide equivalent AUCs using the patients from this data set. The desire to normalize belinostat exposures between EMs and IMs is based on a greater incidence of thrombocytopenia in carriers of variant alleles of UGT1A1 (*28 [P = .038] or *60 [P = .0041]; Jonckheere-Terpstra trend test), which was likely due to greater belinostat exposure (P = .0037; Jonckheere-Terpstra trend test for *60 carriers) from lower CLT (P = .020; Jonckheere-Terpstra trend test for *60 carriers).27 To ensure accurate Monte Carlo simulations using the final PPK model, the simulation model was first validated based on the suggested 25% dose reduction outlined in the Beleodaq prescribing information8: 1000 mg/m2 as a 30-minute CIVI for patients wild type for UGT1A1*28 and UGT1A1*60 or 1 copy of UGT1A1*28; 750 mg/m2 (30-minute CIVI) for patients with at least 1 copy of UGT1A1*60 or 2 copies of UGT1A1*28. The simulated CL for each genotype group looked similar to observed data with comparable AUCs (not shown). This provided confidence in the simulation model to accurately predict AUCs through a dose adjustment. When the simulations were formatted for the 48-hour CIVI, the optimal doses found were 600 mg/m2/24 h for EMs and 400 mg/m2/24 h for IMs within this data set, a 33% dose reduction for IMs (Figure 4).
Figure 4.
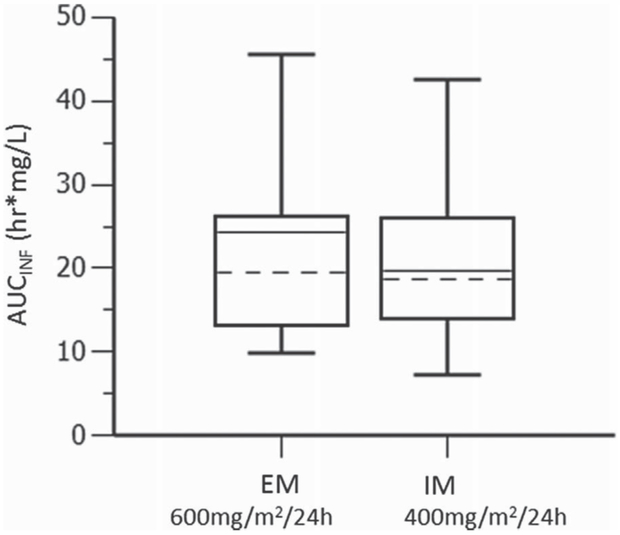
Simulations for optimal belinostat doses to predict equivalent exposures. Simulated AUCinf from EM given 600 mg/m2/24 h versus IM given 400 mg/mg2/24 h from a single 48-hour intravenous infusion.
PD Model Development
The inhibition of HDAC enzymes, as measured by global protein lysine acetylation, was added onto the final PPK model, where the best fit came from an indirect response model. A proportional RUV model best described the data. No covariates significantly improved the PD model. The exposure–response relationship between predicted belinostat plasma concentrations (PK) and the predicted fold change in AcK over time (PD) is depicted in Figure 5. As PK levels rise, PD levels rise with little to no lag time (although, the first PD time was 12 hours, so this is difficult to assess). At the end of infusion (48 hours), there is a sharp drop in both PK and PD levels, suggesting a highly reversible inhibition of HDAC, consistent with preclinical data28 and justifying the need for a prolonged infusion and exposure to the drug.
Figure 5.

Model-predicted exposure–response relationship between belinostat plasma concentrations and fold change in global protein lysine acetylation. Global protein lysine acetylation (AcK) was assessed predose and 12, 36, and 60 hours postdose, and fold changes in AcK at 12, 36, and 60 hours were incorporated into the final PPK model using an indirect response model (model II). The PK parameters were fixed during PK/PD model development and validation because of the complexity of the model. Model-predicted AcK fold changes paralleled that of predicted belinostat plasma concentrations. The reversible inhibition of histone deacetylase enzymes by belinostat is evident in the rapid decrease in fold change pf AcK upon the end of belinostat infusion.
Discussion
Belinostat is an HDI metabolized by the UGT1A1 pathway that offers the unique opportunity to examine the relationships among pharmacokinetics, pharmacodynamics, and pharmacogenomics, and this model provides insight into these relationships. This study evaluated belinostat PPK while incorporating several covariates, including UGT1A1 genotype, which is based on previous in vitro data suggesting the UGT1A1*28 genotype causes reduced belinostat glucuronidation,9 thus posing a risk for toxicity in this subpopulation. The data were taken from a phase 1 clinical trial of belinostat, given as a 48-hour CIVI, along with etoposide and cisplatin in patients with small cell lung cancer and other advanced carcinomas. With only 23 evaluable patients used for this modeling exercise, the inherent problems of small sample size are acknowledged and taken into consideration when discussing the clinical applicability of this model and simulation.
The final model used 2 compartments to best describe the kinetic disposition of belinostat when administered as a 48-hour CIVI. Several covariates were available as potential predictor variables of structural clearance or volume parameters, such as sex, race, age, body weight, height, BSA, creatinine clearance, liver function tests, QTc interval, bilirubin, albumin, and UGT1A1 genotype status (including both *28 and *60 alleles). After a thorough investigation of these continuous and categorical covariates, the CL parameter was significantly influenced by numerous covariates, including albumin levels, creatinine clearance, and UGT1A1 genotype status. The volume parameter was significantly influenced by body weight. Although less than 2% of the belinostat dose is excreted unchanged in urine,8 it was not unexpected that creatinine clearance influenced belinostat clearance significantly, considering glucuronide metabolites that are not enterohepatically recirculated are eliminated through the kidneys.
Several stratification scenarios for UGT1A1 status were explored based on preliminary PK data from a noncompartmental analysis that demonstrated UGT1A1*60 had a greater effect on CLT than UGT1A1*28.27 The final scenario was determined to be patients carrying wild-type alleles or 1 copy of *28, who were labeled EMs, whereas all others (patients with at least 2 copies of *28 or 1–2 copies of *60 alleles at these loci) were labeled IMs. Most clinical research involving drugs that undergo glucuronidation by UGT1A1 has focused on the importance of UGT1A1*28 as a genotype that can have phenotypic effects. Yet, in this data set, the allele frequency of *60 was 54%, almost identical to the reported allele frequency in whites (55%),17 who made up the majority (83%; 19 of 23) of the final data set (Table 1). This allowed for a more robust clinical analysis of any potential phenotypic effects of UGT1A1*60. These data also support previous findings that UGT1A1*28 alone is not enough to decrease expression of UGT1A1, based on bilirubin glucuronidation in Gilbert’s patients and that UGT1A1*60 was needed in combination with UGT1A1*28 to decrease expression of UGT1A1 to 56% of the wild type.29 UGT1A1*6 is a rare polymorphism in whites (<5%),17 who made up the majority of the study population, and all but 1 patient was wild type for UGT1A1*6, thus precluding this genotype in the analyses.
The point estimate for total systemic clearance (CL) of 104.1 L/h was faster than previously published data (50–74 L/h7,8), comparable to other reports (41–74 L/h/m2)6,30 and yet slower than other studies (59–132 L/h/m2)5; see Table 2. Each of the aforementioned references was based on a 30-minute infusion. There was 1 published clinical study administering belinostat as a 48-hour infusion, and the mean CL from that study was 133 L/h (106 L/h if excluding 1 outlier),23 which is almost identical to the point estimate from this study. Hepatic blood flow is approximately 90 L/h, confirming previous reports8 of belinostat having high hepatic extraction, with its total systemic clearance largely dependent on hepatic blood flow. The point estimate for volume of distribution in the central compartment (V1) was estimated at 32.2 L (total volume of distribution, ie, V1 + V2, was 40.9 L; Table 2). This volume is above the total plasma volume (5–7 L), but comparable to total body water volume of 42 L (based on a typical 70-kg man), which is consistent with belinostat being highly protein bound (93%–96%), thereby limiting tissue distribution.8 Further, a logPoct/water of 1.7, suggests unionized belinostat is not lipophilic enough to extensively distribute into tissues. The model-predicted half-life (0.2 hours, based on HL = ln2/kel, where kel = CL/V1) was slightly shorter than the observed mean from NCA (ln2/λz, 0.82 hours27) and the reported range of 0.3– hours.5,8
A pharmacogenomic study of patients treated with belinostat indicated that carriers of allelic variants of UGT1A1*28 and UGT1A1*60 had greater exposure and higher toxicity.27 Therefore, simulations were performed to aid in accounting for UGT1A1 genotype in dose optimization, and it was determined that doses of 600 mg/m2/24 h to EMs and 400 mg/m2/24 h to IMs would provide equivalent exposures. This dose adjustment based on UGT1A1 genotype will hopefully allow patients with variant alleles that may have impaired metabolism and clearance, allowing for otherwise higher exposures to now have exposures equivalent to those patients with wild-type UGT1A1 and therefore experience adverse events at a similar rate, as well as increase treatment tolerability. This dose adjustment simulation supported an amendment to this study (recently accepted by the NCI IRB) to modify dosing based on UGT1A1 genotype. This has applicability not only to the 48-hour continuous infusion schedule but also to the 30-minute daily ×5 schedule. It will be important in developing combination therapies with belinostat to understand and correct for the impact of UGT1A1 genotype. Not only is there potential for increased toxicity in those carrying variant alleles, but also there is the risk that phase 2 doses selected as safe in the development of combinations will undertreat patients carrying wild-type alleles. Indeed, determination of drug-metabolizing enzyme genotypes has been shown to be important in several agents in the clinic, including irinotecan (UGT1A1)31 and clopidogrel (CYP2C19).32
In conclusion, it was the objective of this study to report a PPK model that incorporated several covariates on CL, including the UGT1A1 genotype. The PPK model was further developed and validated to incorporate PD data of reversible global protein lysine acetylation to visualize a relevant exposure/response relationship. Because a common problem with clinical pharmacology in oncology is the narrow therapeutic window of many drugs, determining more individualized optimal doses can hopefully reduce the incidence of adverse events and allow patients to stay on beneficial therapy longer. With that in mind, the PPK model described here was used to simulate optimal doses of belinostat given as a 48-hour CIVI based on UGT1A1 genotype.
Supplementary Material
Acknowledgments
We thank all the nurses and clinical support staff for their patient care, the Blood Processing Core of the NCI for their sample handling/processing, and Seth Steinberg for his statistical analyses.
Funding
This project has been funded in whole or in part with federal funds from the National Cancer Institute, National Institutes of Health. This work was supported by the Intramural Research Program of the NIH, National Cancer Institute, Center for Cancer Research.
Footnotes
Declaration of Conflicting Interests
All authors declare no conflicts of interest and have nothing to disclose.
Disclaimer
The content of this publication does not necessarily reflect the views or policies of the Department of Health and Human Services, nor does mention of trade names, commercial products, or organizations imply endorsement by the U.S. government.
References
- 1.Peart MJ, Smyth GK, van Laar RK, et al. Identification and functional significance of genes regulated by structurally different histone deacetylase inhibitors. Proc Natl Acad Sci U S.A. 2005;102(10):3697–3702. [DOI] [PMC free article] [PubMed] [Google Scholar]
- 2.Xu WS, Parmigiani RB, Marks PA, Histone deacetylase inhibitors: molecular mechanisms of action. Oncogene. 2007;26(37):5541–5552. [DOI] [PubMed] [Google Scholar]
- 3.Piekarz RL, Bates SE. Epigenetic modifiers: basic understanding and clinical development. Clin Cancer Res. 2009;15(12):3918–3926. [DOI] [PMC free article] [PubMed] [Google Scholar]
- 4.Luchenko VL, Litman T, Chakraborty AR, et al. Histone deacetylase inhibitor-mediated cell death is distinct from its global effect on chromatin. Mol Oncol. 2014;8(8):1379–1392. [DOI] [PMC free article] [PubMed] [Google Scholar]
- 5.Steele NL, Plumb JA, Vidal L, et al. A phase 1 pharmacokinetic and pharmacodynamic study of the histone deacetylase inhibitor belinostat in patients with advanced solid tumors. Clin Cancer Res. 2008;14(3):804–810. [DOI] [PubMed] [Google Scholar]
- 6.Lassen U, Molife LR, Sorensen M, et al. A phase I study of the safety and pharmacokinetics of the histone deacetylase inhibitor belinostat administered in combination with carboplatin and/or paclitaxel in patients with solid tumours. Br J Cancer. 2010;103(1):12–17. [DOI] [PMC free article] [PubMed] [Google Scholar]
- 7.Yeo W, Chung HC, Chan SL, et al. Epigenetic therapy using belinostat for patients with unresectable hepatocellular carcinoma: a multicenter phase I/II study with biomarker and pharmacokinetic analysis of tumors from patients in the Mayo Phase II Consortium and the Cancer Therapeutics Research Group. J Clin Oncol. 2012;30(27):3361–67. [DOI] [PMC free article] [PubMed] [Google Scholar]
- 8.Spectrum Pharmaceuticals. Highlights of BELEODAQ prescribing information;2014. http://www.accessdata.fda.gov/drugsatfda_docs/label/2014/206256lbl.pdf
- 9.Wang LZ, Ramirez J, Yeo W, et al. Glucuronidation by UGT1A1 is the dominant pathway of the metabolic disposition of belinostat in liver cancer patients. PLoS One. 2013;8(1):e54522. [DOI] [PMC free article] [PubMed] [Google Scholar]
- 10.Kiesel BF, Parise RA, Tjornelund J, et al. LC-MS/MS assay for the quantitation of the HDAC inhibitor belinostat and five major metabolites in human plasma. J Pharm Biomed Anal. 2013;81–82:89–98. [DOI] [PMC free article] [PubMed] [Google Scholar]
- 11.Ando Y, Saka H, Asai G, et al. UGT1A1 genotypes and glucuronidation of SN-38, the active metabolite of irinotecan. Ann Oncol. 1998;9(8):845–847. [DOI] [PubMed] [Google Scholar]
- 12.Lee JS, Wang J, Martin M, et al. Genetic variation in UGT1A1 typical of Gilbert syndrome is associated with unconjugated hyperbilirubinemia in patients receiving tocilizumab. Pharmacogenet Genomics. 2011;21(7):365–374. [DOI] [PubMed] [Google Scholar]
- 13.Toffoli G, Cecchin E, Corona G, et al. The role of UGT1A1*28 polymorphism in the pharmacodynamics and pharmacokinetics of irinotecan in patients with metastatic colorectal cancer. J Clin Oncol. 2006;24(19):3061–3068. [DOI] [PubMed] [Google Scholar]
- 14.Zhou CF, Ma T, Su Y, et al. UGT1A1 gene polymorphisms and the toxicities of FOLFIRI in Chinese Han patients with gastrointestinal cancer. Anticancer Agents Med Chem. 2013;13(2):235–241. [DOI] [PubMed] [Google Scholar]
- 15.Innocenti F, Grimsley C, Das S, et al. Haplotype structure of the UDP-glucuronosyltransferase 1A1 promoter in different ethnic groups. Pharmacogenetics. 2002;12(9):725–733. [DOI] [PubMed] [Google Scholar]
- 16.Sugatani J, Yamakawa K, Yoshinari K, et al. Identification of a defect in the UGT1A1 gene promoter and its association with hyperbilirubinemia. Biochem Biophys Res Commun. 2002;292(2):492–497. [DOI] [PubMed] [Google Scholar]
- 17.Kaniwa N, Kurose K, Jinno H, et al. Racial variability in haplotype frequencies of UGT1A1 and glucuronidation activity of a novel single nucleotide polymorphism 686C> T (P229L) found in an African-American. Drug Metab Dispos. 2005;33(3):458–465. [DOI] [PubMed] [Google Scholar]
- 18.Bosma PJ, Chowdhury JR, Bakker C, et al. The genetic basis of the reduced expression of bilirubin UDP-glucuronosyltransferase 1 in Gilbert’s syndrome. N Engl J Med. 1995;333(18):1171–1175. [DOI] [PubMed] [Google Scholar]
- 19.Sato H, Adachi Y, Koiwai O. The genetic basis of Gilbert’s syndrome. Lancet. 1996;347(9001):557–558. [DOI] [PubMed] [Google Scholar]
- 20.Beal SL. Ways to fit a PK model with some data below the quantification limit. J Pharmacokinet Pharmacodyn. 2001;28(5):481–504. [DOI] [PubMed] [Google Scholar]
- 21.Ahn JE, Karlsson MO, Dunne A, Ludden TM. Likelihood based approaches to handling data below the quantification limit using NONMEM VI. J Pharmacokinet Pharmacodyn. 2008;35(4):401–421. [DOI] [PubMed] [Google Scholar]
- 22.Bergstrand M, Karlsson MO. Handling data below the limit of quantification in mixed effect models. AAPS J. 2009;11(2):371–380. [DOI] [PMC free article] [PubMed] [Google Scholar]
- 23.Thomas A, Rajan A, Szabo E, et al. A phase I/II trial of belinostat in combination with cisplatin, doxorubicin, and cyclophosphamide in thymic epithelial tumors: a clinical and translational study. Clin Cancer Res. 2014;20(21):5392–5402. [DOI] [PMC free article] [PubMed] [Google Scholar]
- 24.Savic RM, Karlsson MO. Importance of shrinkage in empirical bayes estimates for diagnostics: problems and solutions. AAPS J. 2009;11(3):558–569. [DOI] [PMC free article] [PubMed] [Google Scholar]
- 25.Giaccone G, Rajan A, Berman A, et al. Phase II study of belinostat in patients with recurrent or refractory advanced thymic epithelial tumors. J Clin Oncol. 2011;29(15):2052–2059. [DOI] [PMC free article] [PubMed] [Google Scholar]
- 26.Sharma A, Jusko WJ. Characteristics of indirect pharmacodynamic models and applications to clinical drug responses. Br J Clin Pharmacol. 1998;45(3):229–239. [DOI] [PMC free article] [PubMed] [Google Scholar]
- 27.Goey AK, Sissung TM, Peer CJ, et al. Effects of UGT1A1 genotype on the pharmacokinetics, pharmacodynamics and toxicities of belinostat administered by 48 h continuous infusion in patients with cancer. J Clin Pharmacol. In press. [DOI] [PMC free article] [PubMed] [Google Scholar]
- 28.Marquard L, Petersen KD, Persson M, et al. Monitoring the effect of belinostat in solid tumors by H4 acetylation. APMIS. 2008;116(5):382–392. [DOI] [PMC free article] [PubMed] [Google Scholar]
- 29.Matsui K, Maruo Y, Sato H, Takeuchi Y. Combined effect of regulatory polymorphisms on transcription of UGT1A1 as a cause of Gilbert syndrome. BMC Gastroenterol. 2010;10:57. [DOI] [PMC free article] [PubMed] [Google Scholar]
- 30.CuraGen Corporation. Investigator’s brochure for belinostat (PXD101), version 5.0;2007. [Google Scholar]
- 31.Ramchandani RP, Wang Y, Booth BP, et al. The role of SN-38 exposure, UGT1A1*28 polymorphism, and baseline bilirubin level in predicting severe irinotecan toxicity. J Clin Pharmacol. 2007;47(1):78–86. [DOI] [PubMed] [Google Scholar]
- 32.Horenstein RB, Madabushi R, Zineh I, et al. Effectiveness of clopidogrel dose escalation to normalize active metabolite exposure and antiplatelet effects in CYP2C19 poor metabolizers. J Clin Pharmacol. 2014;54(8):865–873. [DOI] [PMC free article] [PubMed] [Google Scholar]
Associated Data
This section collects any data citations, data availability statements, or supplementary materials included in this article.