Abstract
Here we describe a new analytical technique for the high-precision measurement of 182W/184W and 183W/184W using negative thermal ionization mass spectrometry (N-TIMS). We improve on the recently reported method of Trinquier et al. (2016), which described using Faraday cup collectors coupled with amplifiers utilizing 1013 Ω resistors to continuously monitor the 18O/16O of WO3− and make per-integration oxide corrections. In our study, we report and utilize a newly measured oxygen mass fractionation line, as well as average 17O/16O and 18O/16O, which allow for more accurate per-integration oxide interference corrections. We also report a Faraday cup and amplifier configuration that allows 18O/16O to be continuously monitored for WO3− and ReO3−, both of which are ionized during analyses of W using Re ribbon. The long-term external precision of 182W/184W is 5.7 ppm and 3.7 ppm (2SD) when mass bias corrected using 186W/184W and 186W/183W, respectively. For 183W/184W mass bias is corrected using 186W/184W, yielding a long-term external precision of 6.6 ppm. An observed, correlated variation in 182W/184W and 183W/184W, when mass bias corrected using 186W/184W, is most likely the result of Faraday cup degradation over months-long intervals.
Keywords: Thermal ionization mass spectrometry, N-TIMS, Tungsten isotope, Oxide interference correction, 182W, 183W
1. Introduction
The short-lived 182Hf-182W isotopic system (t1/2 = 8.9 Myr; [2] is useful for constraining the timing of early Solar System metal-silicate equilibration (within the first ~50 Ma of Solar System history) because W is moderately siderophile and largely partitions into Fe-rich metal, whereas Hf is lithophile and partitions entirely into silicate. The most widely used application for this system has been dating core formation of planetary bodies. By measuring W isotopic compositions of iron meteorites, model ages can be calculated, assuming chondritic Hf/W (e.g., [3–5]. The Hf-W isotopic system has also been used to date formation or closure ages of silicate-rich rocks by plotting Hf/W vs. 182W/184W, yielding internal isochrons. For example, Hf-W isochrons have been used to date formation or closure ages of bulk chondritic meteorites [6], calcium-aluminum-rich inclusions [7], chondrules, and matrix [8]. The 182Hf-182W isotopic system has also been used for terrestrial applications. For example, the W isotopic compositions of mantle-derived rocks have been used to investigate mantle evolution (e.g., [9–13]. In some instances, isotopic variations in 182W/184W are <20 ppm.
During the analysis of W by negative thermal ionization mass spectrometry (N-TIMS) when using Re filaments as the ionizing substrate, the different species of ReO3− and WO3− that incorporate 17O and/or 18O (e.g., 182W16O218O− and 185Re16O217O−) form isobaric interferences on the signals of some of the primary W16O3− beams measured. The oxygen isotopic compositions of ReO3− and WO3− must, therefore, be accurately determined for isobaric interference corrections, and the in-run fractionation of oxygen isotopes during analyses must also be monitored.
Ref. [14] reported an N-TIMS method capable of measuring 182W/184W with a long-term (over a period of 9 months) external reproducibility of <5 ppm (2SD). That study used the oxygen isotopic composition of the atmosphere reported by [15] to make a first-order correction for oxide interferences on primary xW16O3− signals. Then, a second-order correction utilized the coevolution of 183W/184W and 182W/184W to correct for in-run fractionations of oxygen isotopes. Because it used an assumed 183W/184W in the correction process, this method did not allow a corresponding measurement of 183W/184W, which varies among some meteorites (e.g., [7]).
A more recent analytical study [1] reported measurements of both 182W/184W and 183W/184W with long-term external reproducibilities of ~10–11 ppm (2SD) and ~17–18 ppm (2SD), respectively. As in [14], they corrected minor oxide interferences assuming the atmospheric composition reported by [15]. They corrected in-run fractionations of oxygen isotopes using per-integration measured 186W16O218O/186W16O3 to calculate 18O/16O and infer 17O/16O, using a terrestrial fractionation slope (e.g., [16] passed through the 17O/16O and 18O/16O reported by [15].
The methods reported by these two prior studies bear some additional scrutiny. The use of the 17O/16O and 18O/16O ratios reported by [15] may not be appropriate for measurements of ReO3− and WO3− via N-TIMS. Further, [1] measured only the 18O/16O of WO3− for each integration. The oxygen isotopic composition of ReO3− was assumed to uniformly follow the same evolution trend, which may not be the case. Ref. [1] reported that the method was limited to analyses with Re/W < 0.3, as a systematic bias to higher 182W/184W was observed for analyses with high Re/W. Some sample and standard analyses, especially those with low W abundances, sometimes have Re/W > 0.3.
Here we present a new analytical technique, refining the methods of [14] and [1], for making measurements of 182W/184W and 183W/184W to external precisions ~5 ppm, even for analyses with Re/W > 0.3. This analytical technique uses a newly determined average 17O/16O and 18O/16O, appropriate for measuring ReO3− and WO3− by N-TIMS, and a new oxygen mass fractionation line for oxide corrections. Per-integration fractionations of oxygen isotopes are corrected for both ReO3− and WO3− by measuring both 186W16O218O/186W16O3 and 187Re16O218O/187Re16O3.
2. Experimental section
2.1. Filament preparation and loading
A filament loading technique slightly modified from [14] was used. Either 300 ng, 500 ng, or 1000 ng of Alfa Aesar W standard solution were loaded onto single Re filaments, which were outgassed ~48 h in advance. Throughout this study, both thick (0.76 mm × 0.030 mm) and thin (0.51 mm × 0.025 mm) Re filaments were used. After loading W, Re filaments were briefly (~1 s) heated to a dull glow, and then left to sit for at least 24 h before loading activator. To enhance ionization, 1 μL of activator solution containing 5 μg each of La and Gd in 5% Teflon distilled HNO3 was then added in 2–3 aliquots to the standard and sample deposits, and then dried until a white crust formed.
2.2. Instrumental setup
Analyses were performed on the University of Maryland (UMd) Thermo-Fisher Triton thermal ionization mass spectrometer. Oxide production was enhanced by bleeding oxygen (PO2 = 1.0 × 10⁻⁷ mbar) into the source can using a Varian leak valve. Similar to the method of [14], all analyses by this study used a multi-static analytical protocol with two lines of acquisition, which allowed Faraday cup biases to be monitored. Each line of acquisition utilized 9 Faraday cups (Table 1). Seven Faraday cups (L4–H2) were electronically connected to amplifiers with 1011 Ω resistors, which were electronically rotated during analyses to mitigate amplifier biases. Faraday cups H3 and H4 were connected to amplifiers with 1012 Ω resistors to measure the low signals generated by the minor 186W16O218O− and 187Re16O218O− species, which were used to calculate per-integration oxide corrections. These amplifiers were not rotated during analyses. The center Faraday cup was centered on masses 232 (184W16O3−) and 234 (186W16O3−) for acquisition lines 1 and 2, respectively.
Table 1.
Faraday cup-amplifier-resistor configuration for measurement of W using N-TIMS utilizing 9 Faraday cups.
| L4 | L3 | L2 | L1 | C | H1 | H2 | H3 | H4 | |
|---|---|---|---|---|---|---|---|---|---|
| Line 1 | 180W16O3 | 181Ta16Oa | 182w16o3 | 183w16o3 | 184w16o3 | 185Re16O3 | 186w16o3 | 186w16o218o | 187Re16O218O |
| Line 2 | 182w16o3 | 183w16o3 | 184w16o3 | 185 Re16 O3 | 186w16o3 | 187Re16O3 | 186w16o218o | 190Os16O3 | |
| Resistor | 1011 Ω | 1011 Ω | 1011 Ω | 1011 Ω | 1011 Ω | 1011 Ω | 1011 Ω | 1012 Ω | 1012 Ω |
With this analytical protocol, all W16O3− and Re16O3− species were measured, and inter-collector biases were corrected for all major W species (182W16O3−, 183W16O3−, 184W16O3−, and 186W16O3−). The 186W16O218O− and 187Re16O218O− species were also measured, from which the 18O/16O could be calculated, and the 17O/16O could be inferred using an oxygen mass fractionation line. One isotope each of Ta and Os (181Ta and 190Os) were also monitored so that isobaric interference corrections for these elements could be made. However, these signals were below detection limits (a few μV) for all analyses.
Typically, 600 integrations were measured over 770 min, although some analyses were cut short because of rapidly decreasing signals. A 1260 s baseline was measured at the beginning of each analysis and then re-measured every 100 integrations. Each integration consisted of 33.6 s and 8.4 s of acquisition duration for lines 1 and 2, respectively. The idle times before integrations were 10 s and 4 s for acquisition lines 1 and 2, respectively.
2.3. Data reduction
In the first data reduction step, single estimated values (see Section 3.1) for 17O/16O (0.0003913) and 18O/16O (0.002096) were used to make first-order oxide interference corrections to all xW16O3− and xRe16O3− signals. Relative abundances of trioxide species for each W and Re isotope (e.g., 184W17O16O2−, 184W18O16O2−, 184W18O216O−, etc.) were calculated following the calculations of [4], using the estimated 17O/16O and 18O/16O. In the next step, first-order oxide-corrected 186W16O218O−/186W16O3− and 187Re16O218O−/187Re16O3− from each integration were used to calculate per-integration 18O/16O for WO3− and ReO3−. A linear trend with a terrestrial fractionation slope (0.0954) that passed through the estimated values for 17O/16O (0.0003913) and 18O/16O (0.002096) was then used to calculate per-integration 17O/16O from each per-integration 18O/16O.
Per-integration 17O/16O and 18O/16O were then used to make line-by-line oxide corrections to all xW16O3− and xRe16O3− signals. All isobaric interferences on xW16O3− and xRe16O3− for which corrections were made are listed in Table 2. The most signifi-cant isobaric interferences were from xW17O16O2−, xW18O16O2−, xRe17O16O2−, and xRe18O16O2−species. No corrections were made for low abundance trioxide species (e.g., xW18O3−) that do not significantly interfere with primary xW16O3− and xRe16O3− signals Yin, [17]).
Table 2.
Interferences on primary x16O3− species that require corrections. Oxygen isotopic compositions represent total oxygen masses (e.g., 184W50O3− = 184W16O218O− + 184W16O17O2−).
| Species | 180W16O3− | 182W16O3− | 183W16O3− | 184W16 O3− | 185Re16O3− | 186W16O3− | 187Re16O3− | 186W16O2180− | 187Re16O218O− |
|---|---|---|---|---|---|---|---|---|---|
| Mass | 228 | 230 | 231 | 232 | 233 | 234 | 235 | 236 | 237 |
| 180Ta48O3− | 180W50O3− | 180W51O3− | 180W52O3− | 181Ta52O3− | 182W52O3− | 183W52O3− | 184W52O3− | 185Re52O3− | |
| Interfering | 180Ta50O3− | 180Ta51O3− | 180Ta52O3− | 182W51O3− | 183W51O3− | 184W51O3− | 185Re51O3− | 186W51O3− | |
| Species | 181Ta49O3− | 181Ta50O3− | 181Ta51O3− | 183w50O3− | 184w50O3− | 185Re50O3− | 187Re49O3− | ||
| 182w49O3− | 182W50O3− | 184w49O3− | 185Re49O3− | 186w49O3− | |||||
| 183w49O3− |
Finally, the per-integration oxide-corrected 182W16O3−/184W16O3− were corrected for instrumental mass bias by normalizing to 186W/183W = 0.92767 or 186W/184W = 1.98594 [18], using the exponential law [19]. Per-integration oxide corrected 183W16O3−/184 W16O3− were only corrected for mass bias using 186W/184W = 1.98594. Mass bias corrections were calculated using molecular masses (e.g., 232 for 184W16O3).
3. Results and discussion
In order to determine the isotopic composition of oxygen associated with Re trioxide formation, we measured the isotopic compositions of Re beams generated by loading activator onto Re filaments with no W. The results of 8 analyses of Re ribbon are summarized in Table 3, and shown in Fig. 1. Using these results, data for 30 analyses of standard solutions (300 ng–1000 ng Alfa Aesar W) are summarized in Table 4, and shown in Figs. 2, 3, and 4. A natural sample (group IVB iron meteorite Skookum) analyzed using this method, and compared to previously published results, is shown in Fig. 8.
Table 3.
Data for 8 analyses of Re ribbon with only activator (5 μg each La and Gd loaded). Errors are 2SD internal precisions and reflect in-run evolution of oxygen isotopic compositions.
| Analysis # | 18O/16O | 2SD (‰) | 17O/16O | 2SD (‰) |
|---|---|---|---|---|
| 1 | 0.002085 | 5.4 | 0.0003894 | 6.2 |
| 2 | 0.002090 | 7.6 | 0.0003905 | 7.1 |
| 3 | 0.002100 | 2.6 | 0.0003917 | 3.8 |
| 4 | 0.002110 | 2.9 | 0.0003926 | 3.9 |
| 5 | 0.002125 | 2.3 | 0.0003940 | 4.7 |
| 6 | 0.002098 | 4.1 | 0.0003919 | 3.8 |
| 7 | 0.002088 | 8.1 | 0.0003906 | 9.1 |
| 8 | 0.002074 | 8.1 | 0.0003896 | 5.7 |
| Mean | 0.002096 | 7.7‰ | 0.0003913 | 4.1 ‰ |
Fig. 1.
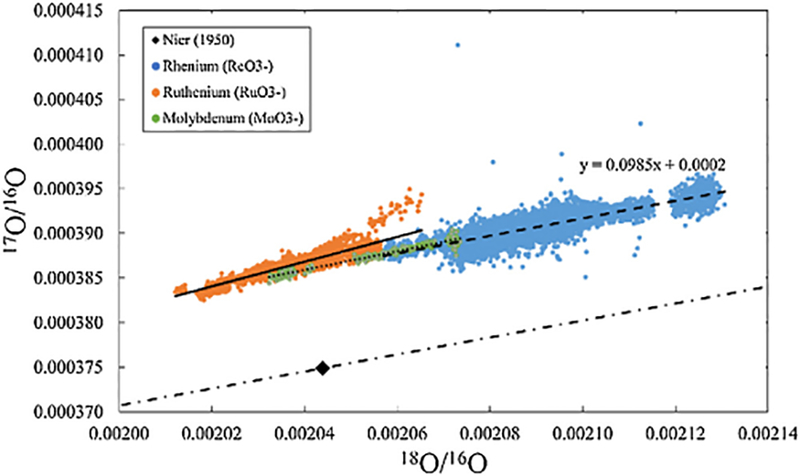
Measured oxygen isotopic compositions for ReO3− (this study), RuO3− [20], and MoO3− [21]. The oxygen isotopic composition of atmosphere reported by Nier (1950) and a terrestrial fractionation line (dashed-dotted line), which were used by previous studies [14,1] are shown for reference. Linear regressions are shown as dashed (ReO3−), solid (RuO3−), and dotted (MoO3−) lines.
Table 4.
Standards data for 30 analyses of 300 ng–1000 ng of Alfa Aesar W. Errors are 2SE absolute internal precisions. 185Re/184W are the average signal intensity ratios for entire analyses.
| Standard # | Session ID # | W Abundance | Type | Date | 185Re/184W | 182W/184WN6/4 | 2SE | 183W/184WN6/4 | 2SE | 182W/184WN6/3 | 2SE |
|---|---|---|---|---|---|---|---|---|---|---|---|
| 1 | 381 | 1 μg | Thick | Feb 18, 2016 | 0.126 | 0.864893 | 0.000004 | 0.467148 | 0.000002 | 0.864869 | 0.000003 |
| 2 | 381 | 300 ng | Thick | Feb 19, 2016 | 0.196 | 0.864890 | 0.000005 | 0.467146 | 0.000002 | 0.864866 | 0.000004 |
| 3 | 382 | 1 μg | Thick | Feb 24, 2016 | 0.115 | 0.864893 | 0.000004 | 0.467149 | 0.000002 | 0.864867 | 0.000003 |
| 4 | 382 | 1 μg | Thick | Feb 25, 2016 | 0.125 | 0.864893 | 0.000004 | 0.467147 | 0.000002 | 0.864870 | 0.000003 |
| 5 | 382 | 1 μg | Thick | Feb 29, 2016 | 0.052 | 0.864890 | 0.000004 | 0.467146 | 0.000002 | 0.864869 | 0.000003 |
| 6 | 382 | 1 μg | Thick | March 3, 2016 | 0.039 | 0.864893 | 0.000004 | 0.467147 | 0.000002 | 0.864870 | 0.000003 |
| Cup Maintenance Performed | April 1st, 2016 | Mean 2SD(ppm) |
0.864892 4.0 |
0.467147 4.3 |
0.864869 3.6 |
||||||
| 7 | 385 | 1 μg | Thin | April 5, 2016 | 0.048 | 0.864889 | 0.000005 | 0.467144 | 0.000002 | 0.864870 | 0.000004 |
| 8 | 385 | 1 μg | Thick | April 6, 2016 | 0.066 | 0.864889 | 0.000004 | 0.467146 | 0.000002 | 0.864866 | 0.000003 |
| 9 | 385 | 300 ng | Thick | April 7, 2016 | 0.118 | 0.864890 | 0.000004 | 0.467145 | 0.000002 | 0.864867 | 0.000003 |
| 10 | 386 | 1 μg | Thick | April 11, 2016 | 0.162 | 0.864889 | 0.000004 | 0.467145 | 0.000002 | 0.864867 | 0.000003 |
| 11 | 386 | 1 μg | Thick | April 12, 2016 | 0.176 | 0.864889 | 0.000004 | 0.467148 | 0.000002 | 0.864866 | 0.000003 |
| 12 | 386 | 1 μg | Thick | April 13, 2016 | 0.057 | 0.864887 | 0.000004 | 0.467146 | 0.000002 | 0.864866 | 0.000003 |
| 13 | 386 | 1 μg | Thick | April 13, 2016 | 0.088 | 0.864891 | 0.000004 | 0.467146 | 0.000002 | 0.864868 | 0.000003 |
| 14 | 386 | 500 ng | Thin | April 14, 2016 | 0.061 | 0.864892 | 0.000004 | 0.467145 | 0.000002 | 0.864870 | 0.000003 |
| 15 | 386 | 1 μg | Thin | April 18, 2016 | 0.050 | 0.864890 | 0.000004 | 0.467144 | 0.000002 | 0.864870 | 0.000003 |
| 16 | 386 | 500 ng | Thin | April 19, 2016 | 0.096 | 0.864890 | 0.000004 | 0.467145 | 0.000002 | 0.864868 | 0.000003 |
| 17 | 386 | 1 μg | Thick | April 19, 2016 | 0.170 | 0.864891 | 0.000004 | 0.467146 | 0.000002 | 0.864869 | 0.000003 |
| 18 | 386 | 500 ng | Thick | April 20, 2016 | 0.102 | 0.864884 | 0.000004 | 0.467143 | 0.000002 | 0.864865 | 0.000003 |
| 19 | 386 | 500 ng | Thick | April 21, 2016 | 0.164 | 0.864887 | 0.000005 | 0.467146 | 0.000002 | 0.864868 | 0.000004 |
| 20 | 387 | 1 μg | Thin | April 25, 2016 | 0.081 | 0.864893 | 0.000004 | 0.467146 | 0.000002 | 0.864871 | 0.000003 |
| 21 | 387 | 1 μg | Thick | May 1, 2016 | 0.026 | 0.864893 | 0.000004 | 0.467145 | 0.000002 | 0.864872 | 0.000003 |
| 22 | 387 | 500 ng | Thick | May 2, 2016 | 0.312 | 0.864886 | 0.000006 | 0.467143 | 0.000003 | 0.864867 | 0.000004 |
| 23 | 389 | 500 ng | Thin | May 16, 2016 | 0.042 | 0.864885 | 0.000004 | 0.467141 | 0.000002 | 0.864868 | 0.000003 |
| 24 | 389 | 1 μg | Thin | May 17, 2016 | 0.038 | 0.864888 | 0.000004 | 0.467145 | 0.000002 | 0.864868 | 0.000003 |
| 25 | 389 | 1 μg | Thick | May 20, 2016 | 0.022 | 0.864892 | 0.000004 | 0.467147 | 0.000002 | 0.864869 | 0.000003 |
| 26 | 389 | 1 μg | Thick | May 22, 2016 | 0.031 | 0.864886 | 0.000004 | 0.467143 | 0.000002 | 0.864866 | 0.000003 |
| 27 | 390 | 1 μg | Thin | May 26, 2016 | 0.051 | 0.864888 | 0.000003 | 0.467144 | 0.000001 | 0.864868 | 0.000002 |
| 28 | 390 | 1 μg | Thin | May 27, 2016 | 0.031 | 0.864887 | 0.000003 | 0.467143 | 0.000002 | 0.864868 | 0.000002 |
| 29 | 390 | 1 μg | Thin | May 30, 2016 | 0.034 | 0.864888 | 0.000004 | 0.467145 | 0.000002 | 0.864867 | 0.000003 |
| 30 | 390 | 500 ng | Thin | June 2, 2016 | 0.081 | 0.864887 | 0.000004 | 0.467142 | 0.000002 | 0.864868 | 0.000003 |
| Mean 2SD (ppm) |
0.864889 5.7 |
0.467145 6.6 |
0.864868 3.7 |
Fig. 2.
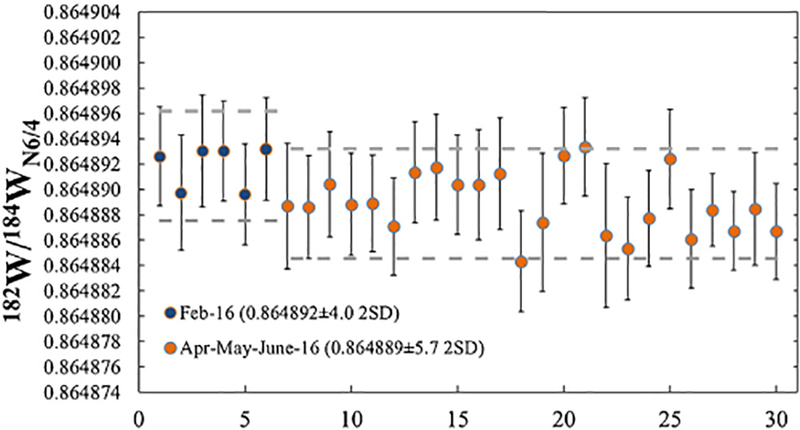
182W/184W normalized to 186W/184W for 30 analyses of 300ng–1000 ng Alfa Aesar W standards. Mean 182W/184W and 2SD for each period shown in legend. Grey dashed lines mark 5 ppm from the mean. Error bars represent 2SE internal precisions.
Fig. 3.
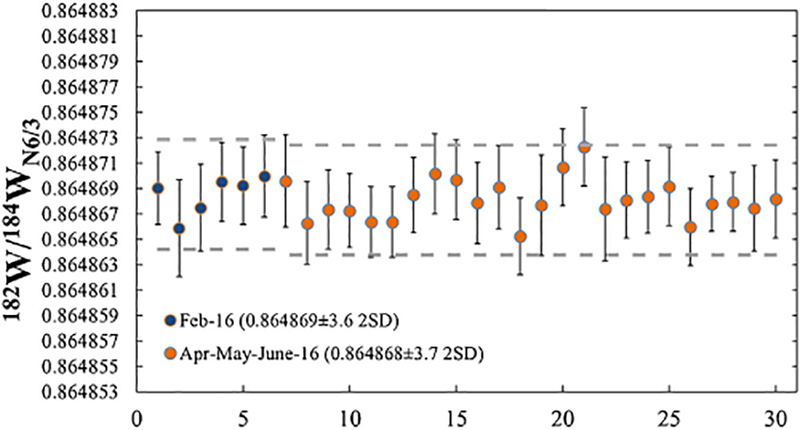
182W/184W normalized to 186W/183W for 30 analyses of 300ng–1000 ng Alfa Aesar W standards. Mean 182W/184W and 2SD for each period shown in legend. Grey dashed lines mark 5 ppm from the mean. Error bars represent 2SE internal precisions.
Fig. 4.
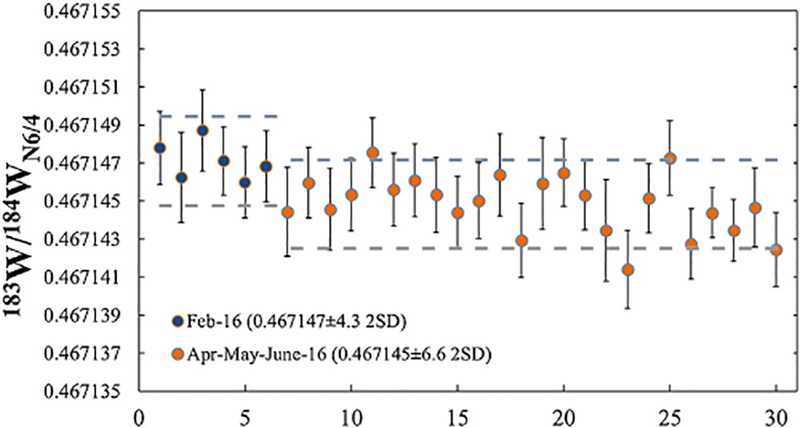
183W/184W normalized to 186W/184W for 30 analyses of 300ng–1000 ng Alfa Aesar W standards. Mean 183W/184W and 2SD for each period shown in legend. Grey dashed lines mark 5 ppm from the mean. Error bars represent 2SE internal precisions.
Fig. 8.
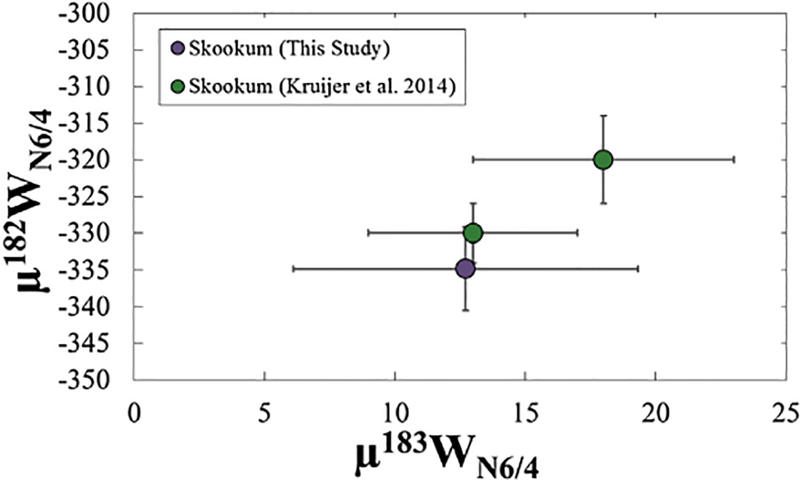
μ183WN6/4 vs. μ182WN6/4 for the group IVB iron meteorite Skookum. One analysis is from this study, and two analyses were taken from [5]. The error bars for the datum from this study are 2SD, and the error bars for the data from [5] are 2SE (n = 5) of repeated measurements.
3.1. First-order and per-integration oxide corrections
High-precision W analyses at the ~5 ppm level require either second-order [14] or per-integration [1] oxide corrections because of in-run mass-dependent oxygen fractionation. This study utilized per-integration oxide corrections because 183W/184W, which varies nature, can be measured using this method.
Before per-integration oxide corrections could be performed, the signals used to calculate per-integration 17O/16O and 18O/16O for WO3− and ReO3− (186W16O218O−, 186W16O3−, 187Re16O218O−, and 187Re16O3−) had to be first-order oxide-corrected. First-order oxide correction is defined as an oxide correction using a single, assumed value (i.e., an estimated 17O/16O and 18O/16O). For this estimate, the means of 17O/16O and 18O/16O calculated from 187Re16O217O−/187Re16O3− and 187Re16O218O−/187Re16O3− measured on Re filaments (n = 8) loaded with only 5 μg each of La and Gd were used (Table 3). The means of 17O/16O and 18O/16O determined by this study were 0.0003913 and 0.002096, respectively (Fig. 1). These values are significantly higher than the values used by previous studies, e.g., 17O/16O = 0.0003749 and18O/16O = 0.002044 [15,14,1]. Because 187Re16O3− is an isobar with 186W16O217O−, measured 186W16O217O−/186W16O3− and 186W16O218O−/186W16O3− could not be used to make this estimate.
The repeated measurements of 187Re16O217O−/187Re16O3− and 187Re16O218O−/187Re16O3− from Re filaments also provides an oxygen mass fractionation line that is consistent with recently reported oxygen mass fractionation lines for OsO3−, RuO3−, and MoO3− (Fig. 1) measured by N-TIMS [20–23]. These lines are all offset from the oxygen fractionation line used by previous W studies utilizing N-TIMS. The slope of a linear regression through the ReO3− oxygen mass fractionation line (0.0985 ± 0.0018 2SD) is similar to the slope of the terrestrial fractionation line (0.0954), so the terrestrial fractionation slope was used to infer 17O/16O from measured 18O/16O.
3.2. External and internal precision
The external precision (n = 6) of 300 ng–1000 ng Alfa Aesar W standards analyzed in February 2016 was 4.0 ppm and 3.6 ppm for182W/184W normalized to 186W/184W (182W/184WN6/4) and 186W/183W (182W/184WN6/3), respectively (Table 4; Figs. 2 and 3). After Faraday cup maintenance (mechanical removal of deposits on graphite inserts from each Faraday cup, except the center cup) was performed in April 2016, the mean 182W/184WN6/4 shifted downwards by ~3 ppm (Fig. 2), whereas the 182W/184WN6/3 only shifted by ~1 ppm (Fig. 3). Faraday cup condition, therefore, appears to have a ~3x larger influence on 182W/184WN6/4 than 182W/184WN6/3.
The long-term external precision (n = 24; over a period of 3 months after Faraday cup maintenance) of 300 ng–1000 ng Alfa Aesar W standards analyzed from April-June 2016 was 5.7 ppm and 3.7 ppm for182W/184WN6/4 and 182W/184WN6/3, respectively (Table 4; Figs. 2 and 3), which is 2–3 x more precise for 182W/184WN6/4 and 182W/184WN6/3 than the most recently reported method for measuring W via N-TIMS [1]. These improvements in precision are likely the result of the more accurate oxide corrections for both WO3− and ReO3−. Consistent with prior studies [14,1], the long-term external precision of 182W/184W is better when normalizing to 186W/183W than 186W/184W because of the closer proximity of the normalizing isotopes (183W vs. 184W). However, normalization to 186W/183W is only appropriate for samples with 183W/184W identical to terrestrial standards, as 183W varies among some meteorites. The long-term external precision of 182W/184WN6/4 and 182W/184WN6/3 were 5.2 ppm and 2.6 ppm, respectively, for thin ribbon (n = 11). For thick ribbon (n = 13), the 182W/184WN6/4 and 182W/184WN6/3 were 6.2 and 4.3 ppm, respectively.
The external precision of 183W/184WN6/4 for February 2016 was 4.3 ppm (Table 4; Fig. 4). 183W/184WN6/4 is also sensitive to Faraday cup condition and shifted by ~5 ppm after cup maintenance was performed in April 2016. The long-term external precision (n = 24) of 300 ng–1000 ng Alfa Aesar W standards analyzed from April-June 2016 was 6.6 ppm for183W/184WN6/4 (Table 4; Fig. 4). The long-term external precision of 183W/184WN6/4 was 6.0 ppm for thin filaments (n = 11), and 6.5 ppm for thick filaments (n = 13).
The internal precisions of interspersed 300 ng, 500 ng, and 1000 ng Alfa Aesar W standards were similar (~4–5 ppm 2 standard error of the mean (SE) for 182W/184WN6/4) when the same signal intensity (~1 V on 184W) was achieved for 600 integrations (Fig. 5). However, only 1000 ng W standards measured on thin Re ribbon achieved much greater than ~1 V on 184W, and correspondingly better internal precision (~3 ppm 2SE for 182W/184WN6/4). The best internal precisions (average 2SE of 3.6 ppm) for 182W/184W were achieved by using 186W/183W for mass bias corrections. By contrast, the average of internal precisions of 182W/184W mass bias corrected using 186W/184W was 4.7 ppm 2SE. For 183W/184W mass bias corrected using 186W/184W, the average internal precision was 4.2 ppm 2SE.
Fig. 5.
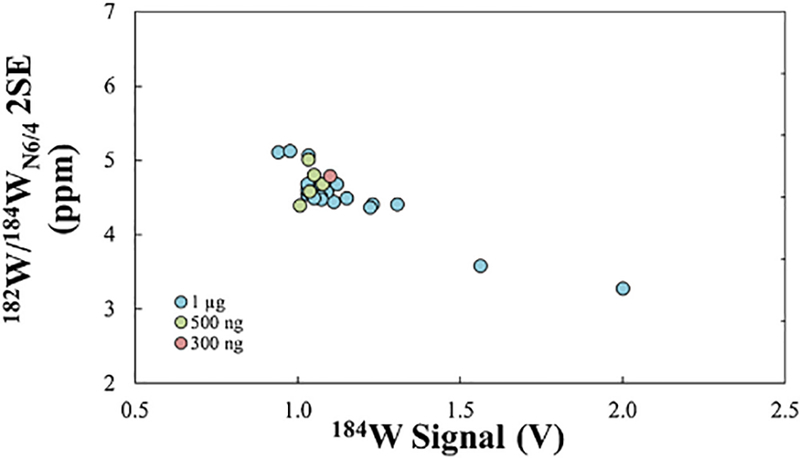
Average 184W signal (volts) during analyses vs. the internal precision (2SE) for 182W/184W (normalized to 186W/184W) of 26 analyses of 300ng–1000 ng Alfa Aesar W standards that were measured for 600 integrations. Analyses of both thick and thin filaments are included. Analyses that were measured for fewer than 600 integrations are not included.
3.3. Measurements with high Re signals
Ref. [1] reported correlations between Re/W signals, 182W/184W, and oxygen isotopic compositions. Because that study used the oxygen isotopic composition of atmosphere reported by [15] to calculate 17O/16O from measured 18O/16O, corrections for species incorporating 17O were too low, as the [15] isotopic composition deviates negatively in 17O/16O from the oxygen isotopic compositions measured during N-TIMS analyses and reported here (Fig. 1). Thus, the interference corrections for 187Re17O16O2 on 186W18O16O2 (which [1] used to determine 18O/16O and then calculate 17O/16O) were too low. In this study, the use of more accurate 17O/16O removes this bias, and a correlation between Re/W signals and 182W/184W is not observed (Fig. 6).
Fig. 6.
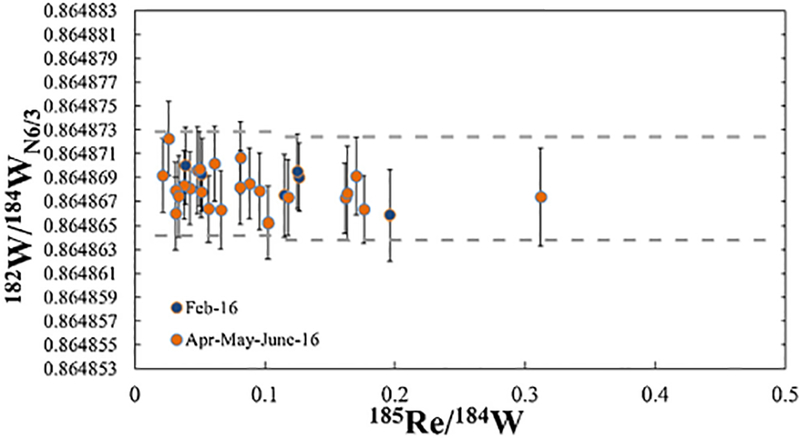
Mean 185Re/184W (for each measurement) vs. 182W/184W (normalized to 186W/183W) for 30 analyses of 300ng–1000 ng Alfa Aesar W standards. Grey dashed lines mark 5 ppm from the mean. Error bars represent 2SE internal precisions.
3.4. Correlation of mass bias corrected ratios
Within the standards data reported by this study, a correlation exists between 182W/184WN6/4 and 183W/184WN6/4 (Fig. 7). A linear regression through the 30 measured standards using ISO-PLOT [24] has a slope of 1.41 ± 0.53 (2σ) and a mean square weighted deviation (MSWD) of 0.5. Ref. [1] also observed a correlated drift in 182W/184WN6/4 and 183W/184WN6/4 over a 9 month period. Among other possibilities, they stated that this could be the result of Faraday cup degradation over time. Because of the correlated, pronounced shift in 182W/184WN6/4 and 183W/184WN6/4 after cup maintenance, we conclude that the most likely cause of the correlated shift is Faraday cup degradation.
Fig. 7.
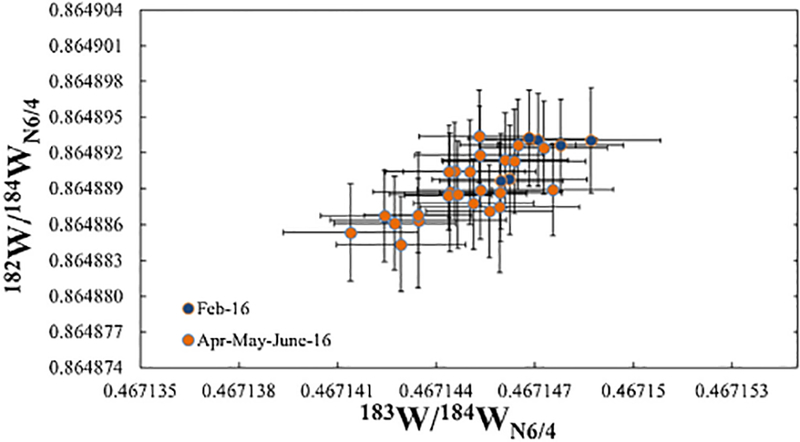
183W/184WN6/4 vs. 182W/184WN6/4 for 30 analyses of 300ng–1000 ng Alfa Aesar W standards. Error bars represent 2SE internal precisions.
3.5. Measurement of natural samples
The measurement of natural samples with previously reported 182W/184W and 183W/184W provides a means to assess the accuracy of this analytical method. Ref. [5] reported that the 182W/184W and 183W/184W of group IVB iron meteorite Skookum, measured using a multi collector-inductively coupled plasma mass spectrometer (MC-ICP-MS), were well resolved from terrestrial standards (Fig. 8). Isotopic deviations of samples from standards here are described in μ units, where μxW is the isotopic deviation in parts per million of xW/184W from a terrestrial standard. The μ182W6/4 (−334.8 ± 5.7 2SD) and μ183W6/4 (12.7 ± 6.6 2SD) of Skookum reported here is identical, within uncertainty, to one of two W isotopic compositions for the sample (μ182W6/4 = −330 ± 4 2SE, and μ183W6/4 = 13 ± 4 2SE) reported by [5]. Further, the precision reported here is for a single measurement and is defined as the 2SD long-term external precision of standards analyzed during this study. By contrast, the precision reported by [5] represents the 2SE (n = 5) of repeated measurements. Thus, the datum reported here illustrates the accuracy and precision of single measurements using this new analytical method.
4. Conclusions
We have refined recently reported N-TIMS techniques [14,1] to measure WO3− and determine 182W/184W and 183W/184W to high-precision. Most significantly, this technique makes more accurate first-order and per-integration oxide corrections to primary xWO3− signals by (i) utilizing updated values for 17O/16O and 18O/16O for first-order corrections, (ii) measuring 18O/16O for both WO3− and ReO3−, and (iii) using a new oxide mass fractionation line to calculate per-integration 17O/16O from measured 18O/16O. The long-term external precisions for 182W/184WN6/4, 182W/184WN6/3, and 183W/184WN6/4 are 5.7 ppm, 3.7 ppm, and 6.6 ppm, respectively. This level of precision is ~2–3 x better for single measurements than the most recently reported N-TIMS method for measuring both 182W/184W and 183W/184W [1]. We have demonstrated that this method is capable of producing accurate and precise data for natural samples by using this method to measure a group IVB iron meteorite, and comparing the datum to previously reported data for this sample [5].
Acknowledgements
This work was supported by NASA Cosmochemistry grant NNX13AF83G. We would like to thank Anne Trinquier and Nick Sharp for analytical advice and helpful discussions. We would also like to thank James Farquhar and Ed Young for providing insights into oxygen isotope fractionation. Igor Puchtel and Mathieu Touboul are thanked for their help in the lab. Two anonymous reviewers provided feedback, and helped improve the quality of the manuscript. We thank our editor, Perdita Barran.
References
- [1].Trinquier A, Touboul M, Walker RJ, High-precision tungsten isotopic analysis by multicollection negative thermal ionization mass spectrometry based on simultaneous measurement of W and 18O/16O isotope ratios for accurate fractionation correction, Anal. Chem 88 (2016) 1542–1546. [DOI] [PubMed] [Google Scholar]
- [2].Vockenhuber C, Oberli F, Bichler M, Ahmad I, Quitté G, Meier M, Halliday AN, Lee DC, Kutschera W, Steier P, Gehrke RJ, Helmer RG, New half-life measurement of 182Hf: improved chronometer for the early solar system, Phys. Rev. Lett 93 (2004) 172501. [DOI] [PubMed] [Google Scholar]
- [3].Lee DC, Halliday AN, Hafnium–tungsten chronometry and the timing of terrestrial core formation, Nature 378 (1995) 771–774. [Google Scholar]
- [4].Harper CL, Jacobsen SB, Evidence for 182Hf in the early Solar System and constraints on the timescale of terrestrial accretion and core formation, Geochim. Cosmochim. Acta 60 (1996) 1131–1153. [Google Scholar]
- [5].Kruijer TS, Touboul M, Fischer-Godde M, Bermingham KR, Walker RJ, Kleine T, Protracted core formation and rapid accretion of protoplanets, Science 344 (2014) 1150–1154. [DOI] [PubMed] [Google Scholar]
- [6].Kleine T, Touboul M, Van Orman JA, Bourdon B, Maden C, Mezger K, Halliday A, Hf–W thermochronometry: closure temperature and constraints on the accretion and cooling history of the H chondrite parent body, Earth Planet. Sci. Lett 270 (2008) 106–118. [Google Scholar]
- [7].Kruijer TS, Kleine T, Fischer-Gödde M, Burkhardt C, Wieler R, Nucleosynthetic W isotope anomalies and the Hf-W chronometry of Ca-Al-rich inclusions, Earth Planet. Sci. Lett 403 (2014) 317–327. [Google Scholar]
- [8].Budde G, Kleine T, Kruijer TS, Burkhardt C, Metzler K, Tungsten isotopic constraints on the age and origin of chondrules, Proc. Natl. Acad. Sci. U. S. A 113 (2016) 2886–2891. [DOI] [PMC free article] [PubMed] [Google Scholar]
- [9].Willbold M, Elliott T, Moorbath S, The tungsten isotopic composition of the Earth’s mantle before the terminal bombardment, Nature 477 (2011) 195–198. [DOI] [PubMed] [Google Scholar]
- [10].Willbold M, Mojzsis SJ, Chen H-W, Elliott T, Tungsten isotope composition of the Acasta Gneiss complex, Earth Planet. Sci. Lett 419 (2015) 168–177. [Google Scholar]
- [11].Touboul M, Puchtel IS, Walker RJ, 182W evidence for long-term preservation of early mantle differentiation products, Science 335 (2012) 1065–1069. [DOI] [PubMed] [Google Scholar]
- [12].Touboul M, Liu J, O’Neil J, Puchtel IS, Walker RJ, New insights into the Hadean mantle revealed by 182Wand highly siderophile element abundances of supracrustal rocks from the Nuvvuagittuq Greenstone Belt Quebec, Canada, Chem. Geol 383 (2014) 63–75. [Google Scholar]
- [13].Liu J, Touboul M, Ishikawa A, Walker RJ, Pearson DG, Widespread tungsten isotope anomalies and W mobility in crustal and mantle rocks of the Eoarchean Saglek Block, northern Labrador, Canada : Implications for early Earth processes and W recycling, Earth Planet. Sci. Lett 448 (2016) 12–23. [Google Scholar]
- [14].Touboul M, Walker RJ, High precision measurement of tungsten isotopes by thermal ionization mass spectrometry, Int. J. Mass Spectrom 309 (2012) 109–117. [Google Scholar]
- [15].Nier AO, A redetermination of the relative abundances of the isotopes of carbon, nitrogen, oxygen, argon, and potassium, Phys. Rev 77 (1950) 789–793. [Google Scholar]
- [16].Clayton RN, Oxygen isotopes in meteorites, Ann. Rev. Earth Planet. Sci 21 (1993) 115–149. [Google Scholar]
- [17].Yin QZ, N-TIMS Technique for the Re-Os and Ru Isotopic Systems and Its Application to Selected Geochemical and Cosmochemical Problems. PhD Thesis, University of Mainz and Max Planck Institute for Chemistry, 1995. [Google Scholar]
- [18].Völkening J, Köppe M, Heumann KG, Tungsten isotope ratio determinations by negative thermal ionization mass spectrometry, Int. J. Mass Spectrom. Ion Processes 107 (1991) 361–368. [Google Scholar]
- [19].Russell WA, Papanastassiou DA, Tombrello TA, Ca isotope fractionation in the Earth and other solar system materials, Geochim. Cosmochim. Acta 42 (1978) 1075–1090. [Google Scholar]
- [20].Bermingham KR, Walker RJ, Worsham EA, Refinement of high precision Ru isotope analysis using negative thermal ionization mass spectrometry, Int. J. Mass Spectrom 403 (2016) 15–26. [DOI] [PMC free article] [PubMed] [Google Scholar]
- [21].Worsham EA, Walker RJ, Bermingham KR, High-precision molybdenum isotope analysis by negative thermal ionization mass spectrometry, Int. J. Mass Spectrom 407 (2016) 51–61. [DOI] [PMC free article] [PubMed] [Google Scholar]
- [22].Chu Z-Y, Li C-F, Chen Z, Xu J-J, Di Y-K, Guo J-H, High-precision measurement of 186Os/188Os and 187Os/188Os: isobaric oxide corrections with in-run measured oxygen isotope ratios, Anal. Chem 87 (2015) 8765–8771. [DOI] [PubMed] [Google Scholar]
- [23].Nagai Y, Yokoyama T, Molybdenum isotopic analysis by negative thermal ionization mass spectrometry (N-TIMS): Effects on oxygen isotopic composition, J. Anal. At. Spectrom 29 (2016) 1090–1096. [Google Scholar]
- [24].Ludwig KR, Users Manual for Isoplot/Ex Version 2 47. A Geochronological Toolkit for Microsoft Excel, Berkeley Geochronology Center Special Publication 1a, 2001, pp. 55. [Google Scholar]


