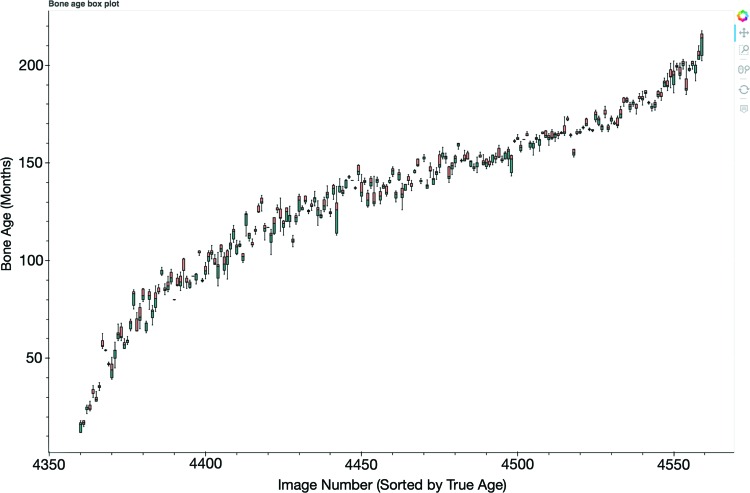
Figure 2:
Box plot shows the five best submissions comparing predicted bone age with ground truth. The x-axis represents the image number from the test data set, and the y-axis represents the bone age predicted by the competitors’ models. A full interactive summary of challenge data and analytics, including this box plot, can be accessed at https://rsnachallenges.cloudapp.net:5006/rsna_interactive.

