Supplemental Digital Content is available in the text.
Keywords: decision tree, emergency medical services, quality-adjusted life years, thrombectomy, transportation
Abstract
Background and Purpose—
Direct transportation to a center with facilities for endovascular treatment might be beneficial for patients with acute ischemic stroke, but it can also cause harm by delay of intravenous treatment. Our aim was to determine the optimal prehospital transportation strategy for individual patients and to assess which factors influence this decision.
Methods—
We constructed a decision tree model to compare outcome of ischemic stroke patients after transportation to a primary stroke center versus a more distant intervention center. The optimal strategy was estimated based on individual patient characteristics, geographic location, and workflow times. In the base case scenario, the primary stroke center was located at 20 minutes and the intervention center at 45 minutes. Additional sensitivity analyses included an urban scenario (10 versus 20 minutes) and a rural scenario (30 versus 90 minutes).
Results—
Direct transportation to the intervention center led to better outcomes in the base case scenario when the likelihood of a large vessel occlusion as a cause of the ischemic stroke was >33%. With a high likelihood of large vessel occlusion (66%, comparable with a Rapid Arterial Occlusion Evaluation score of 5 or above), the benefit of direct transportation to the intervention center was 0.10 quality-adjusted life years (=36 days in full health). In the urban scenario, direct transportation to an intervention center was beneficial when the risk of large vessel occlusion was 24% or higher. In the rural scenario, this threshold was 49%. Other factors influencing the decision included door-to-needle times, door-to-groin times, and the door-in-door-out time.
Conclusions—
The preferred prehospital transportation strategy for suspected stroke patients depends mainly on the likelihood of large vessel occlusion, driving times, and in-hospital workflow times. We constructed a robust model that combines these characteristics and can be used to personalize prehospital triage, especially in more remote areas.
Interhospital transfer for endovascular treatment (EVT) of patients with acute ischemic stroke because of an intracranial large vessel occlusion (LVO) is one of the major causes of treatment delay.1–5 Delay of EVT is associated with poor functional outcome.6,7 Early identification of patients eligible for EVT followed by direct transportation to an endovascular-capable center might reduce transfer-related delay and thereby improve outcome. For this purpose, several prehospital stroke scales have been developed to identify patients who are at high risk of having an intracranial LVO based on their clinical symptoms. Currently, there is no evidence on superiority of one of these scales and more prospective validation in the prehospital setting is needed to reliable assess their accuracy.8,9
Other factors that might be of importance for the prehospital triage of suspected stroke patients include the prognosis of an individual patient and the expected benefit of EVT. Especially because of the large majority of ischemic stroke patients is not eligible for EVT and only benefits from rapid treatment with intravenous thrombolytics (IVT), the harm of delaying IVT should be taken into account as well. The time-dependent effect of both treatments requires a tradeoff between reducing delay of IVT by transportation to the nearest primary stroke center and avoiding transfer-related delay of EVT by direct transportation to an endovascular-capable intervention center.
Our aim was to determine the optimal prehospital transportation strategy for individual patients with suspected ischemic stroke and to assess which factors influence this decision.
Methods
Decision Model
We constructed a decision tree model to compare outcome of patients with ischemic stroke after 2 different prehospital strategies: transportation to the nearest primary stroke center versus direct transportation to a more distant intervention center (Figure 1). The outcome of each strategy was estimated based on individual patient characteristics, geographic location, and treatment times. We combined a short-run model including 3 months outcome data from randomized controlled trials and a long-run Markov model that simulated 40 annual cycles. The benefit of direct transportation to the intervention center was defined as the average amount of quality-adjusted life years (QALYs) gained by this strategy. We considered a difference of >0.02 QALYs (=1 week in full health) to be clinically relevant.
Figure 1.
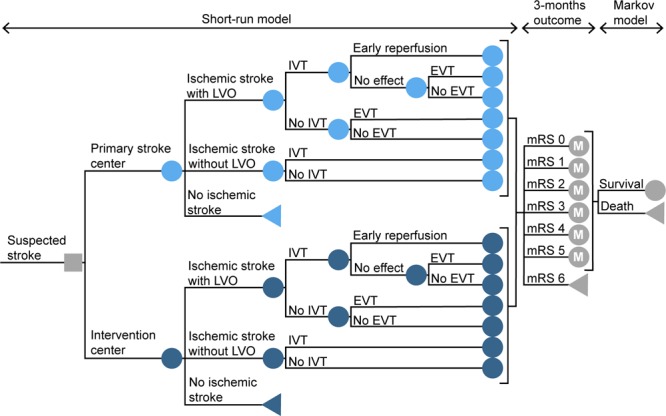
Schematic overview of the model structure. The model starts with the initial decision of transportation to the primary stroke center or to the nearest endovascular-capable intervention center. The short-run model calculates the probability of every possible pathway and the associated distribution of the modified Rankin Scale (mRS) score after 3 mo. It takes into account driving times, in-hospital workflow characteristics, and time-dependent treatment effects. In each annual cycle of the following Markov model, patients can remain in the same health state or die. These probabilities are based on the age and sex-dependent annual mortality rates, adjusted for previously reported death hazard rate ratios of stroke patients. The decision node is represented with a square. The circles represent chance nodes, the circles marked with an M represent Markov models and the triangles represent terminal nodes. EVT indicates endovascular treatment; IVT, treatment with intravenous thrombolytics; and LVO, large vessel occlusion.
Our study did not need approval by an ethics committee because we did not use individual patient data. Analytic methods and study materials that support the findings of this study are available from the corresponding author on reasonable request.
Model Parameters
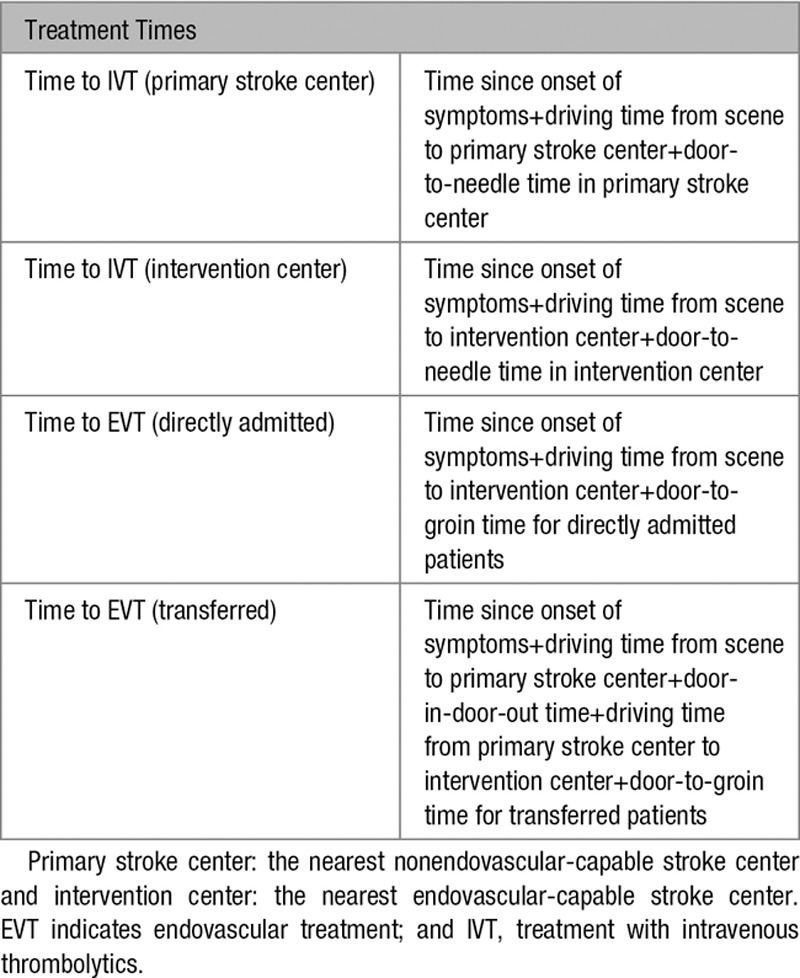
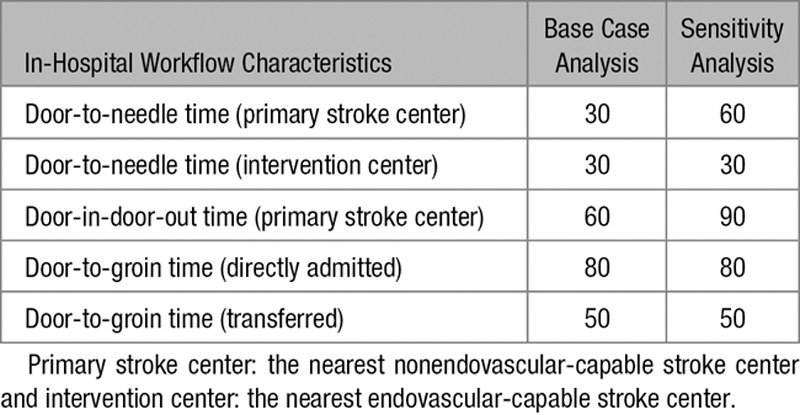
Individual input parameters consisted of age, sex, time since symptom onset, likelihood of LVO, driving time from scene to the primary stroke center, driving time from scene to the intervention center, and driving time between the primary stroke center and the intervention center. The base case used in our analyses was a 68-year old man with suspected stroke symptoms since 1 hour and an average risk of 30% to have an LVO causing the ischemic stroke. The nearest primary stroke center in the base case scenario was located at a 20 minutes drive by ambulance, while the intervention center was located at 45 minutes. Driving time between the centers was 35 minutes. Total time to treatment was calculated based on the driving times and in-hospital workflow characteristics (Tables 1 through 3). These parameters were varied in several sensitivity analyses.
Table 1.
Driving Times Used in the Various Analyses, in Minutes
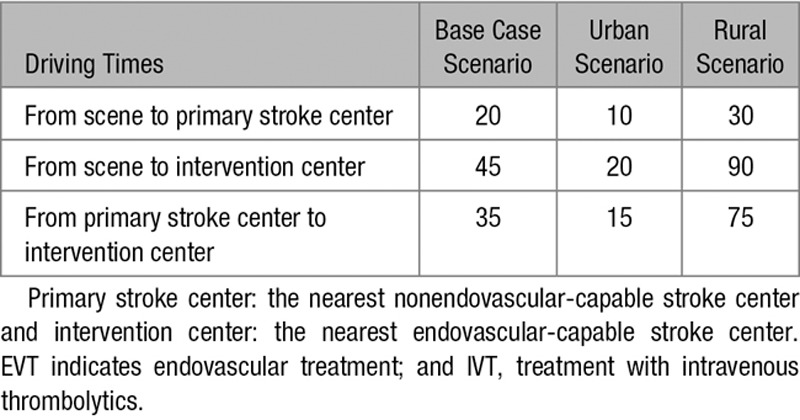
Table 3.
Calculations of Treatment Times in the Model, in Minutes
Other model parameters were estimated based on previous literature and expert opinion of 2 neurovascular specialists (Drs Dippel and Roozenbeek; Table I in the online-only Data Supplement). The β coefficients of treatment effect and time-dependent decline of treatment effect were estimated with an ordinal logistic regression model using previously reported outcome distributions of treated patients and control patients in different time intervals.6,10 The effect of the uncertainty around these estimates was assessed with a probabilistic sensitivity analysis.
Likelihood of LVO
We modeled the entire range from 0% to 100% likelihood of having an LVO as a cause of the ischemic stroke, and we calculated the threshold at which direct transportation to the intervention center would be beneficial. The average prevalence of LVO ranges mostly between 20% and 40% in different populations of ischemic stroke patients,11 but prehospital stroke scales can be used in individual patients to distinguish between lower and higher risk. To illustrate this, we calculated the likelihood of LVO in case of a positive test (positive predictive value) and in case of a negative test (1 minus the negative predictive value) for the Los Angeles Motor Scale, the Rapid Arterial Occlusion Evaluation, and the 3-Item Stroke Scale using the pooled sensitivity and specificity rates reported in a previous meta-analysis (Table 4).8 In the sensitivity analyses, we used the Rapid Arterial Occlusion Evaluation scale for examples of low risk (14%) and high risk (66%).
Table 4.
Likelihood of LVO Based on Several Prehospital Stroke Scales

Outcome Measures
The primary outcome of the short-run model was the distribution of modified Rankin Scale (mRS) scores after 3 months. The mRS is a 7-point scale to assess functional outcome and disability and ranges from 0 (no symptoms) to 6 (death). The outcome distributions of untreated ischemic stroke patients with and without an LVO were based on the control groups of previously reported randomized clinical trials (Figure I in the online-only Data Supplement).10,12 These distributions were shifted for different outcomes based on the estimated treatment effect. To do so, we first transformed the probabilities of each of the baseline mRS scores to the log-odds scale, using the formula log-odds(p) =log(p/(1−p)). We then adjusted these log-odds for the effect of IVT and EVT by adding the β coefficient (=log odds ratio) for the treatment effect at time 0 minus the decline in treatment effect over time (Tables 5 and 6). The adjusted log-odds were then converted back to probabilities using the inverse logit function: p(log-odds) =1/(1+exp(−log-odds)). This resulted in the adjusted mRS distributions for treated patients.
Table 5.
Calculations of Treatment Effect in the Model
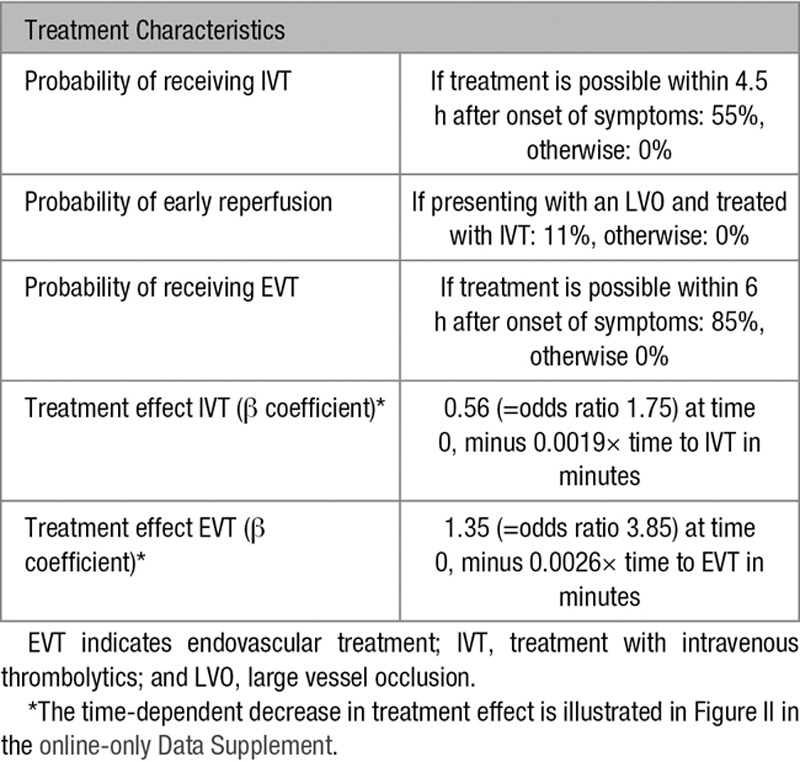
Table 6.
Calculations of Outcome in the Model
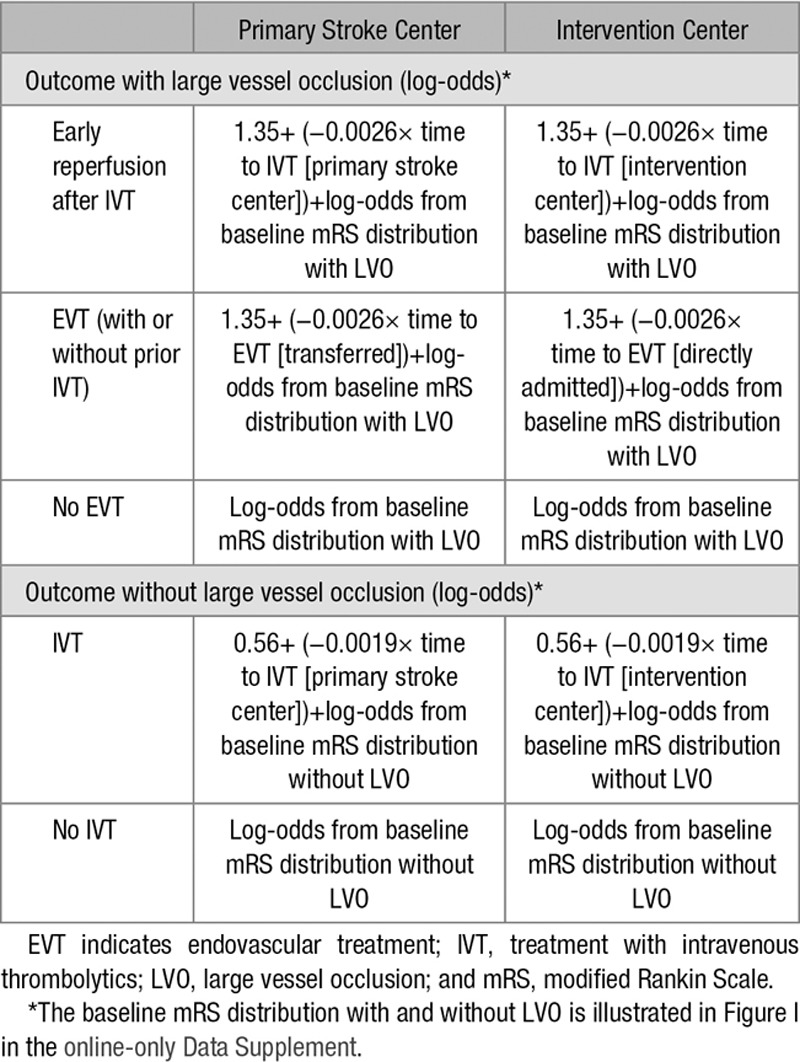
All mRS scores were considered to be separate health states with an associated utility score to calculate the average amount of QALYs per strategy. This is a commonly used measure to assess both the length and the quality of life.13 Utility scores represent the quality of life, and range from 1 (perfect quality of life) to 0 (death), or lower for states considered worse than death. We used previously reported utility scores for ischemic stroke patients: 0.95 for mRS score of 0; 0.93 for mRS score of 1; 0.83 for mRS score of 2; 0.62 for mRS score of 3; 0.42 for mRS score of 4; and 0.11 for mRS score of 5.14 The average life expectancy was calculated for every mRS category with a long-run Markov model that simulated 40 annual cycles. Age and sex-dependent annual mortality rates were adjusted for previously reported death hazard rate ratios of stroke patients (Table I in the online-only Data Supplement).15 Life years were discounted with 3% per year. We calculated the total number of QALYs by multiplying the utility scores of each mRS category with the corresponding life expectancy in years.
Model Assumptions
The model was used for scenarios in which the nearest hospital is not an intervention center because there has to be decisional uncertainty about the optimal transportation strategy. Outcome was modeled for patients with ischemic stroke only, disregarding other diagnoses. A substantial proportion of all patients suspected of ischemic stroke has an intracerebral hemorrhage, a transient ischemic attack or a stroke-mimic, but we assumed the outcome of these patients to be unrelated to the transportation strategy. Because our analyses concerned the tradeoff between IVT and EVT, we did not consider patients presenting >4.5 hours after onset of symptoms.
We assumed that IVT could be given within 4.5 hours after onset of symptoms and EVT within 6 hours after onset. We modeled the decrease in treatment effect of IVT and EVT consistently over time and similar for all patients. Because large pooled analyses showed no significant interaction between age or sex and treatment effect, we did not include age- or sex-specific treatment effects in our model.12,16 The relative treatment effect of IVT was not influenced by stroke severity, which implies a smaller absolute treatment effect for patients with a more severe stroke. The importance of these model assumptions was assessed in several sensitivity analyses.
Sensitivity Analyses
In addition to the base case scenario, we also assessed examples of an urban scenario (10 minutes from scene to primary stroke center; 20 minutes from scene to intervention center; and 15 minutes intercenter driving time) and a more rural scenario (30, 90, and 75 minutes, respectively). We used a Tornado-analysis to explore the relative importance of the model parameters, by varying each parameter at a time while the others were held constant. Additional sensitivity analyses were performed with: increased workflow times in the primary stroke center (Table 2), a female patient, a patient with contra-indications for IVT, an absent effect of IVT for patients with an LVO, and utility weights as defined in a study of Chaisinanunkul et al.17
Table 2.
In-Hospital Workflow Characteristics Used in the Various Analyses, in Minutes
We performed a probabilistic sensitivity analysis using second-order Monte-Carlo simulations to assess decisional uncertainty around the model parameters. This involves running the model 10 000 times and calculating the optimal transportation strategy every single time. In each simulation, the estimates of the model parameters were randomly sampled from the prespecified distribution of each parameter (β, (log)normal or triangular; Table I in the online-only Data Supplement). We reported the percentage of simulations in which transportation to the primary stroke center or direct transportation to the intervention center was preferred, and the median benefit of direct transportation to an intervention center with a 95% credible interval.
We constructed an online tool in which input factors and regional workflow times can be adjusted for an individual patient in a specific scenario. We used R statistical software (version 3.4.4) with the dampack package (version 0.0.0.9) and the R Shiny package (version 1.0.5).
Results
Base Case Analysis
Direct transportation to the intervention center was preferred for the 68-year-old man in the base case scenario, with a primary stroke center located at 20 minutes and an intervention center at 45 minutes, when the likelihood of LVO was 34% or above (Figure 2). When the risk of having an LVO was 66%, comparable with a Rapid Arterial Occlusion Evaluation score of 5 or more, the benefit of direct transportation to the intervention center was 0.10 QALYs (=36 days). When the risk of having an LVO was 14%, comparable with a Rapid Arterial Occlusion Evaluation score below 5, transportation to the primary stroke center was preferred with a difference of 0.03 QALYs (=11 days).
Figure 2.
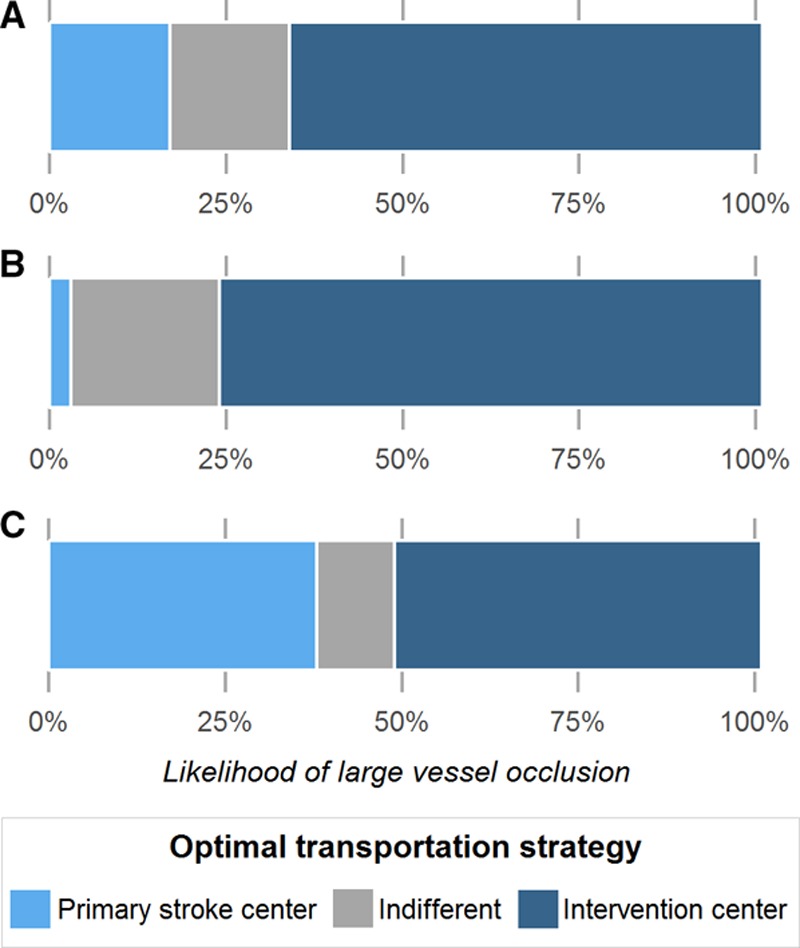
The optimal transportation strategy based on the likelihood of large vessel occlusion. Primary stroke center: the nearest nonendovascular-capable stroke center; intervention center: the nearest endovascular-capable stroke center. A, Represents the base case scenario (primary stroke center at 20 min and intervention center at 45 min); (B) the urban scenario (10 and 20 min, respectively); and (C) the rural scenario (30 and 90 min).
Sensitivity Analyses
In the urban scenario (10 minutes to the primary stroke center and 20 minutes to the intervention center), the threshold for direct transportation to the intervention center was lower than in the base case scenario (24%; Figure 2). In the rural scenario (30 minutes to the primary stroke center and 90 minutes to the intervention center), direct transportation to the intervention center was only preferred for patients with an LVO likelihood of 49% or above.
Other factors that strongly affected the decision threshold in the Tornado-analysis were the in-hospital workflow characteristics (Figure III in the online-only Data Supplement). While remaining the other parameters of the base case constant, transportation to the primary stroke center was beneficial when the door-to-groin time for directly transported patients was above 102 minutes, the door-to-groin time for transferred patients was below 28 minutes, or the door-in-door-out time in the primary stroke center was <38 minutes. Age did not influence the preferred strategy, although it was important for the general prognosis of individual patients.
In the analysis with increased workflow times in the primary stroke center, transportation to the intervention center was more favorable (Figure IV in the online-only Data Supplement). As might be expected, we found that transportation to the primary stroke center was never preferred for a patient with contra-indications for IVT. In all other exploratory sensitivity analyses, the decision threshold remained relatively unchanged.
Probabilistic Sensitivity Analysis
The uncertainty around the estimates of the model parameters caused little decisional uncertainty in the probabilistic sensitivity analysis (Table II in the online-only Data Supplement). When the risk of having an LVO in the base case scenario was high, transportation to the intervention center was associated with a clinically relevant benefit in 94% of the simulations with a median difference of 0.09 QALYs (=33 days in full health, 95% credible interval: 0.00–0.20). When the risk of having an LVO was low, direct transportation to the intervention center was preferred in only 6% of the simulations, with a median difference of −0.03 QALYs (95% credible interval: −0.09 to 0.03).
Online Tool
The effect of simultaneous changes in individual patient characteristics and regional workflow characteristics on the optimal prehospital transportation strategy for individual patients can be further explored by using the online tool at https://mrpredicts.shinyapps.io/triage/ (Figure 3).
Figure 3.
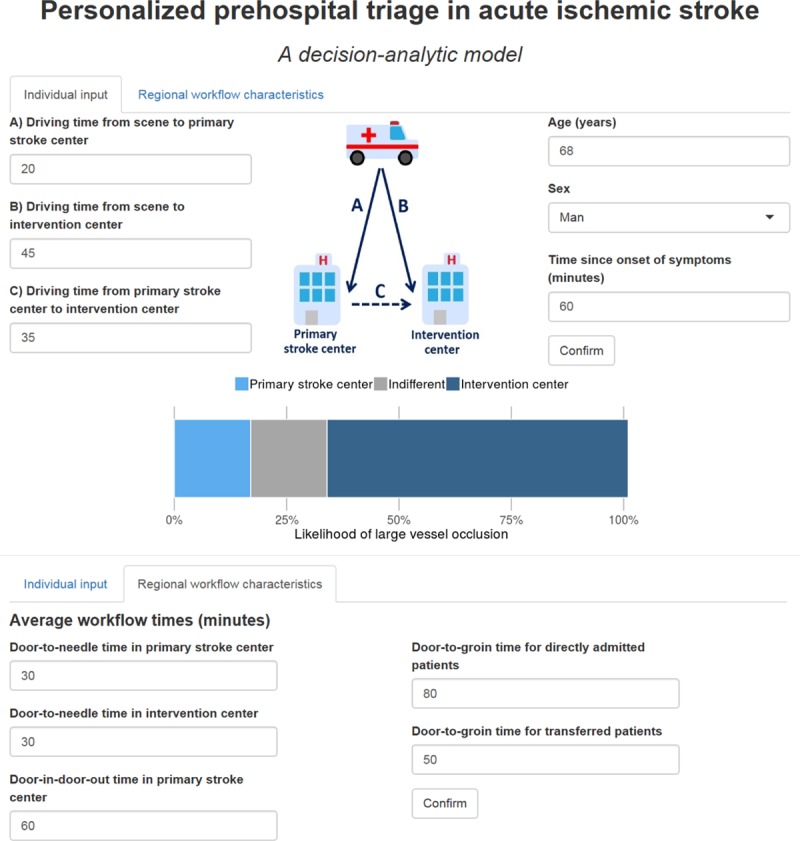
Screenshot of the online tool. This interactive tool can be used at https://mrpredicts.shinyapps.io/triage/. It shows the effect of changes in individual patient characteristics and regional workflow times on the optimal transportation strategy based on the likelihood of large vessel occlusion.
Discussion
Our decision model shows that direct transportation to an intervention center can be beneficial for patients with a high risk of having an LVO, but will likely lead to worse outcomes when the risk is low, especially in scenarios with longer driving times. Combining individual likelihood of LVO and estimated driving times on a case-by-case basis could improve prehospital triage decisions, decrease treatment delay and thereby improve functional outcome of individual patients. In-hospital workflow characteristics such as the door-in-door-out and door-to-groin times have a large effect on the optimal strategy as well. Our online tool allows individual and regional input to inform prehospital triage strategies in different settings.
No single time threshold can be given to optimize triage decisions without considering the probability of being eligible for EVT, as was described by other models.18–21 As a measure for the likelihood of LVO, these models used previously reported cutoffs of one or multiple prehospital stroke scales. However, prospective prehospital validation is required to assess and compare the accuracy of these scales when used by emergency medical services in a broad population of suspected stroke patients.8 The full dependence of these models on insufficiently validated prehospital stroke scales limits the validity of their results. Therefore, we did not depend our model on a specific prehospital stroke scale but assessed the entire range from 0% to 100% likelihood of LVO. Several prehospital stroke scales may be used to estimate this likelihood, preferably after more extensive validation.
Our study also has some limitations. Decision-analytic modeling requires the use of estimated model parameters and multiple assumptions. In extensive sensitivity analyses, we found no substantial decisional uncertainty. Nevertheless, the assumptions we made about the treatment effect of IVT and EVT might have influenced our results. We used reported outcomes and effect sizes of IVT based on studies that did not assess LVO status because randomized trials on the effect of IVT were performed before the introduction of CT angiography as standard of care for acute stroke patients. To calculate a common odds ratio for the decay in effect of IVT, we used mRS distributions at different time points provided by a pooled analysis from 2004.10 A more recent study with a larger sample size only reported odds ratios specific for the cutoff of mRS score of 0 to 1,16 which are not valid to use in shift-analyses of total mRS score. Although the effect of IVT tends to diminish with more proximally located occlusions,22,23 we included a consistent relative treatment effect of IVT in the range of the National Institutes of Health Stroke Scale score of 5 to 22.16 Because the baseline outcome distribution is less favorable for patients with an LVO, the same relative treatment effect will give a smaller absolute effect in LVO stroke. The precise benefit of IVT before EVT is still uncertain because the available studies are flawed by confounding by indication.24,25 The results of ongoing randomized controlled trials comparing EVT and EVT with prior IVT have to provide more insight on this matter.
Outcome of stroke mimics, such as migraine, epilepsy, and conversion disorder, were considered to be independent of time since there are no time-dependent treatment options that would require transportation to the nearest hospital. Patients with an intracerebral hemorrhage might benefit from transportation to a specialized center, but there is currently insufficient evidence to include the effect of rapid treatment in our model. Recent studies showed that EVT can be effective in a subgroup of stroke patients presenting between 6 and 24 hours after onset.26,27 Other factors might be important to optimize triage of these patients and our results, therefore, only apply to patients presenting within 6 hours. Furthermore, we did not include costs in our model. Because the outcome was measured based on functional outcome, we were only able to model harm due to delayed treatment. Inconvenience of unnecessary transportations for patients and their relatives, as well as inefficient resource utilization, was not integrated in the model. It is likely that unnecessary transportation to an intervention center will cause crowding at the emergency department, which might have financial consequences and a negative effect on the in-hospital workflow. It is, therefore, important to further explore the cost-effectiveness of different prehospital triage strategies.
We constructed a decision model that predicts the optimal strategy based on individual patient characteristics and that can easily be adjusted for differences in geographic location or in-hospital workflow characteristics. Our online tool forms the basis of personalized prehospital triage of suspected ischemic stroke patients. Clinicians and researchers can plug in the specific characteristics of their own region into this tool to guide local prehospital triage policies. Although a fixed threshold the likelihood of LVO might be suitable for triage in urbanized regions with small distances between centers, our model showed that a higher threshold should likely be considered in more remote areas. After more extensive validation of the prehospital stroke scales, the tool can be used to combine the individual’s likelihood of LVO with estimated driving and local workflow times to improve prehospital triage decisions on a case-by-case basis. Future integration with a GPS-controlled navigation application will further facilitate personalized triage based on real-time information about driving and local workflow times.
Conclusions
The preferred prehospital transportation strategy for suspected stroke patients depends mainly on the likelihood of LVO, driving times, and in-hospital workflow times. We constructed a robust model that combines these characteristics and can be used to personalize prehospital triage, especially in more remote areas.
Sources of Funding
This study was funded by the Erasmus MC program for Cost-Effectiveness Research.
Disclosures
Dr Lugt of Erasmus MC received funds from Dutch Heart Foundation. Erasmus MC received funds from Serviers and Bracco Imaging for consultations by Dr Dippel. He received compensation for travel costs by Stryker and Medtronic. Dr Dippel also reports research grants from Dutch Heart Foundation, Brain Foundation Netherlands, the Netherlands Organisation for Health Research and Development and Health Holland Top Sector Life Sciences & Health, and unrestricted grants from AngioCare BV, Medtronic/Covidien/EV3, Medac Gmbh/Lamepro, Penumbra Inc, Stryker, Top Medical/Concentric, Thrombolytic Science LLC, and Stryker European Operations BV. The other authors report no conflicts.
Supplementary Material
Footnotes
Guest Editor for this article was Eric E. Smith, MD, MPH.
The online-only Data Supplement is available with this article at https://www.ahajournals.org/doi/suppl/10.1161/STROKEAHA.118.022562.
References
- 1.Goyal M, Jadhav AP, Bonafe A, Diener H, Mendes Pereira V, Levy E, et al. SWIFT PRIME investigators. Analysis of workflow and time to treatment and the effects on outcome in endovascular treatment of acute ischemic stroke: results from the SWIFT PRIME Randomized Controlled Trial. Radiology. 2016;279:888–897. doi: 10.1148/radiol.2016160204. doi: 10.1148/radiol.2016160204. [DOI] [PubMed] [Google Scholar]
- 2.Menon BK, Sajobi TT, Zhang Y, Rempel JL, Shuaib A, Thornton J, et al. Analysis of workflow and time to treatment on thrombectomy outcome in the endovascular treatment for small core and proximal occlusion ischemic stroke (ESCAPE) Randomized, Controlled Trial. Circulation. 2016;133:2279–2286. doi: 10.1161/CIRCULATIONAHA.115.019983. doi: 10.1161/CIRCULATIONAHA.115.019983. [DOI] [PubMed] [Google Scholar]
- 3.Menon BK, Almekhlafi MA, Pereira VM, Gralla J, Bonafe A, Davalos A, et al. STAR Study Investigators. Optimal workflow and process-based performance measures for endovascular therapy in acute ischemic stroke: analysis of the Solitaire FR thrombectomy for acute revascularization study. Stroke. 2014;45:2024–2029. doi: 10.1161/STROKEAHA.114.005050. doi: 10.1161/STROKEAHA.114.005050. [DOI] [PubMed] [Google Scholar]
- 4.Venema E, Boodt N, Berkhemer OA, Rood PPM, van Zwam WH, van Oostenbrugge RJ, et al. MR CLEAN investigators. Workflow and factors associated with delay in the delivery of intra-arterial treatment for acute ischemic stroke in the MR CLEAN trial. J Neurointerv Surg. 2018;10:424–428. doi: 10.1136/neurintsurg-2017-013198. doi: 10.1136/neurintsurg-2017-013198. [DOI] [PubMed] [Google Scholar]
- 5.Froehler MT, Saver JL, Zaidat OO, Jahan R, Aziz-Sultan MA, Klucznik RP, et al. STRATIS Investigators. Interhospital transfer before thrombectomy is associated with delayed treatment and worse outcome in the STRATIS Registry (Systematic Evaluation of Patients Treated With Neurothrombectomy Devices for Acute Ischemic Stroke). Circulation. 2017;136:2311–2321. doi: 10.1161/CIRCULATIONAHA.117.028920. doi: 10.1161/CIRCULATIONAHA.117.028920. [DOI] [PMC free article] [PubMed] [Google Scholar]
- 6.Saver JL, Goyal M, van der Lugt A, Menon BK, Majoie CB, Dippel DW, et al. HERMES Collaborators. Time to treatment with endovascular thrombectomy and outcomes from ischemic stroke: a meta-analysis. JAMA. 2016;316:1279–1288. doi: 10.1001/jama.2016.13647. doi: 10.1001/jama.2016.13647. [DOI] [PubMed] [Google Scholar]
- 7.Mulder MJHL, Jansen IGH, Goldhoorn RB, Venema E, Chalos V, Compagne KCJ, et al. MR CLEAN Registry Investigators. Time to endovascular treatment and outcome in acute ischemic stroke: MR CLEAN Registry results. Circulation. 2018;138:232–240. doi: 10.1161/CIRCULATIONAHA.117.032600. doi: 10.1161/CIRCULATIONAHA.117.032600. [DOI] [PubMed] [Google Scholar]
- 8.Smith EE, Kent DM, Bulsara KR, Leung LY, Lichtman JH, Reeves MJ, et al. American Heart Association Stroke Council. Accuracy of prediction instruments for diagnosing large vessel occlusion in individuals with suspected stroke: a systematic review for the 2018 guidelines for the early management of patients with acute ischemic stroke. Stroke. 2018;49:e111–e122. doi: 10.1161/STR.0000000000000160. doi: 10.1161/STR.0000000000000160. [DOI] [PubMed] [Google Scholar]
- 9.Krebs W, Sharkey-Toppen TP, Cheek F, Cortez E, Larrimore A, Keseg D, et al. Prehospital stroke assessment for large vessel occlusions: a systematic review. Prehosp Emerg Care. 2018;22:180–188. doi: 10.1080/10903127.2017.1371263. doi: 10.1080/10903127.2017.1371263. [DOI] [PubMed] [Google Scholar]
- 10.Hacke W, Donnan G, Fieschi C, Kaste M, von Kummer R, Broderick JP, et al. ATLANTIS Trials Investigators; ECASS Trials Investigators; NINDS rt-PA Study Group Investigators. Association of outcome with early stroke treatment: pooled analysis of ATLANTIS, ECASS, and NINDS rt-PA stroke trials. Lancet. 2004;363:768–774. doi: 10.1016/S0140-6736(04)15692-4. doi: 10.1016/S0140-6736(04)15692-4. [DOI] [PubMed] [Google Scholar]
- 11.Lakomkin N, Dhamoon M, Carroll K, Singh IP, Tuhrim S, Lee J, et al. Prevalence of large vessel occlusion in patients presenting with acute ischemic stroke: a 10-year systematic review of the literature. [published online November 10, 2018]. J Neurointerv Surg. 2018 doi: 10.1136/neurintsurg-2018-014239. https://jnis.bmj.com/content/early/2018/11/10/neurintsurg-2018-014239. Accessed November 12, 2018. [DOI] [PubMed] [Google Scholar]
- 12.Goyal M, Menon BK, van Zwam WH, Dippel DW, Mitchell PJ, Demchuk AM, et al. HERMES collaborators. Endovascular thrombectomy after large-vessel ischaemic stroke: a meta-analysis of individual patient data from five randomised trials. Lancet. 2016;387:1723–1731. doi: 10.1016/S0140-6736(16)00163-X. doi: 10.1016/S0140-6736(16)00163-X. [DOI] [PubMed] [Google Scholar]
- 13.Weinstein MC, Stason WB. Foundations of cost-effectiveness analysis for health and medical practices. N Engl J Med. 1977;296:716–721. doi: 10.1056/NEJM197703312961304. doi: 10.1056/NEJM197703312961304. [DOI] [PubMed] [Google Scholar]
- 14.Dijkland SA, Voormolen DC, Venema E, Roozenbeek B, Polinder S, Haagsma JA, et al. MR CLEAN Investigators. Utility-weighted modified rankin scale as primary outcome in stroke trials: a simulation study. Stroke. 2018;49:965–971. doi: 10.1161/STROKEAHA.117.020194. doi: 10.1161/STROKEAHA.117.020194. [DOI] [PMC free article] [PubMed] [Google Scholar]
- 15.Samsa GP, Reutter RA, Parmigiani G, Ancukiewicz M, Abrahamse P, Lipscomb J, et al. Performing cost-effectiveness analysis by integrating randomized trial data with a comprehensive decision model: application to treatment of acute ischemic stroke. J Clin Epidemiol. 1999;52:259–271. doi: 10.1016/s0895-4356(98)00151-6. [DOI] [PubMed] [Google Scholar]
- 16.Emberson J, Lees KR, Lyden P, Blackwell L, Albers G, Bluhmki E, et al. Stroke Thrombolysis Trialists’ Collaborative Group. Effect of treatment delay, age, and stroke severity on the effects of intravenous thrombolysis with alteplase for acute ischaemic stroke: a meta-analysis of individual patient data from randomised trials. Lancet. 2014;384:1929–1935. doi: 10.1016/S0140-6736(14)60584-5. doi: 10.1016/S0140-6736(14)60584-5. [DOI] [PMC free article] [PubMed] [Google Scholar]
- 17.Chaisinanunkul N, Adeoye O, Lewis RJ, Grotta JC, Broderick J, Jovin TG, et al. DAWN Trial and MOST Trial Steering Committees; Additional contributors from DAWN Trial Steering Committee. Adopting a patient-centered approach to primary outcome analysis of acute stroke trials using a utility-weighted modified Rankin scale. Stroke. 2015;46:2238–2243. doi: 10.1161/STROKEAHA.114.008547. doi: 10.1161/STROKEAHA.114.008547. [DOI] [PMC free article] [PubMed] [Google Scholar]
- 18.Nogueira RG, Silva GS, Lima FO, Yeh YC, Fleming C, Branco D, et al. The fast-ed app: a smartphone platform for the field triage of patients with stroke. Stroke. 2017;48:1278–1284. doi: 10.1161/STROKEAHA.116.016026. [DOI] [PubMed] [Google Scholar]
- 19.Schlemm E, Ebinger M, Nolte CH, Endres M, Schlemm L. Optimal transport destination for ischemic stroke patients with unknown vessel status: use of prehospital triage scores. Stroke. 2017;48:2184–2191. doi: 10.1161/STROKEAHA.117.017281. doi: 10.1161/STROKEAHA.117.017281. [DOI] [PubMed] [Google Scholar]
- 20.Benoit JL, Khatri P, Adeoye OM, Broderick JP, McMullan JT, Scheitz JF, et al. Prehospital triage of acute ischemic stroke patients to an intravenous tPA-ready versus endovascular-ready hospital: a decision analysis. Prehosp Emerg Care. 2018;22:722–733. doi: 10.1080/10903127.2018.1465500. doi: 10.1080/10903127.2018.1465500. [DOI] [PubMed] [Google Scholar]
- 21.Holodinsky JK, Williamson TS, Demchuk AM, Zhao H, Zhu L, Francis MJ, et al. Modeling stroke patient transport for all patients with suspected large-vessel occlusion. JAMA Neurol. 2018;75:1477–1486. doi: 10.1001/jamaneurol.2018.2424. doi: 10.1001/jamaneurol.2018.2424. [DOI] [PMC free article] [PubMed] [Google Scholar]
- 22.del Zoppo GJ, Poeck K, Pessin MS, Wolpert SM, Furlan AJ, Ferbert A, et al. Recombinant tissue plasminogen activator in acute thrombotic and embolic stroke. Ann Neurol. 1992;32:78–86. doi: 10.1002/ana.410320113. doi: 10.1002/ana.410320113. [DOI] [PubMed] [Google Scholar]
- 23.Demchuk AM, Goyal M, Yeatts SD, Carrozzella J, Foster LD, Qazi E, et al. IMS III Investigators. Recanalization and clinical outcome of occlusion sites at baseline CT angiography in the Interventional Management of Stroke III trial. Radiology. 2014;273:202–210. doi: 10.1148/radiol.14132649. doi: 10.1148/radiol.14132649. [DOI] [PMC free article] [PubMed] [Google Scholar]
- 24.Mistry EA, Mistry AM, Nakawah MO, Chitale RV, James RF, Volpi JJ, et al. Mechanical thrombectomy outcomes with and without intravenous thrombolysis in stroke patients: a meta-analysis. Stroke. 2017;48:2450–2456. doi: 10.1161/STROKEAHA.117.017320. doi: 10.1161/STROKEAHA.117.017320. [DOI] [PubMed] [Google Scholar]
- 25.Kaesmacher J, Mordasini P, Arnold M, Lopez-Cancio E, Cerda N, Boeckh-Behrens T, et al. Direct mechanical thrombectomy in tPA-ineligible and -eligible patients versus the bridging approach: A meta-analysis. J Neurointerv Surg. 2019;11:20–27. doi: 10.1136/neurintsurg-2018-013834. doi: 10.1136/neurintsurg-2018-013834. [DOI] [PMC free article] [PubMed] [Google Scholar]
- 26.Nogueira RG, Jadhav AP, Haussen DC, Bonafe A, Budzik RF, Bhuva P, et al. DAWN Trial Investigators. Thrombectomy 6 to 24 hours after stroke with a mismatch between deficit and infarct. N Engl J Med. 2018;378:11–21. doi: 10.1056/NEJMoa1706442. doi: 10.1056/NEJMoa1706442. [DOI] [PubMed] [Google Scholar]
- 27.Albers GW, Marks MP, Kemp S, Christensen S, Tsai JP, Ortega-Gutierrez S, et al. DEFUSE 3 Investigators. Thrombectomy for stroke at 6 to 16 hours with selection by perfusion imaging. N Engl J Med. 2018;378:708–718. doi: 10.1056/NEJMoa1713973. doi: 10.1056/NEJMoa1713973. [DOI] [PMC free article] [PubMed] [Google Scholar]


