Abstract
Electrophilic nitro-fatty acids [NO2-FAs (fatty acid nitroalkenes)] showed beneficial signaling actions in preclinical studies and safety in phase 1 clinical trials. A detailed description of the pharmacokinetics (PK) of NO2-FAs is complicated by the capability of electrophilic fatty acids to alkylate thiols reversibly and become esterified in various complex lipids, and the instability of the nitroalkene moiety during enzymatic and base hydrolysis. Herein, we report the mechanism and kinetics of absorption, metabolism, and distribution of the endogenously detectable and prototypical NO2-FA, 10-nitro-oleic acid (10-NO2-OA), in dogs after oral administration. Supported by HPLC-high-resolution-MS/MS analysis of synthetic and plasma-derived 10-NO2-OA-containing triacylglycerides (TAGs), we show that a key mechanism of NO2-FA distribution is an initial esterification into complex lipids. Quantitative analysis of plasma free and esterified lipid fractions confirmed time-dependent preferential incorporation of 10-NO2-OA into TAGs when compared with its principal metabolite, 10-nitro-stearic acid. Finally, new isomers of 10-NO2-OA were identified in vivo, and their electrophilic reactivity and metabolism characterized. Overall, we reveal that NO2-FAs display unique PK, with the principal mechanism of tissue distribution involving complex lipid esterification, which serves to shield the electrophilic character of this mediator from plasma and hepatic inactivation and thus permits efficient distribution to target organs.
Keywords: pharmacokinetics, triglyceride, nitro-fatty acids, mass spectrometry, nitro-oleic acid
The knowledge of absorption, distribution, metabolism, and excretion (ADME) of new drug candidates is important for safe and insightful development. The rate of drug development failures attributable to ADME deficiencies exceeds 40% and, even after new drug approval, many drugs still display ADME problems. Notably, “a chemical cannot be a drug, no matter how active nor how specific its action, unless it is also taken appropriately into the body (absorption), distributed to the right parts of the body, metabolized in a way that does not instantly remove its activity, and eliminated in a suitable manner” (Ref. 1; p. 722). As a covalently acting endogenous mediator and a class of new drug candidates, electrophilic nitro-fatty acids [NO2-FAs (fatty acid nitroalkenes)] have displayed beneficial effects in preclinical animal models of metabolic and inflammatory disease (2–7). A synthetic homolog of a NO2-FA detected in plants and mammals (8, 9), (E)-10-nitro-octadec-9-enoic acid [10-nitro-oleic acid (10-NO2-OA)], is now in phase 2 clinical trials for treating focal segmental glomerulosclerosis and will soon begin trials in pulmonary arterial hypertension and obese asthmatics.
NO2-FAs are generated during inflammation and digestion by reactions between unsaturated fatty acids and the nitric oxide (•NO)- and nitrite (NO2−)-derived nitrating species, nitrogen dioxide (•NO2) (10). Endogenous formation of NO2-FAs can be promoted by: a) oxidative inflammatory reactions, such as inflammatory cell activation and myocardial ischemia/reperfusion (2, 5); and b) dietary supplementation of conjugated linoleic acid and NO2− or nitrate (NO3−) (11). In the absence of metabolic or inflammatory stimuli, plasma and urinary NO2-FAs are normally present at ∼1–3 and ∼10 nM concentrations in humans, respectively (9, 11–13). Administration of NO2-FAs has shown pharmacologic benefits in animal models of atrial fibrosis (3), pulmonary hypertension (6), inflammatory bowel disease (7), adriamycin-induced nephropathy (14), cardiac ischemia/reperfusion (2), cutaneous inflammation (4), and abdominal wall defect (15), among others. The signaling actions of NO2-FAs are attributed to the reversible Michael addition reaction between the electrophilic carbon β of the vinyl nitro substituent and protein cysteine thiolates, thereby modulating adaptive gene expression and enzymatic activities (16). For example, NO2-FAs have been shown to activate Nrf2, PPARγ, and heat shock factor-1-dependent gene expression, and inhibit NF-kB-dependent pro-inflammatory gene expression and directly inhibit enzymes, such as soluble epoxide hydrolase and xanthine oxidoreductase (17–22).
Despite advances in understanding NO2-FA pharmacology and encouraging preclinical and clinical responses, a complete pharmacokinetic (PK) profile is still missing, due to challenges associated with the chemical reactivity and complex metabolic pathways of these mediators. For example, the quantitative analysis and characterization of NO2-FA metabolism are complicated by reversible reactions with low molecular weight and protein thiols (23, 24), esterification into complex lipids (25, 26), and inherent instability of the nitroalkene under conditions of enzymatic and base hydrolysis, greatly limiting previous PK evaluations.
Recent studies have shed new light on the ADME of NO2-FAs. Radiotracer analysis of orally administered [14C]10-NO2-OA in rats has shown a long-lasting accumulation of radioactivity in adipose tissue (27, 28). In addition, NO2-FA-containing triacylglycerides (NO2-FA-TAGs) have been characterized in adipocytes and rat plasma after 10-NO2-OA administration (25). A better understanding of NO2-FA distribution and metabolism in supplemented adipocytes and rat adipose tissue was provided by the quantification of both the free acid and esterified 10-NO2-OA (28). These studies confirmed that adipose tissue differentially stores electrophilic NO2-FAs and their nonelectrophilic metabolites into complex lipids, a pool that is mobilized by lipase hydrolysis to be distributed to remote organs.
Dietary fatty acids are normally absorbed by intestinal enterocytes, esterified into TAGs, packaged into chylomicrons, and secreted into the mesenteric lymph duct, to then reach the systemic circulation and the peripheral tissues (29). The incorporation of lipophilic drugs into chylomicron TAGs and their lymphatic distribution protects from first-pass hepatic metabolism and can increase oral bioavailability (30). In this regard, a clear understanding of the systemic distribution of NO2-FAs is lacking and relative plasma free versus esterified NO2-FA levels after oral supplementation have yet to be defined.
Herein, we provide new insight into the PK of an exemplary lipid electrophile, 10-NO2-OA. We reveal that the systemic distribution and targeted delivery of orally administered NO2-FA occur as complex lipid esterified species, following esterification and stabilization in triglycerides (TAGs).
MATERIALS AND METHODS
Synthesis and spectrophotometric quantitation of (E)-10-nitro-octadec-9-enoic acid (10-NO2-OA), (Z)-10-nitro-octadec-9-enoic acid [(Z)-10-NO2-OA], and the internal standard, (E)-10-nitro[15N]octadec-9-enoic-15,15,16,16-[d4] acid ([15N]O2-[d4]OA), were performed as previously (27, 31, 32). Synthesis of the labeled internal standard, (E)-10-nitro[15N]octadecanoic-15,15,16,16-[d4] acid ([15N]O2-[d4]SA) was performed by reducing [15N]O2-[d4]OA with sodium borohydride. Recombinant human FLAG-tagged prostaglandin reductase-1 (PtGR-1) was expressed in HEK-293T cells and purified as described previously (33). All chemicals were purchased from Sigma (St. Louis, MO) unless otherwise stated. Solvents used for extractions and mass spectrometric analyses were from Burdick and Jackson (Muskegon, MI).
Animal study
Male beagle dogs (7 months old, n = 5 per group) were orally administered with 31.25 mg/kg 10-NO2-OA (dissolved in sesame oil) twice a day, about 6 h apart, or with vehicle (sesame oil) for 14 days. Blood samples were collected at 0, 1, 4, 7, 10, 16, and 24 h at 1 and 14 days, centrifuged, and the resultant plasma was stored at −80°C until used. Animal studies were performed in accordance with the Guide for the Care and Use of Laboratory Animals published by the United States National Institutes of Health (National Institutes of Health Publication No.85-23, revised 1996).
Synthesis of 10-NO2-(t8,9)-18:1 standard
Synthesis of 10-nitro-octadec-trans-8-enoic acid [10-NO2-(t8,9)-18:1] was carried out by charging a 25 ml round-bottom flask with 9-acetoxy-10-nitrooctadecanoic ester (193 mg) (32), cesium carbonate (73 mg, one-half equivalent), and benzene (10–15 ml). The solution was refluxed under nitrogen with vigorous stirring under a Dean-Stark trap for azeotropic removal of water for 24 h at 80–90°C. After completion, the solution was cooled to room temperature, partitioned with 5–10 ml of 1 M hydrochloric acid and 10 ml of diethyl ether. After stirring, the mixture was separated and the aqueous fraction extracted three times with 10 ml aliquots of diethyl ether. The organic layers were combined and washed once with water and once with saturated aqueous sodium chloride, and then dried over sodium sulfate. The solution was filtered through a plug of silica gel/Celite and the solvent removed under reduced pressure. The crude product was redissolved in 5 ml phosphate buffer/5 ml methanol with 393 mg l-cysteine (10-fold excess) and stirred for 2 h to remove nitroalkene-cysteine adducts, then quenched with a few drops of acetic acid and extracted three times with ethyl acetate. The organic layers were combined and washed twice with water and twice with saturated aqueous sodium chloride, and dried over sodium sulfate. The final solution was evaporated under reduced pressure and then applied to a flash chromatography column (ethyl acetate-hexanes 0–5%) to yield 96 mg of 10-NO2-(t8,9)-18:1 after de-esterification by standard techniques. Characteristic 1H-NMR signals were observed at δ 4.78 (q, J = 7.7 Hz), 5.54 (dd, J = 15.3, 9.0 Hz), and 5.77 (dt, J = 15.3, 6.7 Hz) ppm.
Synthesis of NO2-FA-containing TAG standards
Synthesis of NO2-FA-TAGs was performed by esterification of the appropriate NO2-FA with 1,2-dipalmitin. In a typical reaction, 66 mg of 10-NO2-OA (0.2 mmol) were charged to a vial along with 50 mg N,N′-dicyclohexylcarbodiimide (0.24 mmol) and a catalytic amount (5 mg) of 4-dimethylaminopyridine, and then dissolved in dichloromethane. The solution was stirred briefly before 114 mg of 1,2-dipalmitin (0.2 mmol) were added and the solvent volume adjusted to 10 ml. The vial was sealed under nitrogen and stirred overnight at room temperature. The final TAG was obtained by filtering off the solids, removing the solvent by rotary evaporation, and purifying the crude product via column chromatography (82 mg, 48% yield). Products were analyzed by 1H-NMR and HPLC-high-resolution (HR)-MS/MS for structural confirmation as previously (25).
Plasma lipid processing
Analysis of nonesterified 10-NO2-OA and metabolites was performed by adding 250 μl of acetonitrile to 50 μl of plasma in the presence of 20 pmol of [15N]O2-[d4]OA and [15N]O2-[d4]SA. Samples were vortexed, centrifuged at 20,000 g for 10 min at 4°C, and the supernatant was analyzed. TAGs were extracted from 20 μl of plasma using the Bligh and Dyer method (34), dried under a stream of nitrogen, and reconstituted in 100 μl of ethyl acetate.
β-Mercaptoethanol reaction with 10-NO2-OA and metabolites
To confirm the electrophilic character of NO2-OA-derived metabolites, acetonitrile-precipitated plasma samples (50 μl) were dried and reacted with β-mercaptoethanol (BME) by adding 100 μl of phosphate buffer (50 mM, pH 7.4)/ acetonitrile (9:1, v/v) in the presence of 500 mM of BME followed by a 90 min incubation at 37°C. Also, 10-NO2-OA, 10-NO2-(t8,9)-18:1, (Z)-10-NO2-OA, and 10-nitro-stearic acid (10-NO2-SA) standards (20 pmol) were spiked with a 10 pmol [15N]O2-[d4]OA and [15N]O2-[d4]SA mix of internal standards, and reaction with BME was performed as above, but with an incubation time of 15 min. Samples were analyzed by HPLC-ESI-MS/MS.
Acid hydrolysis of plasma
Plasma (20 μl) was spiked with 10 pmol of [15N]O2-[d4]OA and [15N]O2-[d4]SA, and acid hydrolysis was performed with minor modifications as previously (28). Samples were incubated with 1 ml of acetonitrile/HCl (9:1, v/v) at room temperature to obtain the free acid levels of NO2-FAs (before hydrolysis condition) and 90°C for 1 h for the total levels of NO2-FAs (after hydrolysis condition). After incubation, 1 ml of 0.5 M phosphate buffer was added and extracted with 2 ml of hexane. Then, samples were vortexed, centrifuged at 1,000 g for 5 min at 4°C, and the hexane phase recovered and dried under a stream of nitrogen. Finally, NO2-FAs were reconstituted in methanol for HPLC-MS/MS analysis. The esterified levels of NO2-FAs were obtained by subtracting the free acid levels (acetonitrile extracts, before hydrolysis) from the total levels (after hydrolysis condition).
Stability and recovery of synthetic 10-NO2-OA, 10-NO2-SA, 10-NO2-(t8,9)-18:1, (Z)-10-NO2-OA, 10-NO2-OA-containing TAG (10-NO2-OA-TAG), and 10-NO2-SA-containing TAG (10-NO2-SA-TAG) standards (30 pmol) were assessed in the presence of 0.5 mg of triolein under the same acidic hydrolysis conditions as above, with the only difference that the internal standard mixture was added before the extraction with hexane. The relative levels before and after hydrolysis conditions were reported as area ratio with the internal standards [15N]O2-[d4]OA and [15N]O2-[d4]SA, respectively (supplemental Fig. S3A–E). The extent of hydrolysis of the NO2-FA-containing TAG standards (10-NO2-OA-TAG and 10-NO2-SA-TAG) was further confirmed by TLC and iodine staining.
PtGR-1 activity analysis
The concentrations of (E)-10-NO2-OA and (Z)-10-NO2-OA were determined by UV-Vis spectrometry by using the same extinction coefficient of 7.5 mM−1cm−1 at λ = 257 nm in methanol. The concentration of 10-NO2-(t8,9)-18:1 was adjusted by LC-MS/MS analysis using (E)-10-NO2-OA and (Z)-10-NO2-OA standards as reference values. The NADPH concentration in phosphate buffer was calculated using an extinction coefficient (ε340) of 6.22 mM−1cm−1. Then, (E)-10-NO2-OA, (Z)-10-NO2-OA, and 10-NO2-(t8,9)-18:1 (500 nM) were incubated at room temperature with 30 ng of PtGR-1 with 250 μM of NADPH in 10 mM of sodium phosphate buffer (pH 7.0) supplemented with 100 μM of DTPA and 100 nM of internal standard [15N]O2-[d4]SA. Aliquots were collected at 0, 1, 5, 15, 30, and 60 min, and reactions were stopped by 10-fold dilution in methanol, and 10-NO2-SA formation and 10-NO2-OA isomer consumption were quantified by HPLC-ESI-MS/MS.
Distribution of 10-NO2-OA among plasma lipid classes
Lipids were extracted from 100 μl of plasma using the Bligh and Dyer method, and the chloroform phase was dried under a stream of nitrogen and dissolved in 0.5 ml of hexane/methyl tert-butyl ether/acetic acid (100:3:0.3 v/v/v). Lipid classes were chromatographically separated using solid phase extraction Strata NH2 columns (100 mg/1 ml), preconditioned with 2 ml of acetone/water (7:1, v/v) and equilibrated with 2 ml of hexane. The lipid extracts solubilized in hexane/methyl tert-butyl ether/acetic acid were loaded on the columns and cholesterol ester (CE), TAG, monoglyceride+diglyceride (MAG+DAG), FFA, and phospholipid (PL) fractions were sequentially eluted with 1 ml of hexane, hexane/chloroform/ethyl acetate (100:5:5, v/v/v), chloroform/2-propanol (2:1, v/v), diethyl ether/2% acetic acid, and methanol, respectively. For analysis, the TAG and MAG+DAG fractions were pooled together because some NO2-FA-TAG eluted in the latter fraction. The lipid fractions were dried under a flow of N2, dissolved in 1.8 ml of acetonitrile spiked with a 40 pmol mix of labeled [15N]O2-[d4]OA and [15N]O2-[d4]SA, and vortexed. Then, 0.9 ml were left at room temperature (free acid levels) and 0.9 ml were incubated at 90°C for 1 h in the presence of 100 μl of HCl (total levels) and processed as above. Finally, 10-NO2-OA and its main metabolites were quantified by HPLC-MS/MS.
HPLC-MS/MS analysis
Identification of NO2-FAs and their BME adducts was performed by HPLC-ESI-MS/MS using an analytical C18 Luna column (2 × 100 mm, 5 μm; Phenomenex) at a 0.65 ml/min flow rate, with a gradient solvent system consisting of water containing 0.1% acetic acid (solvent A) and acetonitrile containing 0.1% acetic acid (solvent B). Samples were chromatographically resolved using the following gradient program: 45–100% solvent B (0–8 min); 100% solvent B (8–10 min) followed by 2 min re-equilibration at initial conditions. Detection of 10-NO2-OA-glycerol was performed using a C18 Luna column (2 × 20 mm, 5 μm; Phenomenex) at 0.7 ml/min flow rate with the same solvents as above and the following gradient: 30–100% solvent B (0–3 min); 100% solvent B (3–4 min) followed by 1 min re-equilibration at initial conditions.
To improve chromatographic resolution of 10-NO2-OA isomers, a Polaris amide-C18 column (2.1 × 150 mm, 3 μm; Agilent) was used with a 0.52 ml/min flow rate, the above gradient system, and the following gradient program: 65–84.2% solvent B (0–9 min); 84.2% solvent B (9–12 min) followed by 3 min re-equilibration at initial conditions. A QTRAP 6500+ triple quadrupole mass spectrometer (Sciex, Framingham, MA) was used with the following parameters: declustering potential –50 V, entrance potential and collision cell exit potential –5 V, and a source temperature of 650°C. The 10-NO2-OA and its isomers, 10-NO2-SA, [15N]O2-[d4]OA, and [15N]O2-[d4]SA, were quantified in negative ion mode [collision energy –42 eV] using the following transitions: MRM 326.2/46, 328.2/46, 331.2/47, 333.2/47, respectively. The analysis of BME adducts was performed in negative ion mode with collision energy –15 eV, following the neutral loss of BME (MRM 404.2/326.2, and 409.2/331.2, respectively). Quantitation of plasma NO2-FAs was performed by stable isotopic dilution analysis using 10-NO2-OA and 10-NO2-SA calibration curves in the presence of the [15N]O2-[d4]OA and [15N]O2-[d4]SA internal standards, respectively. The analysis of 10-NO2-OA-glycerol was performed in positive ion mode with collision energy 15, 25, 20, 25 eV for the following MRM transitions, respectively: 402.3/384.2, 402.3/328.2, 402.3/310.2, 402.3/292.2.
HR-MS analysis of nonesterified 10-NO2-OA species was performed on a Q-Exactive hybrid quadrupole-Orbitrap mass spectrometer (Thermo Scientific) equipped with a Vanquish (Thermo Scientific) UHPLC and a HESI II electrospray source and operated in negative ion mode using the following parameters: auxiliary gas heater temperature 325°C, capillary temperature 300°C, sheath gas flow 45, auxiliary gas flow 15, sweep gas flow 2, spray voltage 4 kV, S-lens RF level 60 (%). The parallel reaction monitoring method following m/z 326.2337 was used for identification and characterization.
Analysis of 10-NO2-OA-TAG was performed by HPLC-HR-MS/MS using a C18 Luna column (2 × 150 mm, 3 μm; Phenomenex) at a flow rate of 0.4 ml/min with a post column infusion of 50 μl/min of 10% ammonium acetate in acetonitrile (10 mM final). The gradient solvent system consisted of 10% water in acetonitrile (solvent A) and ethyl acetate (solvent B). The 10-NO2-OA-TAGs were eluted using the following gradient: 35–90% solvent B (0–10 min); 90% solvent B (10–13 min) to then reach the initial conditions in 0.5 min and re-equilibrate for an additional 1.5 min. A Q-Exactive hybrid quadrupole-Orbitrap mass spectrometer (Thermo Scientific) equipped with a HESI II electrospray source was used to characterize 10-NO2-OA-TAG in positive mode. The following parameters were used: auxiliary gas heater temperature 250°C, capillary temperature 300°C, sheath gas flow rate 20, auxiliary gas flow rate 20, sweep gas flow rate 0, spray voltage 4 kV. Full mass scan analysis ranged from m/z 780 to 1,000 at 17,500 resolution. Odd mass ions, corresponding to NH4+ adducts of molecules containing an additional odd number of nitrogen atoms, were selected and subjected to MS2 fragmentation (composition confirmed at the <5 ppm level). The manufacturer’s recommended calibration solution was used to calibrate the instrument.
Statistical analysis
Values are expressed as mean ± standard deviation or error and two-way ANOVA plus Sidak’s multiple comparison test was used for statistical significance (P < 0.05).
RESULTS
Structural characterization of 10-NO2-OA-TAG
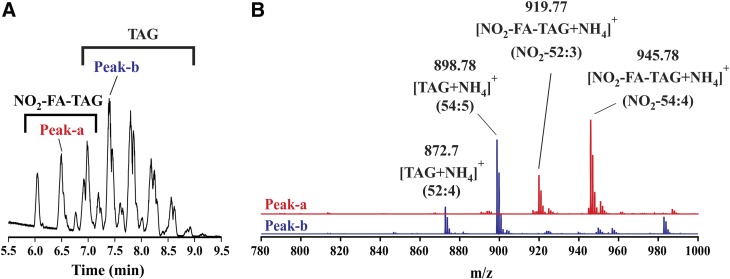
The TAG esterification of NO2-FAs upon intestinal absorption could have a significant impact on NO2-FA metabolism and distribution. To evaluate the formation of NO2-FA-containing TAG in vivo, plasma extracts from dogs orally dosed with vehicle or 10-NO2-OA were analyzed by HPLC-HR-MS/MS. The full MS chromatographic profiles (m/z 780–1,000 range) of samples from 10-NO2-OA-treated dogs presented a region with unique peaks between 6 and 7 min (Fig. 1A) that were absent in nontreated animals (not shown), while common peaks corresponding to TAGs were detected in the 7–9 min region. Analytes showing retention times of 6–7 min were characterized as having odd m/z values, contrasting the later eluting TAGs that displayed even m/z values. As an example, MS analysis of peak-a (retention time 6.5 min) showed the presence of two odd mass ions (m/z 919.77 and 945.78), which corresponded to ammoniated NO2-FA-TAGs ([NO2-FA-TAG+NH4]+) with a total number of carbons and double bonds of 52:3 and 54:4, respectively (Fig. 1B). In contrast, MS analysis of peak-b, in the common region, at 7.4 min showed two even [TAG+NH4]+ mass ions (m/z 872.70 and 898.78), consistent with 52:4 and 54:5 structures, respectively (Fig. 1B).
Fig. 1.
HPLC-HR-MS characterization of plasma TAGs. A: Chromatographic separation of NO2-FA-TAGs and TAGs. B: MS spectra of peak-a and peak-b.
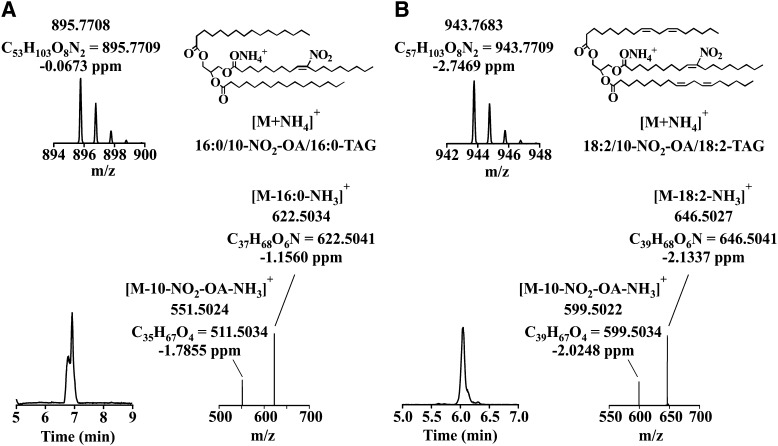
To better characterize the NO2-FA-TAGs present in plasma samples, a synthetic 16:0/10-NO2-OA/16:0-TAG was synthesized and analyzed (Fig. 2A). It presented a retention time of 6.9 min and an odd m/z value of 895.77. The MS2 analysis produced two even-mass fragments (m/z 622.5, containing 1 nitrogen atom) and one odd-numbered fragment (m/z 551.5), which corresponded to the neutral losses of palmitic acid and ammonia [M-16:0-NH3]+ and 10-NO2-OA and ammonia [M-10-NO2-OA-NH3]+, respectively. Based on the information gathered with this standard, the odd species eluting in the 6–7 min region were further characterized. This analysis consisted of elemental composition verification (at the 2 ppm level) and MS2 fragmentation (Table 1). As an example, the characterization of the odd mass ion, m/z 943.76, is shown (Fig. 2B) (25). This species eluted at retention time 6 min and displayed an elemental composition and isotopic distribution consistent with a NO2-FA-TAG. MS2 fragmentation analysis showed the presence of three “diglyceride ions”: two even mass of m/z 646.50, which corresponded to the neutral losses of linoleic acid and ammonia [M-18:2-NH3]+, and one with odd mass of m/z 599.50, resulting from the neutral loss of 10-NO2-OA and ammonia [M-10-NO2-OA-NH3]+. When this analytical approach was used on the remaining TAG species presenting a NO2 group, the majority of plasma NO2-FA-TAGs were identified as 10-NO2-OA-TAGs. The sn-1/sn-3 and sn-2 fatty acid position on the glycerol backbone of this species was determined by comparing the ion intensity of the MS2 fragments. This showed mono- and polyunsaturated fatty acids predominantly in sn-1/sn-3 position and 10-NO2-OA in the sn-2 position (35–38). On the basis of the relative peak area, 18:1/10-NO2-OA/18:2-TAG was the most abundant species with an odd mass of m/z 945.77.
Fig. 2.
MS characterization of 10-NO2-OA-containing TAGs. Chromatographic profile, isotopic distribution, representative chemical structure, and fragmentation analysis of: 10-NO2-OA-TAG standard (A) and 10-NO2-OA-TAG (B) in plasma.
TABLE 1.
MS characterization of the most abundant plasmatic NO2-FA-containing TAGs
| [NO2-FA-TAG+NH4]+ | Diaglyceride Product Ion [M-RnCOOH-NH3]+ | Intensity (%) | Chemical Formula | Experimental Mass | Theoretical Mass | Area (%) | Retention Time (min) | ||
| sn-2 | sn-1/3 | ||||||||
| NO2-18:1a | 18:1 | 18:1 | C57H107N2O8+ | 947.7988 | 947.8022 | 21.4 | 6.91 | ||
| NO2-18:1/18:1 | 100 | C39H70NO6+ | 648.5184 | 648.5198 | |||||
| 18:1/18:1 | 75 | C39H71O4+ | 603.5342 | 603.5347 | |||||
| NO2-18:1a | 18:0 | 18:2 | C57H107N2O8+ | 947.7988 | 947.8022 | – | 6.91 | ||
| NO2-18:1/18:0 | 35 | C39H72NO6+ | 650.5345 | 650.5345 | |||||
| NO2-18:1/18:2 | 50 | C39H68NO6+ | 646.5032 | 646.5041 | |||||
| 18:0/18:2 | 75 | C39H71O4+ | 603.5342 | 603.5347 | |||||
| NO2-18:0a | 18:1 | 18:2 | C57H107N2O8+ | 947.7988 | 947.8022 | – | 6.91 | ||
| NO2-18:0/18:1 | 35 | C39H72NO6+ | 650.5345 | 650.5345 | |||||
| NO2-18:0/18:1 | 100 | C39H70NO6+ | 648.5184 | 648.5198 | |||||
| 18:1/18:2 | 20 | C39H69O4+ | 601.5184 | 601.519 | |||||
| NO2-18:1 | 18:1 | 18:2 | C57H105N2O8+ | 945.7818 | 945.7865 | 29.3 | 6.5 | ||
| NO2-18:1/18:1 | 90 | C39H70NO6+ | 648.5191 | 648.5198 | |||||
| NO2-18:1/18:2 | 100 | C39H68NO6+ | 646.5033 | 646.5041 | |||||
| 18:1/18:2 | 60 | C39H69O4+ | 601.5192 | 601.519 | |||||
| NO2-18:1 | 18:2 | 18:2 | C57H103N2O8+ | 943.7683 | 943.7709 | 20.8 | 6.05 | ||
| NO2-18:1/18:2 | 100 | C39H68NO6+ | 646.5027 | 646.5041 | |||||
| 18:2/18:2 | 35 | C39H67O4+ | 599.5022 | 599.5034 | |||||
| NO2-18:1 | 18:1 | 16:0 | C55H105N2O8+ | 921.7844 | 921.7865 | 13.2 | 6.96 | ||
| NO2-18:1/18:1 | 85 | C39H70NO6+ | 648.5185 | 648.5198 | |||||
| NO2-18:1/16:0 | 100 | C37H68NO6+ | 622.5037 | 622.5041 | |||||
| 18:1/16:0 | 60 | C37H69O4+ | 577.5188 | 577.519 | |||||
| NO2-18:1 | 18:2 | 16:0 | C55H103N2O8+ | 919.7674 | 919.7709 | 15.3 | 6.53 | ||
| NO2-18:1/18:2 | 80 | C39H68NO6+ | 646.5027 | 646.5041 | |||||
| NO2-18:1/16:0 | 100 | C37H68NO6+ | 622.5036 | 622.5041 | |||||
| 18:2/16:0 | 65 | C37H67O4+ | 575.5034 | 575.5034 | |||||
Order of notation does not connote regiochemistry.
Assessment of the electrophilic character of 10-NO2-OA metabolites
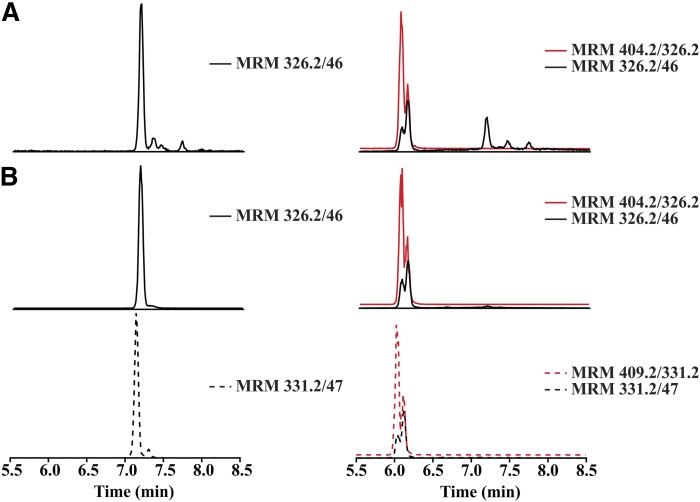
The electrophilic nature of the vinyl nitro substituent of NO2-FAs promotes Michael addition with nucleophiles, such as thiol-containing proteins and GSH (23). Plasma samples from 10-NO2-OA-treated dogs were analyzed before and after reaction with BME to identify electrophilic versus nonelectrophilic species (35). In this regard, the chromatogram for the transition 326.2/46 before BME treatment (Fig. 3A, left panel) showed a peak at 7.1 min, which coeluted with the synthetic 10-NO2-OA standard (Fig. 3B, left panel), and a later peak at 7.3 min, identified as (Z)-10-NO2-OA, its geometric isomer. As expected, the presence of deuterium in the internal standard [15N]O2-[d4]OA (MRM 331.2/47) reduced binding to the stationary phase (36), slightly decreasing its retention time (Fig. 3C, left panel). After BME derivatization, the corresponding BME-adducts for 10-NO2-OA and [15N]O2-[d4]OA (MRM 404.2/326.2 and 409.2/331.2) were detected at retention time 6 min, and complete loss of underivatized 10-NO2-OA was observed (Fig. 3B, C, right panels). A peak for MRM transitions (326.2/46 and 331.7/47) was obtained at the same retention time of the 10-NO2-OA-BME and [15N]O2-[d4]OA-BME adducts, respectively, corresponding to in-source β-elimination of BME from the adducts. When the electrophilicity of plasma metabolites of 10-NO2-OA following 14 days of dosing was assessed, an unreactive peak was detectable with a 326.2/46 MRM transition and a retention time of 7.1 min, reflective of 10-NO2-OA (Fig. 3A, right panel). Composition and fragmentation analysis by HR-MS/MS confirmed the presence of a double bond, a nitro group on an 18-carbon fatty acyl chain (supplemental Fig. S1). This species did not display specific fragments corresponding to the presence of a nitroalkene; thus, a structure corresponding to a NO2-OA with a double bond migration to the 8-9 carbon was proposed.
Fig. 3.
Identification of nonelectrophilic 10-NO2-OA isomers in vivo after oral administration. MRM chromatograms before (left panels) and after BME reaction (right panels) of: plasma after 14 days dosing (A), 10-NO2-OA standard (B), and internal standard [15N]O2-[d4]OA (C).
Synthesis and characterization of 10-NO2-OA-derived isomers
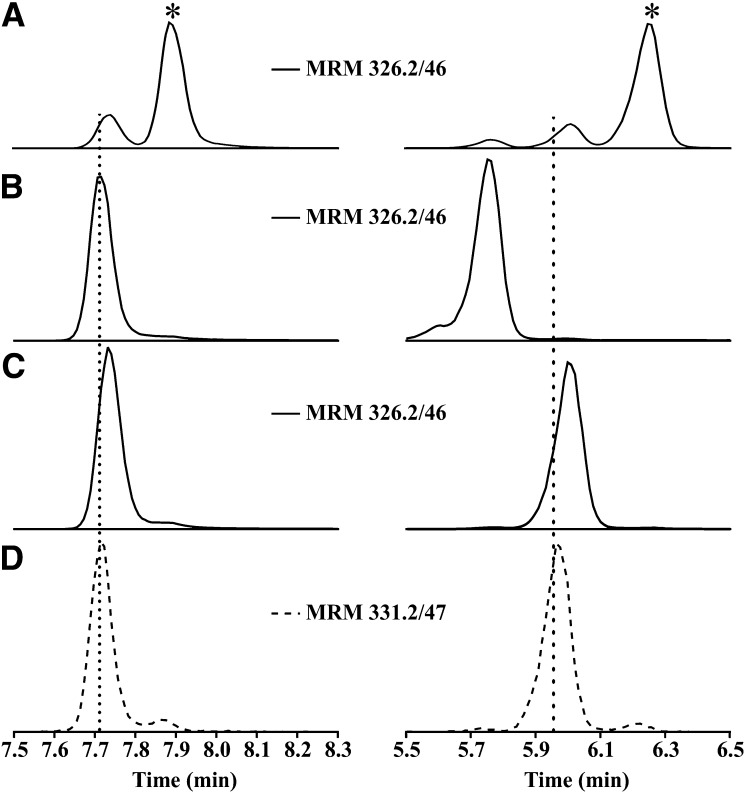
To confirm the initial structural assignment of the newly detected species in plasma, a 10-NO2-(t8,9)-18:1 standard was synthesized and characterized as described in the Materials and Methods. HPLC-MS/MS analysis of (E)-10-NO2-OA, (Z)-10-NO2-OA, and 10-NO2-(t8,9)-18:1 standards (MRM 326.2/46), using a C18 reverse phase column, showed poor chromatographic resolution of the peaks (Fig. 4, left panels) with the exception of (Z)-10-NO2-OA. Under these conditions, the (Z)-10-NO2-OA standard showed a retention time of 7.88 min, while the 10-NO2-(t8,9)-18:1 and (E)-10-NO2-OA standards almost overlapped with retention times of 7.71 min and 7.73 min, respectively (Fig. 4A–D, left panels). To improve the chromatographic resolution of these isomers, a new method using a C18-amide reverse phase column was developed that resolved all three isomers [(Z)-10-NO2-OA retention time 6.25 min, 10-NO2-(t8,9)-18:1 retention time 5.75 min, and (E)-10-NO2-OA retention time 5.96 min] (Fig. 4A–D, right panels). The structural assignment was further confirmed by comparing retention time, HR-MS, MS2 fragmentation, and electrophilic character between the standard and the plasma samples (supplemental Figs. S1, S2). The electrophilic (Z)-10-NO2-OA and (E)-10-NO2-OA standards generated their corresponding BME adducts, while 10-NO2-(t8,9)-18:1 was unreactive and no adduct formation was observed, paralleling the observation made in plasma samples.
Fig. 4.
Chromatography separation of 10-NO2-OA isomeric products. Chromatographic profile of (Z)-10-NO2-OA (A*), 10-NO2-(t8,9)18:1 (B), (E)-10-NO2-OA (C), and internal standard [15N]O2-[d4]OA (D) using a C18 reverse phase column (left panels) and C18-amide reverse phase column (right panels).
Enzymatic nitroalkene reduction
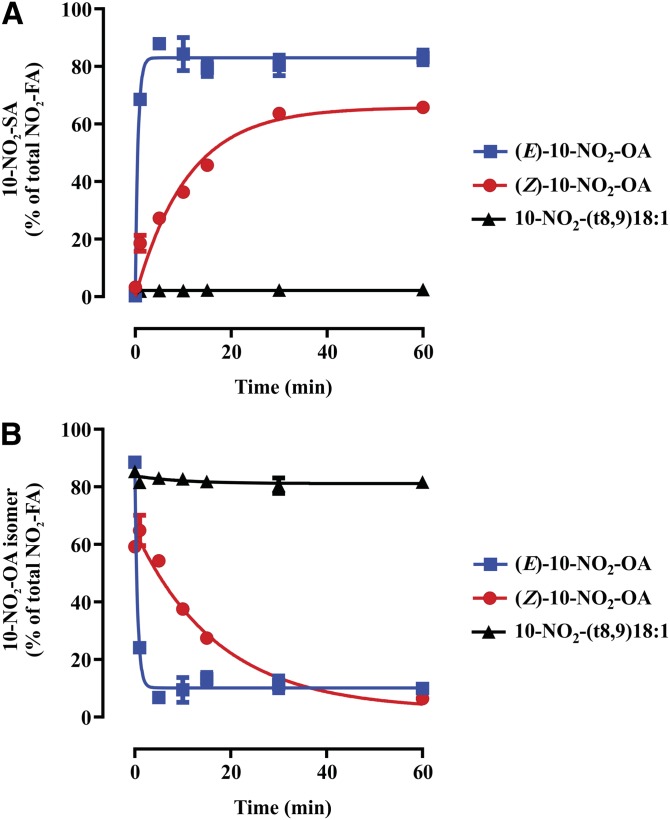
The appearance of 10-NO2-(t8,9)-18:1 and (Z)-10-NO2-OA isomers motivated their evaluation as substrates of PtGR-1 to form 10-NO2-SA, as this is the main metabolic route for (E)-10-NO2-OA inactivation (33) (Fig. 5). The (Z)-10-NO2-OA was a poor substrate and underwent slow reduction to 10-NO2-SA in comparison with (E)-10-NO2-OA (Fig. 5A, B). As predicted from the absence of a conjugated nitroalkene moiety, 10-NO2-(t8,9)-18:1 was not a substrate for PtGR-1, yielded no 10-NO2-SA, and was not consumed (Fig. 5A, B).
Fig. 5.
Reduction of 10-NO2-OA isomers by human recombinant PtGR-1. Time-dependent enzymatic reduction (A) and consumption (B) of (E)-10-NO2-OA, (Z)-10-NO2-OA, and 10-NO2-(t8,9)18:1. Traces are provided for illustration purposes and were obtained by fitting the data to exponential association and decay equations. Data shown are the mean (n = 4) ± standard deviation and are representative of two independent experiments.
Stability of 10-NO2-OA isomers under acidic conditions
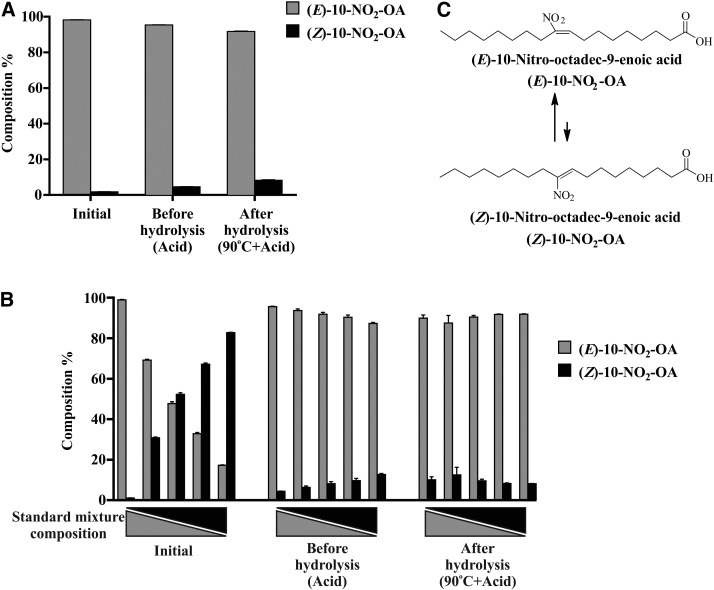
NO2-OA is unstable to hydrolysis conditions, given the reactivity of the nitroalkene group and the possibility that changes in pH, organic solvent, temperature, and reactions with nucleophiles may induce (E)- to (Z)-nitroalkene isomerization (32, 37). Thus, isomerization of (E)-10-NO2-OA and (Z)-10-NO2-OA was assessed under basal, acidic, and acid plus temperature (hydrolysis) conditions. The percentage of (Z)-10-NO2-OA in (E)-10-NO2-OA stock solution increased from 1.7% (basal) to 4.7% after addition of acidified acetonitrile and increased further to 8.3% at 90°C (Fig. 6A). This suggests that the apparent 20% loss of (E)-10-NO2-OA after acidic hydrolysis could be in part attributable to (E) to (Z) isomerization (supplemental Fig. S3A). To further assess the stability of (Z)-10-NO2-OA and confirm an acid-catalyzed re-equilibration between E and Z isomers, acidified (E)-10-NO2-OA and (Z)-10-NO2-OA mixtures (100/0, 75/25, 50/50, 25/75, 0/100; v/v) were analyzed (Fig. 6B). Regardless of the initial relative E and Z isomer composition, standards under acidic conditions reached a new equilibrium characterized by ∼10% (Z)-10-NO2-OA (Fig. 6B, C).
Fig. 6.
A: Acid-catalyzed isomerization of (E)- to (Z)-10-NO2-OA. B: Relative composition of isomer mixtures under acidic hydrolysis conditions. C: (E)/(Z) 10-NO2-OA isomer equilibrium in the presence of hydrochloric acid. Data shown are the mean (n = 3) ± SE of three and two independent experiments for A and B, respectively.
The stability of 10-NO2-SA and 10-NO2-(t8,9)-18:1 was also assessed under the same conditions. The 10-NO2-SA was stable, while 10-NO2-(t8,9)-18:1 showed ∼20% loss at 90°C to a product that was not further characterized (supplemental Fig. S3B, C).
Plasma metabolites after oral administration of 10-NO2-OA
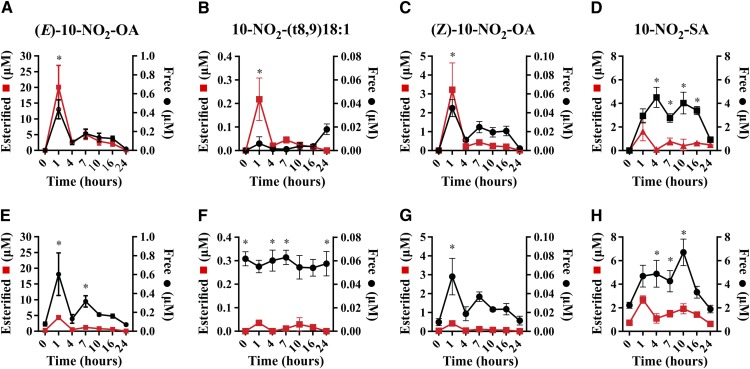
The PK of free plasma 10-NO2-OA and that esterified in complex lipids was evaluated after both 1 and 14 days of oral administration of 62.5 mg/kg/day of 10-NO2-OA (two doses of 31.25 mg/kg given 6 h apart daily). Notably, (E)-10-NO2-OA was preferentially esterified (>95%). The (E)-10-NO2-OA reached a maximum concentration (Cmax) of 20 ± 6.9 μM at 1 h, followed by a 7.4-fold decrease at 4 h (Fig. 7A), with levels doubling after the second daily administration to 5 ± 1.5 μM at 7 h. In contrast, unesterified levels of 10-NO2-SA were significantly greater than 10-NO2-OA, both on day 1 and day 14, while esterified levels were lower. After 14 days of treatment, unesterified (E)-10-NO2-OA levels were almost unchanged in comparison with day 1, while the esterified levels decreased ∼4-fold, a behavior that was not evident for 10-NO2-SA (Fig. 7E).
Fig. 7.
PK of 10-NO2-OA isomers and 10-NO2-SA in plasma after oral administration of 10-NO2-OA over 24 h (A–D) and after 14 days dosing (E–H). Data shown are the mean (n = 5) ± SE and two-way ANOVA plus Sidak’s multiple comparison were used for statistical significance (*P < 0.05 free versus esterified for each time point).
Similar to the distribution of (E)-10-NO2-OA, (Z)-10-NO2-OA and 10-NO2-(t8,9)-18:1 were esterified to a greater extent compared with the free acid and were ∼10 times and up to 100 times less abundant than (E)-10-NO2-OA, respectively. The free acid 10-NO2-(t8,9)-18:1 displayed sustained levels at day 14 with little variation throughout the time course with an average concentration of ∼0.06 μM.
In contrast to (E)-10-NO2-OA, its main metabolite, 10-NO2-SA, was predominantly nonesterified and was the most abundant metabolite detected. Its levels accumulated in plasma from 1 to 16 h with an average of ∼4 μM, then decreased to 0.9 ± 0.17 μM at 24 h, displaying a similar profile after 14 days (Fig. 7H). TAG-esterified 10-NO2-SA levels showed a PK profile that was similar to that of (E)-10-NO2-OA, with a 24 h Cmax of 1.62 ± 0.7 μM, 10-fold lower than the Cmax of esterified (E)-10-NO2-OA. Finally, esterified 10-NO2-SA concentrations slightly increased after 14 days (Cmax of 2.68 ± 0.3 μM).
Biodistribution and metabolism of 10-NO2-OA in plasma lipids
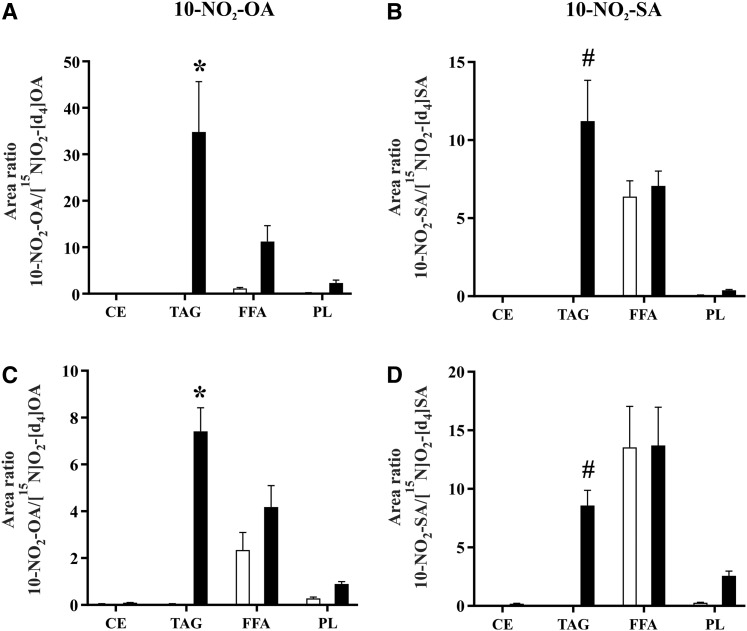
The distribution of (E)-10-NO2-OA among different complex lipid classes was then determined. In agreement with the observations of the PK study at 1 h of day 1 and day 14 (Fig. 7 A, E), (E)-10-NO2-OA was preferentially detected in esterified forms, predominantly in the TAG fraction with only minor esterification in PLs (Fig. 8A, C). Surprisingly, the total levels of (E)-10-NO2-OA increased in the FFA fraction upon hydrolysis, indicating the contribution of an esterified species present in this fraction. This species was identified as 10-NO2-OA-glycerol and was only detected in FFA fractions by HPLC-MS/MS using multiple MRM transitions (m/z 402.3/384.2, 402.3/328.2, 402.3/310.2, 402.3/292.2) that corresponded to the parent even mass ion, [10-NO2-OA-glycerol+H]+, and the even fragment ions, [10-NO2-OA-glycerol+H-water]+, [10-NO2-OA+H]+, [(10-NO2-OA)CO]+, and [(10-NO2-OA)CO-water]+, respectively (supplemental Fig. S4A, B). Finally, the distribution of 10-NO2-SA was greater in the TAG fraction than in the CE and PL fractions, and was comparable with the free nitroalkane levels in the FFA fraction (Fig. 8 B, D).
Fig. 8.
Biodistribution of 10-NO2-OA and 10-NO2-SA in plasma lipid fractions after oral supplementation of 10-NO2-OA. Free (white bars) and total (black bars) levels of 10-NO2-OA and 10-NO2-SA were analyzed at 1 h of day 1 (A, B) and day 14 (C, D). Data shown are the mean (n = 5) ± SE and two-way ANOVA plus Sidak’s multiple comparison were used for statistical significance (*P < 0.05 versus all the fractions; #P < 0.05 versus CE and PL).
DISCUSSION
NO2-FAs will display a complex PK profile for multiple reasons. These electrophilic species have a partial positive charge on the β carbon of the vinyl nitro substituent, which supports reversible Michael addition reactions with nucleophilic thiols of GSH and cysteine-containing proteins (16). By altering the structure and function of multiple thiol-containing transcriptional regulatory proteins, such as NF-kB p65 subunit, Keap1, stimulator of interferon genes (STING), and PPAR-γ, NO2-FAs modulate the expression of more than 300 genes crucial for cytoprotective, metabolic, and anti-inflammatory responses (38–40). In addition to the electrophilic character of 10-NO2-OA, its PK is also influenced by: a) esterification into PLs and TAGs (25, 41); b) inactivation upon PtGR-1 reduction to the nonelectrophilic nitroalkane, 10-NO2-SA (33); c) β- and ω-oxidation reactions to yield shorter chain length dicarboxylate products (27, 42); and d) isomerization to the corresponding geometric (Z)-isomer (43).
The 10-NO2-OA is undergoing phase 2 clinical trials for the treatment of chronic pulmonary and renal diseases, and the present study was designed to improve our understanding of the PK of this signaling mediator and new drug candidate. We show: a) TAG esterification as the primary mechanism of systemic 10-NO2-OA distribution; and b) the detection and characterization of in vivo 10-NO2-OA isomerization.
TAG esterification strongly influences the PK of 10-NO2-OA. For example, the whole-body distribution of radiolabeled [14C]10-NO2-OA after oral administration in rats showed rapid distribution to tissues that typically rely on fatty acid oxidation to supply energetic demand (28, 44). Also, significant accumulation into adipose tissue was observed over 2 weeks, an observation confirmed by lipidomic analysis (28). With improved analytical methods, we showed that, in orally dosed dogs, circulating plasma TAGs contained high levels of 10-NO2-OA. This compartmentalization can limit electrophilic reactions with nucleophiles and PtGR-1 and may ensure better PK and safety profiles of lipid electrophiles, species that have typically been viewed as toxic.
The preferential distribution of plasma 10-NO2-OA in TAG (10-NO2-OA-TAG) (Fig. 1), as opposed to free plasma (E)-10-NO2-OA levels (Figs. 7, 8), suggests an incorporation into chylomicron TAGs and lymphatic delivery into the systemic circulation via the subclavian vein. In contrast, nonesterified NO2-OA levels may be a consequence of absorption through the portal system and albumin-dependent transport. Importantly, absorption through the lymphatic system avoids first pass through the liver, greatly reducing initial metabolism by phase I and II enzymes, thus enhancing oral bioavailability of this reactive lipid electrophile (30). Also, after 14 days, a decrease of esterified (E)-10-NO2-OA levels was observed when compared with day 1 (Fig. 7A, E), an effect that might be related to the relatively high daily dose and have little or no effect at lower, more clinically-relevant doses. Further studies are needed to assess whether this is the case.
The preferential esterification of 10-NO2-OA in the sn-2 position of TAG (Fig. 2, Table 1) could influence the species being delivered upon LPL hydrolysis in peripheral tissues. This enzyme preferentially hydrolyzes TAGs at the sn-1 and sn-3 positions to generate sn-2 monoglycerides (45) (supplemental Fig. S4). As a consequence, 10-NO2-OA-monoglycerides can be directly taken up by tissues, could alter hepatic lipoprotein metabolism and PL synthesis (46), and may induce new signaling activities on the basis of their structural resemblance to the endocannabinoid, 2-arachidonylglycerol. Moreover, the detection of 10-NO2-OA-glycerol in plasma may further support the role of LPLs in tissue distribution.
The detection and characterization of geometrical and structural 10-NO2-OA isomers are now reported in vivo. Previously, the profiling of nitro-oleic acid isomers had only been reported after biomimetic •NO2 nitration of oleic acid, followed by pentafluorobenzyl bromide/diisopropylethylamine derivatization and GC/MS analysis (47). The lack of reactivity of NO2-OA metabolites with BME now reveals the presence of 10-NO2-(t8,9)-18:1. This isomer did not resolve by C18 reverse phase chromatography; thus, a new rapid chromatographic method with an amide-C18 column was developed to resolve and quantitate the formation of different 10-NO2-OA regioisomers (Fig. 4).
The mechanism involved in the in vivo isomerization of 10-NO2-OA into 10-NO2-(t8,9)-18:1 may be a consequence of direct base-induced rearrangement, or related to the reversible formation of Michael adducts (23, 48) (Scheme 1). These are addition products that preferentially regenerate the nitroalkene group upon reversal. The first step in retro-Michael elimination is deprotonation of the α-carbon, followed by the β-elimination of the thiolate group (Scheme 1, upper insert). However, base catalyzed deprotonation of the significantly higher pKa γ-carbon followed by β-elimination would result in the formation of 10-NO2-(t8,9)-18:1. This pathway may be more accessible in conditions with conformational restrictions for elimination. Deprotonation at the γ-position could be spatially favored in certain protein adducts, where close basic residues could participate in deprotonation and simultaneous stabilization of the deprotonated γ-carbon by charge pairing, leading to the formation of nonelectrophilic 10-NO2-(t8,9)-18:1 upon elimination. In this mechanism, the irreversibility of this isomerization reaction could result in 10-NO2-(t8,9)-18:1 accumulation, despite it being less thermodynamically favored. A direct base-catalyzed isomerization, conversely, would be easily reversible and thus tend toward an equilibrium mixture.
Proposed mechanism of 10-NO2-(t8,9)18:1 formation.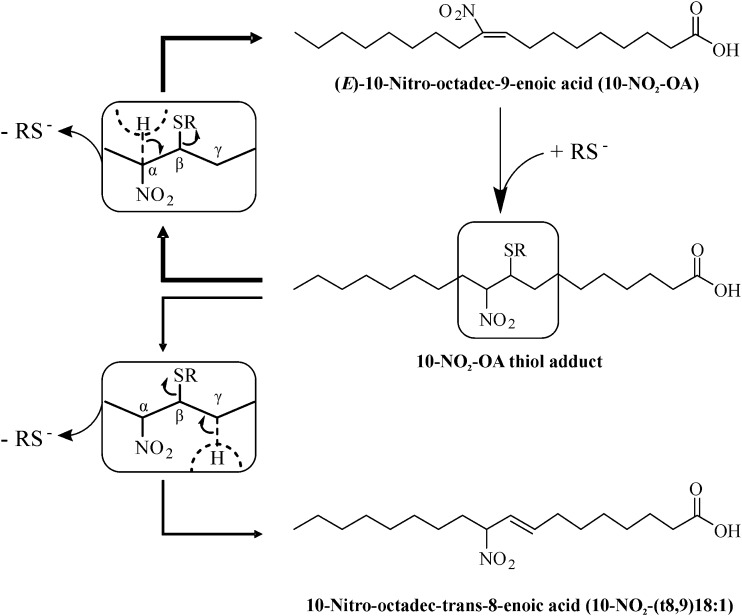
|
Scheme 1. |
As for 10-NO2-(t8,9)-18:1, thiol-addition reactions could also be responsible for the isomerization to (Z)-10-NO2-OA. While (E)-nitroalkenes are thermodynamically more stable than (Z)-isomers, isomerization can be promoted with organic solvents, heat, photochemical exposure, and catalytic nucleophile concentrations to reach equilibrium (37, 43). Because (Z)-10-NO2-OA showed ∼90% isomerization to (E)-10-NO2-OA under acidic hydrolysis conditions (Fig. 6B), plasma free 10-NO2-OA isomer levels were assessed after acetonitrile extraction to exclude any impact of low pH (Fig. 7). Interestingly, oral preparations of (E)-10-NO2-OA contained ∼1.7% of (Z)-10-NO2-OA (Fig. 6A), a level that increased to ∼10% in plasma (Fig. 7A, C), indicating an in vivo geometrical isomerization of the supplemented (E)-nitroalkene. Importantly, caution must be taken in the evaluation of esterified (Z)-10-NO2-OA levels because enzymatic, basic, and acidic hydrolysis methods all include at least one destabilizing factor that would directly impact its levels.
The electrophilic vinyl nitro group of monounsaturated, bis-allylic, and conjugated nitroalkenes (NO2-OA, NO2-LA, and NO2-CLA, respectively) is reduced by PtGR-1 to a nonelectrophilic nitroalkane (33). A comparison of 10-NO2-OA isomers showed that they were differentially metabolized by PtGR-1, with (E)-10-NO2-OA being a better substrate than (Z)-10-NO2-OA and no catalytic effect toward 10-NO2-(t8,9)-18:1 (Fig. 5A, B). The resistance of (Z)-10-NO2-OA to PtGR-1 reduction could reveal new avenues for the development of novel geometrical therapeutic signaling mediators having improved PK in vivo.
In conclusion, we established esterification of 10-NO2-OA in the sn-2 position of TAG as a mechanism that could limit hepatic first-pass inactivation of electrophilic nitroalkenes and thus promote tissue distribution of an otherwise chemically reactive species. This will improve the oral bioavailability of 10-NO2-OA and influence organ and cellular distribution. While these findings originate from the administration of 10-NO2-OA to dogs and we have observed a similar metabolism among different species and humans, the anatomic sites of incorporation of 10-NO2-OA into TAGs in humans remain to be investigated. This is a priority, as it will inform about the absorption and biodistribution of synthetic 10-NO2-OA and both NO2-FAs and other lipid electrophiles formed in the gastric compartment during digestion. Finally, the detection, characterization, new analytical methods, and profiling of 10-NO2-(t8,9)-18:1 and (Z)-10-NO2-OA in vivo reveal new directions for better understanding fatty acid nitration during metabolism and inflammation and the development of synthetic homologs of NO2-FAs with improved PK characteristics.
Supplementary Material
Footnotes
Abbreviations:
- ADME
- absorption, distribution, metabolism, and excretion
- BME
- β-mercaptoethanol
- Cmax
- maximum concentration
- CE
- cholesterol ester
- HR
- high-resolution
- MAG+DAG
- monoglyceride+diglyceride
- MRM
- multiple reaction monitoring
- •NO
- nitric oxide
- •NO2
- nitrogen dioxide
- NO2−
- nitrite
- NO3−
- nitrate
- NO2-FA
- nitro-fatty acid (fatty acid nitroalkene)
- NO2-FA-TAG
- nitro-fatty acid-containing triacylglyceride
- 10-NO2-OA
- 10-nitro-oleic acid [(E)-10-nitro-octadec-9-enoic acid]
- 10-NO2-OA-TAG
- 10-nitro-oleic acid-containing triacylglyceride
- 10-NO2-SA
- 10-nitro-stearic acid
- 10-NO2-SA-TAG
- 10-nitro-stearic acid-containing triacylglyceride
- 10-NO2-(t8
- 9)-18:1, 10-nitro-octadec-trans-8-enoic acid
- [15N]O2-[d4]OA
- (E)-10-nitro[15N]octadec-9-enoic-15,15,16,16-[d4] acid
- [15N]O2-[d4]SA
- (E)-10-nitro[15N]octadecanoic-15,15,16,16-[d4] acid
- PK
- pharmacokinetic(s)
- PL
- phospholipid
- PtGR-1
- prostaglandin reductase-1
- TAG
- triglyceride (triacylglyceride)
- (Z)-10-NO2-OA
- (Z)-10-nitro-octadec-9-enoic acid
This work was supported by the Ri.MED Foundation (M.F.); National Institutes of Health Grants R01-HL058115, R01-HL64937, P30-DK072506, P01-HL103455 (B.A.F.), R01-GM125944, R01-DK112854 (F.J.S.), and K01-HL133331 (D.A.V.); and American Heart Association Grant 17GRN33660955. The content is solely the responsibility of the authors and does not necessarily represent the official views of the National Institutes of Health. F.J.S., B.A.F., and D.A.V. acknowledge financial interest in Complexa, Inc.
The online version of this article (available at http://www.jlr.org) contains a supplement.
REFERENCES
- 1.Hodgson J. 2001. ADMET–turning chemicals into drugs. Nat. Biotechnol. 19: 722–726. [DOI] [PubMed] [Google Scholar]
- 2.Rudolph V., Rudolph T. K., Schopfer F. J., Bonacci G., Woodcock S. R., Cole M. P., Baker P. R., Ramani R., and Freeman B. A.. 2010. Endogenous generation and protective effects of nitro-fatty acids in a murine model of focal cardiac ischaemia and reperfusion. Cardiovasc. Res. 85: 155–166. [DOI] [PMC free article] [PubMed] [Google Scholar]
- 3.Rudolph T. K., Ravekes T., Klinke A., Friedrichs K., Mollenhauer M., Pekarova M., Ambrozova G., Martiskova H., Kaur J. J., Matthes B., et al. 2016. Nitrated fatty acids suppress angiotensin II-mediated fibrotic remodelling and atrial fibrillation. Cardiovasc. Res. 109: 174–184. [DOI] [PMC free article] [PubMed] [Google Scholar]
- 4.Mathers A. R., Carey C. D., Killeen M. E., Diaz-Perez J. A., Salvatore S. R., Schopfer F. J., Freeman B. A., and Falo L. D. Jr.. 2017. Electrophilic nitro-fatty acids suppress allergic contact dermatitis in mice. Allergy. 72: 656–664. [DOI] [PMC free article] [PubMed] [Google Scholar]
- 5.Villacorta L., Minarrieta L., Salvatore S. R., Khoo N. K., Rom O., Gao Z., Berman R. C., Jobbagy S., Li L., Woodcock S. R., et al. 2018. In situ generation, metabolism and immunomodulatory signaling actions of nitro-conjugated linoleic acid in a murine model of inflammation. Redox Biol. 15: 522–531. [DOI] [PMC free article] [PubMed] [Google Scholar]
- 6.Klinke A., Moller A., Pekarova M., Ravekes T., Friedrichs K., Berlin M., Scheu K. M., Kubala L., Kolarova H., Ambrozova G., et al. 2014. Protective effects of 10-nitro-oleic acid in a hypoxia-induced murine model of pulmonary hypertension. Am. J. Respir. Cell Mol. Biol. 51: 155–162. [DOI] [PMC free article] [PubMed] [Google Scholar]
- 7.Borniquel S., Jansson E. A., Cole M. P., Freeman B. A., and Lundberg J. O.. 2010. Nitrated oleic acid up-regulates PPARgamma and attenuates experimental inflammatory bowel disease. Free Radic. Biol. Med. 48: 499–505. [DOI] [PMC free article] [PubMed] [Google Scholar]
- 8.Fazzari M., Trostchansky A., Schopfer F. J., Salvatore S. R., Sanchez-Calvo B., Vitturi D., Valderrama R., Barroso J. B., Radi R., Freeman B. A., et al. 2014. Olives and olive oil are sources of electrophilic fatty acid nitroalkenes. PLoS One. 9: e84884. [DOI] [PMC free article] [PubMed] [Google Scholar]
- 9.Tsikas D., Zoerner A. A., Mitschke A., and Gutzki F. M.. 2009. Nitro-fatty acids occur in human plasma in the picomolar range: a targeted nitro-lipidomics GC-MS/MS study. Lipids. 44: 855–865. [DOI] [PubMed] [Google Scholar]
- 10.Vitturi D. A., Minarrieta L., Salvatore S. R., Postlethwait E. M., Fazzari M., Ferrer-Sueta G., Lancaster J. R. Jr., Freeman B. A., and Schopfer F. J.. 2015. Convergence of biological nitration and nitrosation via symmetrical nitrous anhydride. Nat. Chem. Biol. 11: 504–510. [DOI] [PMC free article] [PubMed] [Google Scholar]
- 11.Delmastro-Greenwood M., Hughan K. S., Vitturi D. A., Salvatore S. R., Grimes G., Potti G., Shiva S., Schopfer F. J., Gladwin M. T., Freeman B. A., et al. 2015. Nitrite and nitrate-dependent generation of anti-inflammatory fatty acid nitroalkenes. Free Radic. Biol. Med. 89: 333–341. [DOI] [PMC free article] [PubMed] [Google Scholar]
- 12.Salvatore S. R., Vitturi D. A., Baker P. R. S., Bonacci G., Koenitzer J. R., Woodcock S. R., Freeman B. A., and Schopfer F. J.. 2013. Characterization and quantification of endogenous fatty acid nitroalkene metabolites in human urine. J. Lipid Res. 54: 1998–2009. [DOI] [PMC free article] [PubMed] [Google Scholar]
- 13.Bonacci G., Baker P. R., Salvatore S. R., Shores D., Khoo N. K., Koenitzer J. R., Vitturi D. A., Woodcock S. R., Golin-Bisello F., Cole M. P., et al. 2012. Conjugated linoleic acid is a preferential substrate for fatty acid nitration. J. Biol. Chem. 287: 44071–44082. [DOI] [PMC free article] [PubMed] [Google Scholar]
- 14.Liu S., Jia Z., Zhou L., Liu Y., Ling H., Zhou S. F., Zhang A., Du Y., Guan G., and Yang T.. 2013. Nitro-oleic acid protects against adriamycin-induced nephropathy in mice. Am. J. Physiol. Renal Physiol. 305: F1533–F1541. [DOI] [PMC free article] [PubMed] [Google Scholar]
- 15.D’Amore A., Fazzari M., Jiang H. B., Luketich S. K., Luketich M. E., Hoff R., Jacobs D. L., Gu X., Badylak S. F., Freeman B. A., et al. 2018. Nitro-oleic acid (NO2-OA) release enhances regional angiogenesis in a rat abdominal wall defect model. Tissue Eng. Part A. 24: 889–904. [DOI] [PMC free article] [PubMed] [Google Scholar]
- 16.Schopfer F. J., Cipollina C., and Freeman B. A.. 2011. Formation and signaling actions of electrophilic lipids. Chem. Rev. 111: 5997–6021. [DOI] [PMC free article] [PubMed] [Google Scholar]
- 17.Kansanen E., Bonacci G., Schopfer F. J., Kuosmanen S. M., Tong K. I., Leinonen H., Woodcock S. R., Yamamoto M., Carlberg C., Yla-Herttuala S., et al. 2011. Electrophilic nitro-fatty acids activate NRF2 by a KEAP1 cysteine 151-independent mechanism. J. Biol. Chem. 286: 14019–14027. [DOI] [PMC free article] [PubMed] [Google Scholar]
- 18.Charles R. L., Rudyk O., Prysyazhna O., Kamynina A., Yang J., Morisseau C., Hammock B. D., Freeman B. A., and Eaton P.. 2014. Protection from hypertension in mice by the Mediterranean diet is mediated by nitro fatty acid inhibition of soluble epoxide hydrolase. Proc. Natl. Acad. Sci. USA. 111: 8167–8172. [DOI] [PMC free article] [PubMed] [Google Scholar]
- 19.Woodcock C. C., Huang Y., Woodcock S. R., Salvatore S. R., Singh B., Golin-Bisello F., Davidson N. E., Neumann C. A., Freeman B. A., and Wendell S. G.. 2018. Nitro-fatty acid inhibition of triple-negative breast cancer cell viability, migration, invasion, and tumor growth. J. Biol. Chem. 293: 1120–1137. [DOI] [PMC free article] [PubMed] [Google Scholar]
- 20.Kansanen E., Jyrkkanen H. K., Volger O. L., Leinonen H., Kivela A. M., Hakkinen S. K., Woodcock S. R., Schopfer F. J., Horrevoets A. J., Yla-Herttuala S., et al. 2009. Nrf2-dependent and -independent responses to nitro-fatty acids in human endothelial cells: identification of heat shock response as the major pathway activated by nitro-oleic acid. J. Biol. Chem. 284: 33233–33241. [DOI] [PMC free article] [PubMed] [Google Scholar]
- 21.Khoo N. K. H., Li L., Salvatore S. R., Schopfer F. J., and Freeman B. A.. 2018. Electrophilic fatty acid nitroalkenes regulate Nrf2 and NF-kappaB signaling:A medicinal chemistry investigation of structure-function relationships. Sci. Rep. 8: 2295. [DOI] [PMC free article] [PubMed] [Google Scholar]
- 22.Kelley E. E., Batthyany C. I., Hundley N. J., Woodcock S. R., Bonacci G., Del Rio J. M., Schopfer F. J., Lancaster J. R. Jr., Freeman B. A., and Tarpey M. M.. 2008. Nitro-oleic acid, a novel and irreversible inhibitor of xanthine oxidoreductase. J. Biol. Chem. 283: 36176–36184. [DOI] [PMC free article] [PubMed] [Google Scholar]
- 23.Baker L. M., Baker P. R., Golin-Bisello F., Schopfer F. J., Fink M., Woodcock S. R., Branchaud B. P., Radi R., and Freeman B. A.. 2007. Nitro-fatty acid reaction with glutathione and cysteine. Kinetic analysis of thiol alkylation by a Michael addition reaction. J. Biol. Chem. 282: 31085–31093. [DOI] [PMC free article] [PubMed] [Google Scholar]
- 24.Batthyany C., Schopfer F. J., Baker P. R., Duran R., Baker L. M., Huang Y., Cervenansky C., Branchaud B. P., and Freeman B. A.. 2006. Reversible post-translational modification of proteins by nitrated fatty acids in vivo. J. Biol. Chem. 281: 20450–20463. [DOI] [PMC free article] [PubMed] [Google Scholar]
- 25.Fazzari M., Khoo N., Woodcock S. R., Li L., Freeman B. A., and Schopfer F. J.. 2015. Generation and esterification of electrophilic fatty acid nitroalkenes in triacylglycerides. Free Radic. Biol. Med. 87: 113–124. [DOI] [PMC free article] [PubMed] [Google Scholar]
- 26.Melo T., Domingues P., Ferreira R., Milic I., Fedorova M., Santos S. M., Segundo M. A., and Domingues M. R.. 2016. Recent advances on mass spectrometry analysis of nitrated phospholipids. Anal. Chem. 88: 2622–2629. [DOI] [PubMed] [Google Scholar]
- 27.Salvatore S. R., Vitturi D. A., Fazzari M., Jorkasky D. K., and Schopfer F. J.. 2017. Evaluation of 10-nitro oleic acid bio-elimination in rats and humans. Sci. Rep. 7: 39900. [DOI] [PMC free article] [PubMed] [Google Scholar]
- 28.Fazzari M., Khoo N. K., Woodcock S. R., Jorkasky D. K., Li L., Schopfer F. J., and Freeman B. A.. 2017. Nitro-fatty acid pharmacokinetics in the adipose tissue compartment. J. Lipid Res. 58: 375–385. [DOI] [PMC free article] [PubMed] [Google Scholar]
- 29.Iqbal J., and Hussain M. M.. 2009. Intestinal lipid absorption. Am. J. Physiol. Endocrinol. Metab. 296: E1183–E1194. [DOI] [PMC free article] [PubMed] [Google Scholar]
- 30.Trevaskis N. L., Kaminskas L. M., and Porter C. J.. 2015. From sewer to saviour - targeting the lymphatic system to promote drug exposure and activity. Nat. Rev. Drug Discov. 14: 781–803. [DOI] [PubMed] [Google Scholar]
- 31.Woodcock S. R., Bonacci G., Gelhaus S. L., and Schopfer F. J.. 2013. Nitrated fatty acids: synthesis and measurement. Free Radic. Biol. Med. 59: 14–26. [DOI] [PMC free article] [PubMed] [Google Scholar]
- 32.Woodcock S. R., Marwitz A. J., Bruno P., and Branchaud B. P.. 2006. Synthesis of nitrolipids. All four possible diastereomers of nitrooleic acids: (E)- and (Z)-, 9- and 10-nitro-octadec-9-enoic acids. Org. Lett. 8: 3931–3934. [DOI] [PubMed] [Google Scholar]
- 33.Vitturi D. A., Chen C. S., Woodcock S. R., Salvatore S. R., Bonacci G., Koenitzer J. R., Stewart N. A., Wakabayashi N., Kensler T. W., Freeman B. A., et al. 2013. Modulation of nitro-fatty acid signaling: prostaglandin reductase-1 is a nitroalkene reductase. J. Biol. Chem. 288: 25626–25637. [DOI] [PMC free article] [PubMed] [Google Scholar]
- 34.Bligh E. G., and Dyer W. J.. 1959. A rapid method of total lipid extraction and purification. Can. J. Biochem. Physiol. 37: 911–917. [DOI] [PubMed] [Google Scholar]
- 35.Schopfer F. J., Batthyany C., Baker P. R., Bonacci G., Cole M. P., Rudolph V., Groeger A. L., Rudolph T. K., Nadtochiy S., Brookes P. S., et al. 2009. Detection and quantification of protein adduction by electrophilic fatty acids: mitochondrial generation of fatty acid nitroalkene derivatives. Free Radic. Biol. Med. 46: 1250–1259. [DOI] [PMC free article] [PubMed] [Google Scholar]
- 36.Turowski M., Yamakawa N., Meller J., Kimata K., Ikegami T., Hosoya K., Tanaka N., and Thornton E. R.. 2003. Deuterium isotope effects on hydrophobic interactions: the importance of dispersion interactions in the hydrophobic phase. J. Am. Chem. Soc. 125: 13836–13849. [DOI] [PubMed] [Google Scholar]
- 37.Martínez-Bescos P., Cagide-Fagín F., Roa L. F., Ortiz-Lara J. C., Kierus K., Ozores-Viturro L., Fernández-González M., and Alonso R.. 2008. Synthesis, structure, and E-Z isomerization of beta-(hetero)aryl-alpha-nitro-alpha,beta-enals. J. Org. Chem. 73: 3745–3753. [DOI] [PubMed] [Google Scholar]
- 38.Rom O., Khoo N. K. H., Chen Y. E., and Villacorta L.. Inflammatory signaling and metabolic regulation by nitro-fatty acids. Nitric Oxide. Epub ahead of print. March 22, 2018; doi:10.1016/j.niox.2018.03.017. [DOI] [PMC free article] [PubMed] [Google Scholar]
- 39.Deen A. J., Sihvola V., Harkonen J., Patinen T., Adinolfi S., and Levonen A. L.. Regulation of stress signaling pathways by nitro-fatty acids. Nitric Oxide. Epub ahead of print. March 19, 2018; doi:10.1016/j.niox.2018.03.012. [DOI] [PubMed] [Google Scholar]
- 40.Hansen A. L., Buchan G. J., Ruhl M., Mukai K., Salvatore S. R., Ogawa E., Andersen S. D., Iversen M. B., Thielke A. L., Gunderstofte C., et al. 2018. Nitro-fatty acids are formed in response to virus infection and are potent inhibitors of STING palmitoylation and signaling. Proc. Natl. Acad. Sci. USA. 115: E7768–E7775. [DOI] [PMC free article] [PubMed] [Google Scholar]
- 41.Melo T., Domingues P., Ribeiro-Rodrigues T. M., Girao H., Segundo M. A., and Domingues M. R.. 2017. Characterization of phospholipid nitroxidation by LC-MS in biomimetic models and in H9c2 Myoblast using a lipidomic approach. Free Radic. Biol. Med. 106: 219–227. [DOI] [PubMed] [Google Scholar]
- 42.Rudolph V., Schopfer F. J., Khoo N. K., Rudolph T. K., Cole M. P., Woodcock S. R., Bonacci G., Groeger A. L., Golin-Bisello F., Chen C. S., et al. 2009. Nitro-fatty acid metabolome: saturation, desaturation, beta-oxidation, and protein adduction. J. Biol. Chem. 284: 1461–1473. [DOI] [PMC free article] [PubMed] [Google Scholar]
- 43.Stanetty P., and Kremslehner M.. 1998. Synthesis of (E)-nitro olefins by isomerisation of (Z)-nitro olefins with polymer-supported triphenylphosphine. Tetrahedron Lett. 39: 811–812. [Google Scholar]
- 44.Rutkowski J. M., Stern J. H., and Scherer P. E.. 2015. The cell biology of fat expansion. J. Cell Biol. 208: 501–512. [DOI] [PMC free article] [PubMed] [Google Scholar]
- 45.Hunter J. E. 2001. Studies on effects of dietary fatty acids as related to their position on triglycerides. Lipids. 36: 655–668. [DOI] [PubMed] [Google Scholar]
- 46.Hayes K. C. 2001. Synthetic and modified glycerides: effects on plasma lipids. Curr. Opin. Lipidol. 12: 55–60. [DOI] [PubMed] [Google Scholar]
- 47.Jain K., Siddam A., Marathi A., Roy U., Falck J. R., and Balazy M.. 2008. The mechanism of oleic acid nitration by *NO(2). Free Radic. Biol. Med. 45: 269–283. [DOI] [PubMed] [Google Scholar]
- 48.Turell L., Vitturi D. A., Coitino E. L., Lebrato L., Moller M. N., Sagasti C., Salvatore S. R., Woodcock S. R., Alvarez B., and Schopfer F. J.. 2017. The chemical basis of thiol addition to nitro-conjugated linoleic acid, a protective cell-signaling lipid. J. Biol. Chem. 292: 1145–1159. [DOI] [PMC free article] [PubMed] [Google Scholar]
Associated Data
This section collects any data citations, data availability statements, or supplementary materials included in this article.


