

Abstract
The potential of human mesenchymal stromal/stem cells (MSCs) including oral stem cells (OSCs) as a cell source to derive functional neurons has been inconclusive. Here we tested a number of human OSCs for their neurogenic potential compared to non-OSCs and employed various neurogenic induction methods. OSCs including dental pulp stem cells (DPSCs), gingiva-derived mesenchymal stem cells (GMSCs), stem cells from apical papilla and non-OSCs including bone marrow MSCs (BMMSCs), foreskin fibroblasts and dermal fibroblasts using non-neurosphere- mediated or neurosphere-mediated methods to guide them toward neuronal lineages. Cells were subjected to RT- qPCR, immunocytofluorescence to detect the expression of neurogenic genes or electrophysiological analysis at final stage of maturation. We found that induced DPSCs and GMSCs overall appeared to be more neurogenic compared to other cells either morphologically or levels of neurogenic gene expression. Nonetheless, of all the neural induction methods employed, only one neurosphere-mediated method yielded electrophysiological properties of functional neurons. Under this method, cells expressed increased neural stem cell markers, nestin and SOX1, in the first phase of differentiation. Neuronal-like cells expressed βIII-tubulin, CNPase, GFAP, MAP-2, NFM, pan-Nav, GAD67, Nav1.6, NF1, NSE, PSD95, and synapsin after the second phase of differentiation to maturity. Electrophysiological experiments revealed that 8.3% of DPSC-derived neuronal cells and 21.2% of GMSC-derived neuronal cells.
Keywords: Oral stem cells, OSCs, adult stem cells, neural stem cells, NSCs, neurogenesis, neurosphere, neurons, dental pulp stem cells, gingival mesenchymal stem cells, immunocytofluorescence, qPCR, electrophysiology, patch clamp, action potential
1. Introduction
Due to limited source of human neural stem/progenitor cells (NSCs) for neural tissue regeneration, human mesenchymal stromal/stem cells (MSCs) including oral stem cells (OSCs) have been extensively tested for their neurogenic potential and as a cell source for neural regeneration. Despite certain reports demonstrated neuronal differentiation potential with functional capacities of these MSCs in vitro, other reports showed that these cells are not capable of becoming functional neurons 1–8. These MSCs also play a more important role by differentiating into glial cells and supporting endogenous NSCs to become neurons rather than themselves turning into neurons 6–8. Although genetic manipulations can convert even fibroblasts or hepatocytes to neurons 9,10, their clinical applications are highly questionable. Therefore, identifying an accessible cell source that potentially can be guided via differentiation factors of proteins/peptides, physiological chemicals in nature is a more preferred approach.
OSCs originate from migrating cranial neural crest cells 11, therefore they are thought to have a greater neurogenic potential than other MSCs 6,12. Human OSCs include those isolated from discarded wisdom teeth such as dental pulp stem cells (DPSCs) and stem cells from apical papilla (SCAP) 13, or from excised gingival tissue which harbors gingiva-derived mesenchymal stem cells (GMSCs) 14–16. These OSCs are different from other MSCs in many aspects. They proliferate rapidly in culture with an average population doubling (PD) time of ≤20 h, can reach a PD of up to 100 or more 13,17, and display stable morphology at higher passages while maintaining karyotype and telomerase activity in long term cultures 18.
Human DPSCs were first shown by Arthurs et al to exhibit sodium current after neurogenic induction while no action potential (AP) was detected 19. Other investigators have shown human DPSCs underwent neural differentiation exhibiting neural cell morphology using different components in the neural induction medium 20. However, Aanismaa et al concluded that human DPSCs cannot mature into functional neurons 21. Subsequently, Gervois et al was able to demonstrate electrophysiological characteristics of functional neurons derived from human DPSCs using a neurosphere-mediated method 22. Here we examined several human OSCs along with bone marrow (BM) MSCs and fibroblasts using various neurogenic induction methods and found that DPSCs and GMSCs have the potential to display functional aspects of neuronal cells in vitro.
2. Materials and Methods
2.1. Cell culture
Oral stem cells (OSCs) including DPSCs, SCAP and GMSCs were isolated as described previously 23. Briefly, freshly extracted permanent teeth or excised gingival tissues were collected form healthy donors (aged 16–40 yrs) in the Oral Surgery Clinics or Periodontic Clinics at Boston University (BU) and University of Tennessee Health Science Center (UTHSC) based on exempt protocols approved by the respective Medical Institutional Review Board (BU: #H-28882; and UTHSC:#12–01937-XM). The apical papilla was first removed from the immature teeth and the pulp was obtained after the tooth was split-opened. Collected tissues were digested in a solution of 3 mg/ml collagenase type I and 4 mg/ml dispase for 30 min to 1 hour at 37°C. Single-cell suspensions were obtained by passing the cells through a 70 μM strainer and seeded into culture plates. The remaining tissue debris was also seeded in the separate wells. The debris also gave rise to OSCs based on our observation. Cells were grown in media containing α-modification of Eagle’s medium (α-MEM) supplemented with 10% fetal bovine serum (FBS), 2 mM L-glutamine, 100 U/mL penicillin-G, 100 mg/mL streptomycin, and 0.25 mg/mL fungizone (Gemini Bio-Products, Inc., West Sacramento, CA, USA) and incubated at 37°C in 5% CO2. These OSCs are heterogeneous population of cells expressing typical MSC markers 13,15. The above mentioned isolation method routinely gives rise to clonogenic MSCs capable of expansion with robust proliferation in cultures 23–26. The size and morphology of DPSCs and SCAP in subconfluent cultures were very similar. At low passages (3–5) these two cell types displayed short spindle, triangular or rectangular shape with sizes ranging from 20–30 μm wide to 50–80 μm long. GMSCs were in general slightly larger than DPSCs or SCAP at the similar passages. They were more spindle shape and longer with sizes ranging from 15–30 μm wide to 90–150 μm long. Human foreskin fibroblasts (FFs) and human dermal fibroblasts (DFs) were purchased from ATCC. FFs were grown in the same medium as for OSCs, and DFs were in Fibroblast Growth Kit (ATCC, PCS-201–040) according to manufacturer’s instructions.
2.2. Neurogenic differentiation
2.2.1. Non-neurosphere method
Neural differentiation methods A and B are described in Supplemental Materials and Methods, and Supplemental Table S1.
2.2.1.1. Neural differentiation method-C
Cells at early passages (<P4) were plated in 6-well plates until becoming subconfluent. Pre-neural induction was performed by removing the medium, washing the cells with PBS and adding new α-MEM medium containing 10% FBS and 10 ng/ml bFGF for 24 h. Subsequently, the medium was removed and cells washed with PBS followed by adding the neural differentiation medium-C (NDM-C) (Table 1) 20,24,27. The cells were monitored continually after neural induction and were lysed for RNA extraction or fixed for immunostaining at specific times: days 7, 21 and 35. The control group received regular medium and was harvested at the same time points as the neurogenic group. One set of cells fixed or harvested before induction in experiment was regarded as day 020,24,27.
Table 1.
| Medium | Serum | Supplementation | |||
|---|---|---|---|---|---|
| Non-neuro sphere | Neurogenic differentiation
medium (NDM-C) (Method-C) |
α-MEM | Serum-free | 10 ng/ml bFGF, 10 μM forskolin, 25 mM KCl, 2 mM valproic acid, 5 μg/ml insulin. (the latter four items were from Sigma) |
|
| Neurosphere | Neurogenic differentiation (NDM-3) |
Stage-1 Neural induction medium |
DMEM/F12 | Serum-free | 2% B27 supplement 20 ng/ml EGF 20 ng/ml bFGF |
| (Method-3) | Stage-2 Neurogenic maturation
medium (NMM) |
Neurobasal medium | Serum-free | 2 mM L-glutamine 2% B27 1% N2 1 mM dbcAMP 30 ng/mL NT-3 |
|
Medium/serum and supplement were changed every 2–3 or 3–4 days
2.2.2. Neurosphere method
Neurosphere methods 1&2 are described in Supplemental Materials and Methods, and Supplemental Table S1.
2.2.2.1. Neural differentiation method-3
The procedures were based on a report by Gervois et al, 2015 22. Cells at a density of 7.5×10³ cells/cm2 were seeded into 6-well ultra-low attachment Petri dishes (Corning Life Sciences, Cat# 3471) in neural differentiation medium-3 (NDM-3) stage-1 (Table 1) to begin neurosphere formation and neural induction for 6–8 days. The medium was changed every 3–4 days by transferring the neurospheres to a 15-ml tube allowing them to settle down by gravity, followed by careful removal of the supernatant, adding the fresh medium and transferring them back to the culture plates. The diameter of the neurospheres was kept at ≤ 250 μm to maintain neurosphere viability. Subsequently the neurospheres were collected and seeded onto poly-l-ornithine/laminin coated glass coverslips in NDM-3 stage-2 neurogenic maturation medium allowing neurospheres to attach onto the coverslips and the cultures continued for 4 weeks. The medium was changed every 2–3 days until ready for analysis.
2.3. Quantitative Real-Time Polymerase Chain Reaction
Expression of neurogenic genes was analyzed by reverse transcription and quantitative real-time (q)PCR according to our previous reports 24,27. Briefly, total RNA was extracted using an RNeasy Mini or Micro Kit (Qiagen, Valencia, CA) according to the manufacturer’s instructions. Genomic DNA contaminants were removed. The extracted RNA (1μg) was used to generate the first strand cDNA with SuperScript III (Invitrogen) or SuperScript™ IV First-strand synthesis system (Thermo Scientific).
RT-qPCR was performed in two settings: i) Sybr Green master mix on an ABI SDS 7500 light cycler driven by ABI prism SDS v1.1 (Applied BioSystems, Foster City, CA, http://www.appliedbiosystems.com) with the following thermal cycling conditions: 50oC for 2 min, 95oC for 10 min, 95oC for 15 s, 53–58°C (depending on the primers used) for 30 s, 60 oC for 1 min, cycled to step 3 for 40 cycles. ii) Luminaris Color HiGreen Low ROX qPCR Master Kit (2X) (#K0374, Thermo Scientific) monitored by a MyiQ Real-Time PCR system (Bio-Rad) with an initial step at 95˚C for 10 min followed by 40 cycles of 95˚C for 15 s and 60˚C for 1 min. Primers shown in Supplemental Table S2 were used at a final concentration of 200 nM, and reactions for each sample were performed routinely in triplicate except indicated. For both settings of RT-qPCR data analysis, a relative quantitative analysis method was performed to quantify the relative gene expression. First, the CT or CP values of all samples in the plate were calculated against those of the first reference gene (internal control) glyceraldehyde-3-phosphate dehydrogenase (GAPDH), i.e., ΔCT or ΔCP = (CT or CP gene of interest - CT or CP internal control). After which, another appropriate gene in the experimental group was selected as the second reference gene to derive the relative expression levels of the sample genes through 2-ΔΔCT or -ΔΔCP calculations 28.
2.4. Immunocytofluorescence staining
The staining followed a protocol reported previously 23,26,29, or with modified approaches as follows. Cell cultures were fixed in 100% ice cold methanol for 10 min, followed by permeabilization with 0.1% Triton-X 100 (Sigma-Aldrich) in PBS for 15 min at room temperature. Cultures were washed twice with PBS prior to the blocking in 5% normal donkey serum (Sigma-Aldrich) in 0.25% BSA/PBS for 1 h at room temperature, followed by addition of the primary antibodies diluted in 0.25% BSA/PBS for 1 h at room temperature or overnight at 4˚C. After washing, cultures were incubated with secondary antibodies for 1 h at room temperature and the cell nuclei stained with DAPI (Invitrogen) at 1:2,000 dilution. All antibodies and their information used for the staining are listed in Supplemental Table S3. Images were analyzed under a fluorescence microscope.
2.5. Electrophysiology
Patch-clamp experiments of the neuronal cells derived using neurosphere method-3 were carried out based on the report by Gervois et al, 2015 22 with modifications. Whole-cell current-clamp and voltage-clamp measurements were performed at room temperature using a MultiClamp 700B amplifier and MultiClamp Commander (Axon Instruments, Molecular Devices, USA). The bath solution contained (in mM) 145 NaCl, 1.5 KCl, 2 CaCl2, 2 MgCl2, 10 HEPES, and 10 glucose (pH adjusted to 7.4 with NaOH). Patch clamp pipettes were made of borosilicate glass (Sutter Instruments) and had a resistance of 4–5 MΩ with an internal solution containing: 125 mM KCl, 1 mM CaCl2, 2 mM MgCl2, 2 mM Mg-ATP, 2 mM Na2ATP, 10 mM HEPES, 10 mM EGTA (pH adjusted to 7.2 with KOH).
For voltage-clamp experiments, the membrane was clamped at −80 mV for 400 ms and depolarized for 40 ms in a step-like manner from −80 to 200 mV at 20 mV intervals. Leak currents were subtracted using a P/4 protocol. K+ and Na+ current amplitudes were measured at the peak outward and inward values, respectively, and reported as current densities (pA/pF) for comparison. We used a perfusion system (ValveLink 8.2; AutoMate Scientific) to selectively block K+ and Na+ currents with 35 mM tetraethyl ammonium (TEA) and 1 μM tetrodotoxin (TTX), respectively. For current-clamp experiments, cells were set at −80 mV holding potential and APs were elicited by a step current injection of 100–300 pA for 1000 ms. Data was acquired with a sampling rate of 20 KHz and low-pass filtered (4 KHz) and analyzed off-line using Clampfit v10.4.2.0 (Molecular Devices).
2.6. Data Analysis
Paired t-test was performed to compare difference between outcomes of two conditions of the same cells. Mixed model with interaction was used to compare two conditions over time using a two-way analysis because condition and time were two different factors. Independent of condition differences overall across time points, condition difference at each time point was also studied using paired t-test. Three significance levels, namely, 0.05, 0.01 and 0.001 were presented in the results. Data were reported as mean ± SEM. All analyses were done using SAS 9.4 (SAS Institute Inc., Cary, NC).
3. Results
3.1. Non-neurosphere-mediated neurogenic induction of OSCs expressed neurogenic genes
Our first step was to test a number of OSCs along with BMMSCs, FFs and DFs. BMMSCs are a gold standard MSC often used as a comparison to other MSCs and in this case -- OSCs. We also included two types of fibroblasts FFs and DFs as non-stem cell controls. We have routinely isolated OSCs for various studies and we characterized these heterogeneous populations of OSCs for their multiple differentiation potential as shown in Fig. 1. Adipogenesis, osteogenesis and chondrogenesis were tested for such potential. For DPSCs and SCAP, we have performed many times of such tests and reported previously and recently 23,26,30–32. Both DPSCs and SCAP are highly osteo/dentinogenic while weak for adipogenic and chondrogenic potential. For cells shown in Fig. 1, BMMSCs had the strongest adipogenic potential as we have identified in our previous reports. DFs also showed some adipogenic potential, while GMSCs showed relatively weak adipogenic potential and FFs barely showed any. GMSCs and BMMSCs showed strong osteogenic potential with heavy deposits of minerals in cultures. We only performed chondrogenesis in culture wells instead of the more complex pellet cultures as our focus was neurogenesis. We noted that cells in some wells tended to contract into a sphere or exhibit stronger Alcian blue stain of the proteoglycans after chondrogenesis.
Fig. 1. Multiple differentiation potential of adult stem cells.
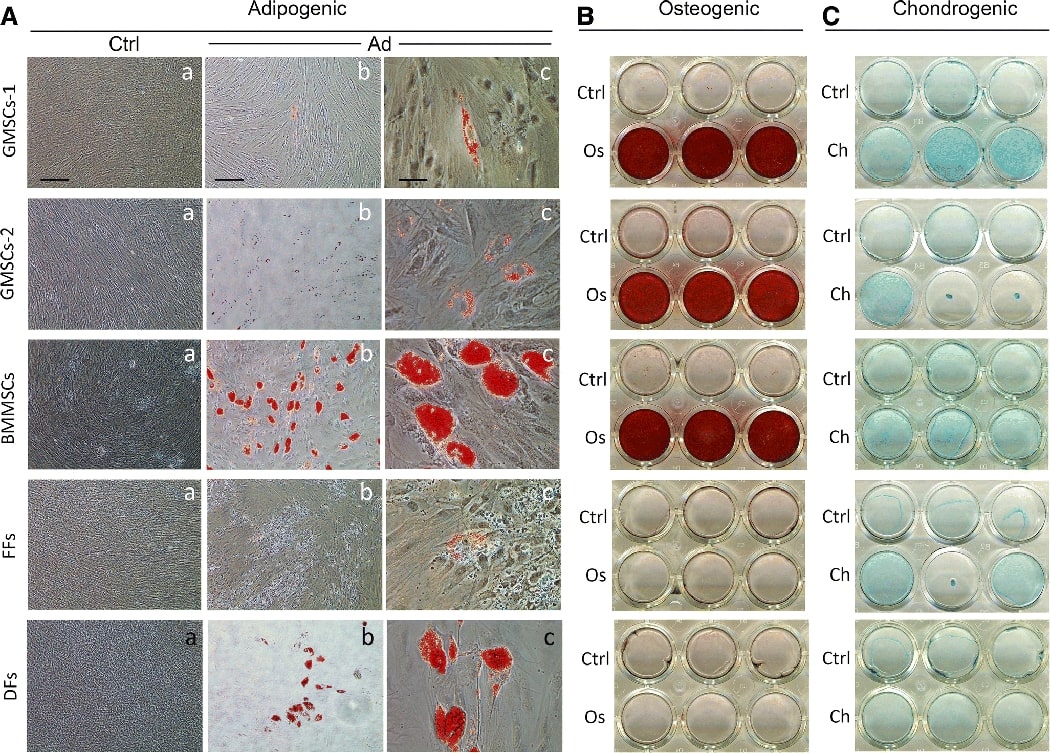
Representative data showing primary cell cultures in 24 well plates undergoing guided differentiation – adipogenic, osteogenic or chondrogenic followed by chemical analysis. (A) Adipogenic induction of cultures for 28 days followed by staining with Oil Red O. Ctrl: control cells uninduced; Ad: adipogenic induction. Red stain is the oil droplet in the adipocyte-like cells. (B) Osteogenic induction for 35 days followed by Alizarin Red S stain. Red stain indicates mineral deposits. Os: osteogenic induction. (C) Chondrogenic induction for 21 days and then cultures stained with Alcian blue to indicate the presence of sulfated proteoglycans. Ch: chondrogenic induction. All cultures were stained with respective chemicals including Ctrl groups. GMSCs-1, donor of 28 yrs female at passage 3; GMSCs-2, donor of 22 yrs female at p3; BMMSCs, donor of 29 yrs male, p3; FFs from ATCC, p3; DFs from ATCC, donor of 38 yrs female, p3. Scale bars: (Aa) Ctrl groups, 200 μm; (Ab) Ad groups, 200 μm; (Ac) Ad groups, 50 μm.
We next used two non-neurosphere-mediated neurogenic differentiation methods for neurogenesis studies. We found that NDM-A stimulation did not give rise to cells showing sufficient morphological resemblance to neural cells, although previously we have reported the detection of neural marker expression 23. At best, cells exhibited elongated fibroblast-like morphologies. NDM-B stimulation gave similar results. NDM-C stimulation, on the other hand, yielded morphologically neural-like cells. As demonstrated in Fig. 2A, the non-induced control groups maintained typical fibroblast morphology and became over-confluent after 35 days. The induced groups reduced or stopped proliferation and the cell body of some cells became spherical, exhibiting a neural-like morphology ranged from simple bipolar to large extensively branched multipolar cells. This was observed in OSC, BMMSC and FF groups. BMMSCs showed less neural-like cells than OSCs and FFs had even less. DFs did not show such neural-like morphology even after 35 days of induction. Among these cells, induced GMSCs appeared to display a greater number of neural- or neuron-like cells morphologically with typical multidendritric processes elaborating branches, outgrowth and protuberances.
Fig. 2. Non-neurosphere mediated neurogenic induction.
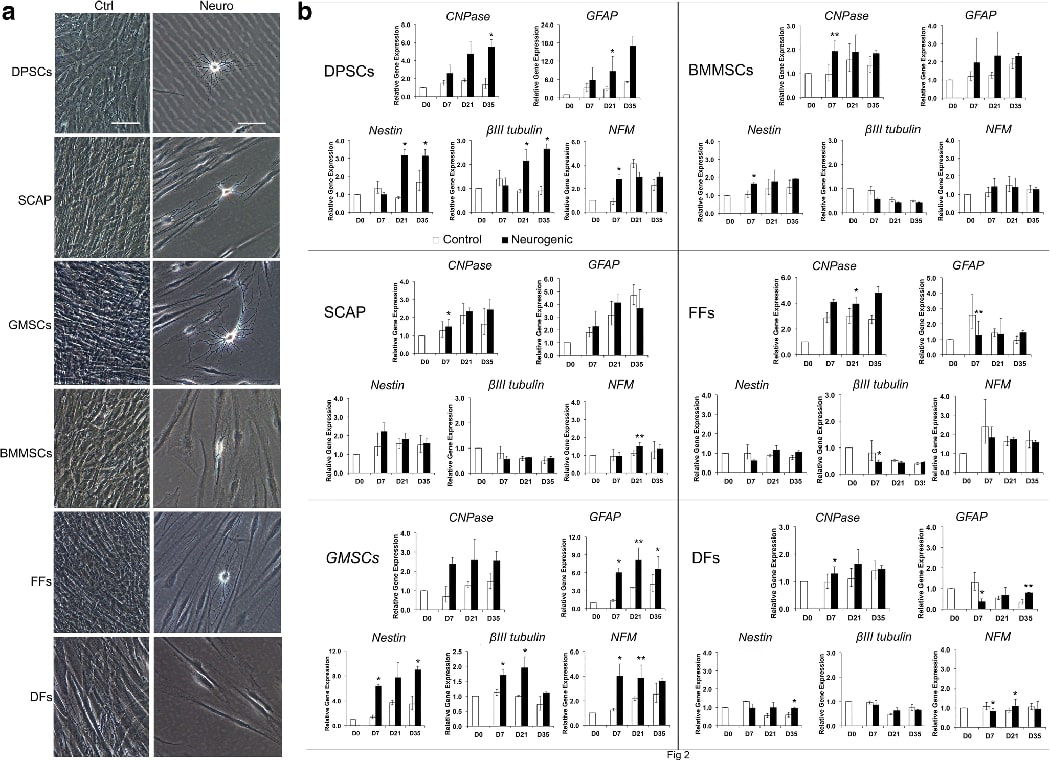
(A) Various MSCs and fibroblasts were stimulated under NDM-C for 35 days. OSCs included DPSCs, SCAP and GMSCs. Non-OSCs included BMMSCs, FFs and DFs. Ctrl: non-induced control; Neuro: induced in neurogenic medium. Scale bar: 100 μm. (B) At 0, 7, 21 and 35 days following NDM-C induction, cells were harvested for qPCR analysis of the expression of neural markers. Representative data measured in duplicate. Significant differences between control and neurogenesis in each cell group: *p < 0.05; **p<0.01.
Before neurogenic induction, we first performed RT-PCR to determine whether non-induced cells expressed these neurogenic genes. (Supplemental Fig. 1). βIII-tubulin was strongly expressed in all the cells. NFM could be detected in all the cells, but relatively weaker in GMSCs, BMMSCs and DFs, compared to that of DPSCs, SCAP and FFs. Nestin was more weakly expressed in DPSCs, and surprisingly in FFs and DFs as well. CNPase was weakly detected in all the cells while GFAP was not detected in any of these cells. Although nestin was low to non-detectable in GMSCs in this experiment but was detected in different donors which is presented in Fig 5 in the Neurosphere-mediated neural induction section below.
Subsequently we performed qPCR and analyzed at different time points after neurogenic induction as presented in Fig. 2B. Overall, DPSCs and GMSCs had more noticeable increase of all five neural genes examined compared to the controls -- nestin, βIII-tubulin, NFM, CNPase and GFAP, whereas other cells had no to minimal increase, or decrease of these neural genes. Of note, some genes did increase within the control groups over time such as GFAP in SCAP and GMSCs. Summary of these findings are shown in Supplemental Table S4. The qPCR experiments were repeated for some of these cell types obtained from different donors and the results are presented in Supplemental Fig 2. More neuronal genes or neurotrophic genes were examined including Nav1.6, NF1, NGF, BDNF and NT3. Variations were observed that the gene induction patterns appeared differently between different donors. Most genes increased either in controls or induced groups over time compared to day 0 despite the induced group was not higher than the control at the same time point. Glial cell markers CNPase and GFAP were more noticeably increased over time either under non-induced or induced conditions than the neuronal genes which is consistent to what is known for these MSCs.
To define neuronal cells, several features need to appear simultaneously: neuronal morphology, neuronal gene expression and electrophysiological properties. Among the cells examined in the above experiments, DPSCs and GMSCs showed more cells displaying neural or neuronal cell morphology. More importantly, these two cell types are relatively more easily accessed among OSCs. We then focused on DPSCs and GMSCs for the subsequent experiments. We performed immunocytofluorescence staining of these two cell types (Fig. 3) showing that they were positive for nestin, βIII-tubulin, NFM and CNPase, while negative for GFAP. Other cell types were also tested for the expression of several neural genes by immunocytofluorescence (Supplemental Fig. 3).
Figure 3. Immunocytofluorescence analysis after non-neurosphere-mediated neurogenic induction (NDM-C).
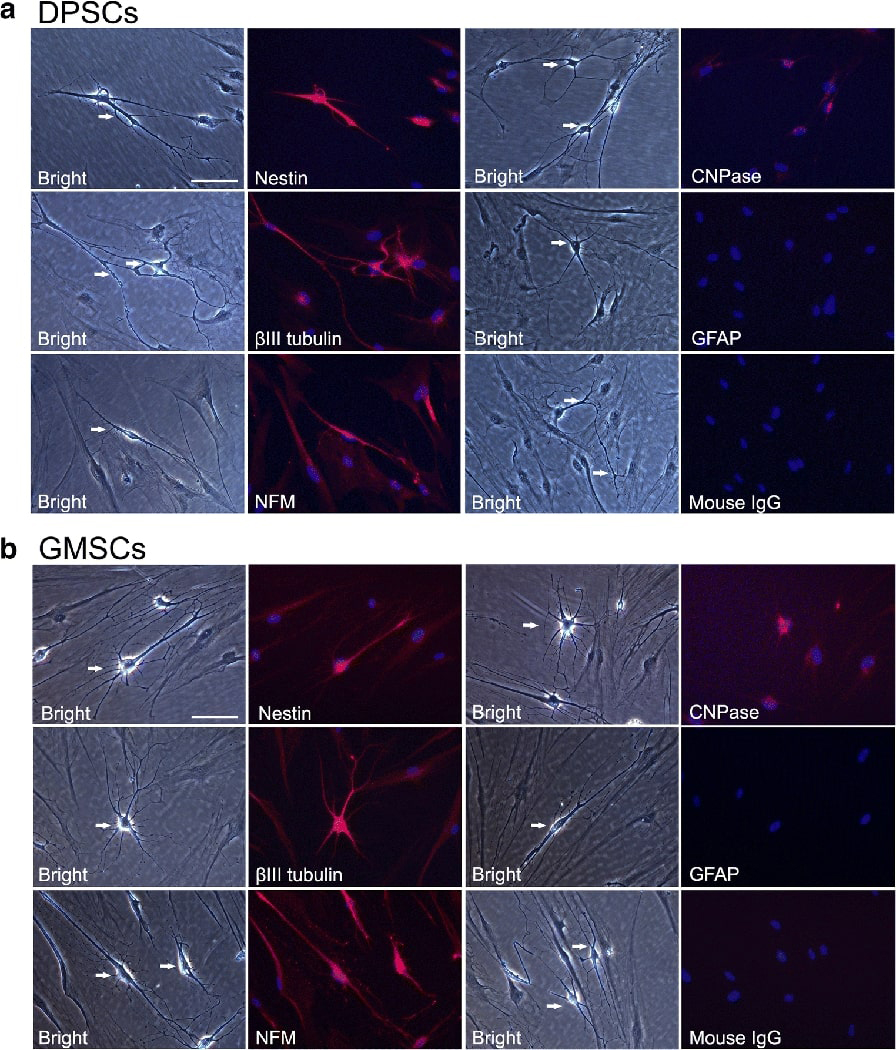
Cells were stimulated for 21 days and subjected to immunofluorescence staining. (A) Neural-like cells derived from DPSCs. (B) Neural-like cells derived from GMSCs. From both cell types, Nestin, βIII-tubulin, NFM and CNPase were positive while GFAP was not detectable. Scale bar: 100 μm for all images. DAPI: nuclear stain.
3.2. Lack of electrophysiological functions and inconsistent cell response to non-neurosphere-mediated neurogenesis
We then performed electrophysiology focusing on neural-like cells derived from DPSCs. We were unable to detect any electrical currents, either sodium or potassium. Nor did we detect any AP after repeated attempts using cells from multiple donors. In fact, frequently many cells were very fragile and burst during the formation of the patch-clamp seal, although showing neuron-like morphology during the process. Additionally, we encountered inconsistent responses from these OSCs following the induction using NIM-C. Massive cell death was observed ~2 weeks into the induction for some cells from certain donors.
3.3. Neurosphere-mediated neural induction led to formation of neural stem cell-like and neuron-like cells
The non-neurosphere mediated methods either failed to guide DPSCs into neuronal-like cells morphologically or exhibiting any electrophysiological functions despite expressing neural genes, therefore, we turned to neurosphere-mediated approaches and tested 3 methods.
3.3.1. Neurosphere method-1
DPSC-derived neurospheres were observed after 3 days in neurosphere medium (Supplemental Fig. 4A-B). Those neurospheres were dissociated and seeded onto the gelatin-coated dish to adhere (See Supplemental Materials & Methods). Fibroblasts like cells differentiated from neurosphere were seen on day 2 (Supplemental Fig. 4C). After 6 days of differentiation, only fibroblast-like cells, some with more elongated cell processes but no neural-like cells were observed (Supplemental Fig. 4D). Although βIII-tubulin was detected by immunofluorescence in these induced cells, this marker was also expressed in non-induced DPSCs.
3.3.2. Neurosphere method-2
We tested an approach using 3-day-old DPSC neurospheres attached onto poly-D-lysine-treated glass coverslips and incubated in neural differentiation medium (See Supplemental Materials & Methods) for 12 days either under hypoxic or normoxic conditions. We did not observe neural-like cells although βIII-tubulin and GFAP were detected by immunofluorescence staining (Supplemental Fig. 5). Longer culturing did not yield neural-like cells while cell detachment occurred.
3.3.3. Neurosphere method-3
We then resorted to a different approach in which a longer induction time was employed to allow neurospheres to form under NDM-3 stage-1 for 6–8 days. Over time, the neurospheres increased in size (Fig. 4, Supplemental Fig. 6). After which, the spheres were seeded onto poly-l-ornithine/laminin coated glass coverslips and attached spheres further incubated for 4 weeks under NDM-3 stage-2 for maturation.
Figure 4. Neurosphere-mediated neuronogenesis (method-3) of human DPSCs.
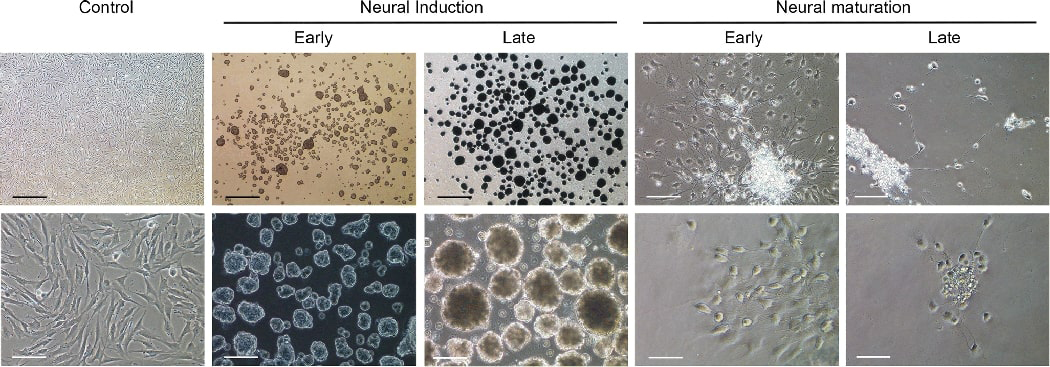
Neurospheres formed under stage-1 neural induction for 6–8 days as the spheres increased in size over time. Representative images of early phase (day 1) and late phase (day 6). After which, spheres were seeded onto poly-l-ornithine/laminin coated glass coverslips or culture wells and stimulated under neural maturation medium for ~4 weeks. The cells gradually showed spherical cell body and axon-like extensions over time. Representative images showing early phase (days 4–6) and late phase (days 35–39). Control: non-stimulated. Scale bars: Top panel, 500 μm (left 3 images,) 100 μm (right 2 images). Bottom panel, 100 μm (left 3 images), 50 μm (right 2 images).
The cells in the attached spheres migrated out in a few hours showing fibroblast type morphology many resembling NSCs with more triangular than spindle shape. Over the next few days, many cells began to extend many cellular processes. Usually around 7 days, more and more cells began to condense into ovoid to round shape soma with cellular extensions reaching out resembling neurite outgrowth which continued to increase over time. Some cells later developed axon- and dendrite-like extension as shown in Fig. 4, Supplemental Fig. 6. Approximately 2 weeks into the process, the majority of the neurospheres started to detach from the glass coverslips and by the end of week 4, ~10% of the neurospheres remained on the glass coverslips. At the end of 4 weeks, cells were subjected to immuno-staining, qPCR or electrophysiological studies. The survived neuronal cells may stay healthy in culture for another ~10 days (i.e. total of ~40 days in culture). A small number of cells could display good morphology for another 20 days (i.e., total of ~50 days) while most cells had died out by then. Images of selected cultures were recorded consecutively throughout most of the experimental period (Supplemental Fig. 7). Cells appeared to migrate to nearby locations particularly in the first week. We noted that some cells would turn into spheroid shape and then returned to flatter and spread-out shape temporarily before turning round-shaped again.
We examined NSC markers nestin, PAX6 and SOX1 by immunocytofluorescence. We detected nestin expression in both unstimulated controls and induced DPSCs and GMSCs (Fig. 5A). Weak PAX6 was also detected mainly in the cytoplasm before and after induction. SOX1 was expressed in non-induced cells and more in the induced cells, mainly in the nucleus. We also performed qPCR to detect nestin, PAX6 and SOX1 (Fig. 5B). The mRNA expression of nestin was significantly increased after induction in both cell types. PAX6, however, was decreased. SOX1 was increased significantly in GMSCs and was increased in DPSCs as well although statistically not detected for being significant.
Fig. 5. Immunocytofluorescence and qPCR analysis of neural stem cell genes.
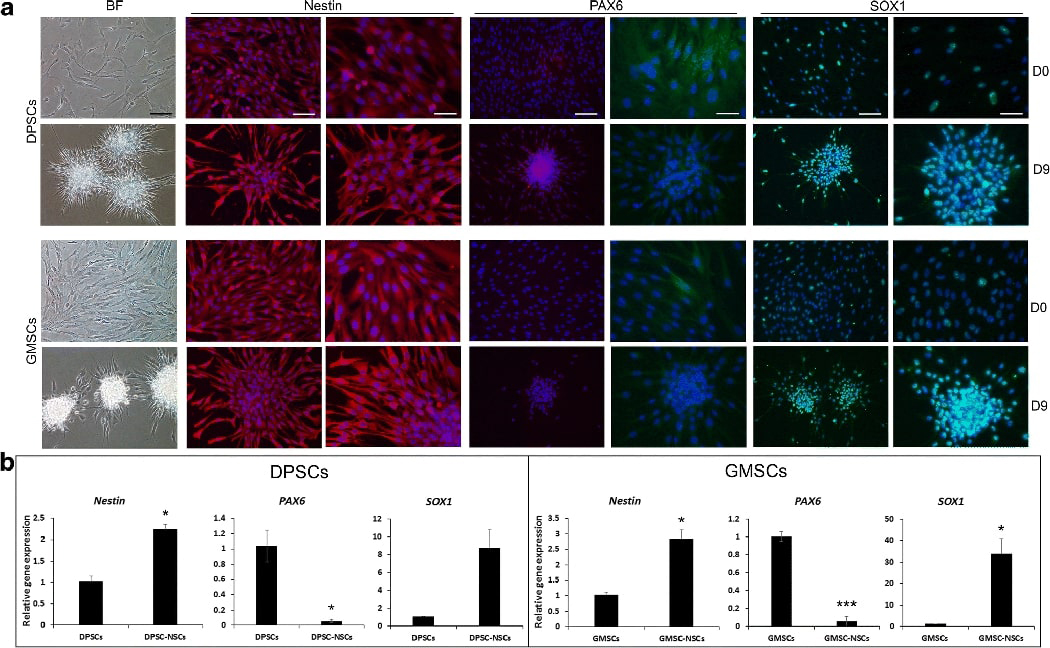
Under neurosphere-mediated neuronogenesis (method-3), DPSCs or GMSCs were induced to form neurospheres for 7–8 days and then seeded onto poly-l-ornithine/laminin coated culture wells for 1 day to allow attachment under neural maturation medium and then fixed for immunostaining or harvested for qPCR. (A) Immunofluorescence staining of expressed genes shown in red or green; DAPI, nuclear stain. Scale bars: BF (bright field), 100 μm; each gene left: 100 μm, right: 50 μm. (B) qPCR analysis showing relative gene expression comparing non-induced cells and neurogenically induced NSC-like cells (DPSC-NSCs, GMSC-NSCs). Representative data measured in triplicate. Significant differences between control and neurogenesis in each cell group: *p<0.05; ***p<0.01; ***p<0.001.
At the end of maturation, we examined neuronal and glial markers and detected βIII-tubulin, MAP-2, NFM, Nav, CNPase and GFAP by immunocytofluorescence (Fig. 6A). The staining also allowed us to observe the extension of axon-like processes. In comparison to those processes generated from NSCs derived from DPSC/SCAP-iPSCs we reported recently 26, the processes observed herein were not as long. The expression of CNPase and GFAP, which are markers of oligodendrocytes and astrocytes, respectively, at maturation confirmed the fact that OSCs are potent in gliogenesis. GFAP staining was not detected in DPSCs and GMSCs using non-neurosphere-mediated method NDM-C (Fig. 3) suggesting that this neurosphere-mediated method was more optimal, or it could have been due to donor variation.
Fig. 6. Immunocytofluorescence and qPCR analysis of neurogenic genes.
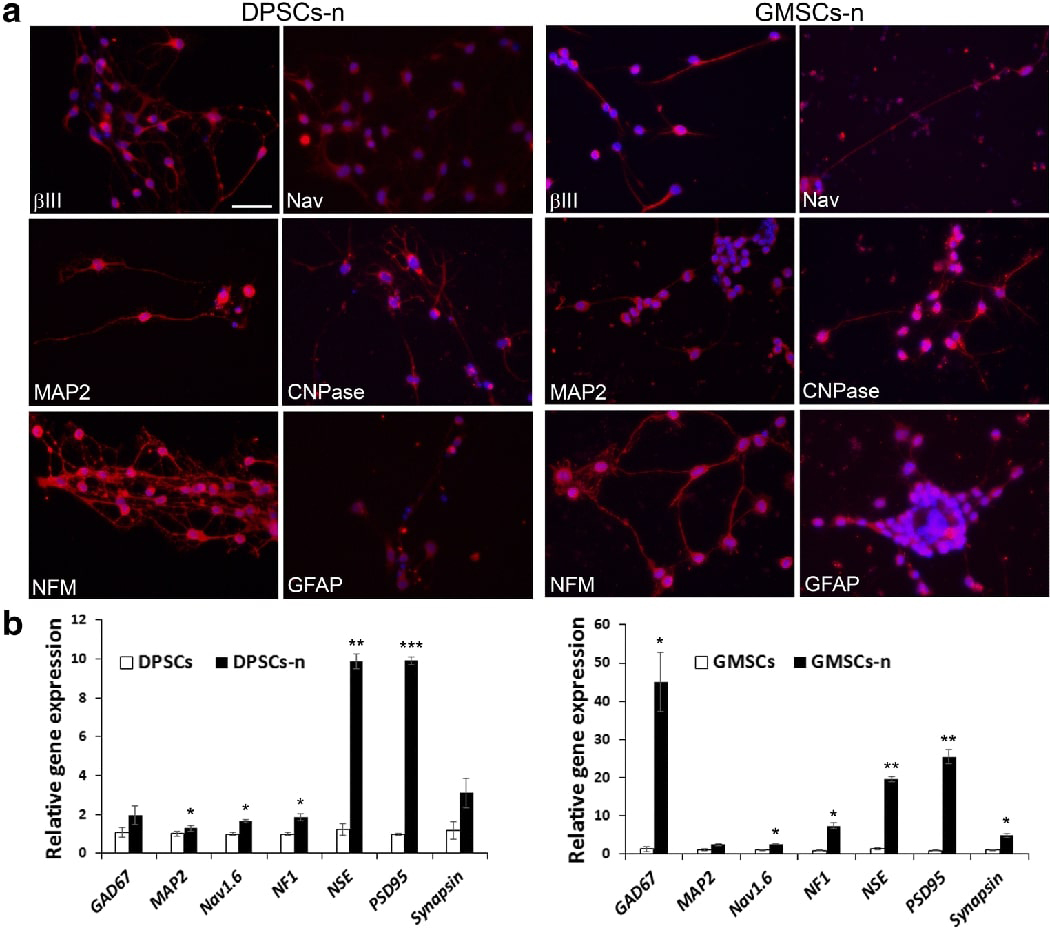
Using neurosphere-mediated neuronogenesis (method-3), cells underwent stage-1 neural induction and stage-2 maturation for a total of 5–6 weeks and then fixed for immunostaining or harvested for qPCR. (A) Expressed genes stained red; DAPI, nuclear stain. Scale bar: 50 μm for all images. (B) qPCR analysis showing relative gene expression comparing non-induced cells and neurogenically induced neuronal cells (DPSCs-n, GMSCs-n). Significant differences between control and neurogenesis in each cell group: *p<0.05; ***p<0.01; ***p<0.001.
We also performed qPCR to detect more neuronal markers including GAD67, MAP2, Nav1.6, NF1, NSE, PSD95 and synapsin and the data are presented in Fig. 6B showing generally increase of expression after neurogenic induction and maturation. NSE and PSD95 had more drastic induction in differentiated cells.
4. Electrophysiological function of induced neural-like cells via neurosphere-mediated approach
While other neurogenic stimulation methods did not yield either morphologically similar or functionally capable neuronal cells, neruosphere method 3 yielded cells with neuronal functions. Total of 15 donors for DPSCs and GMSCs were subjected to neurosphere-mediated neuronogenesis and whole cell patch clamp using similar approaches as reported previously 22,26 (Supplemental Table S5-A, B). We found that intracellular and extracellular patch-clamp solutions had to be specific. We first tested the solutions similar to our work for patch clamping iPSC-derived neurons on cells from several donors and it did not yield any AP (Supplemental Table S5C). We then employed the solutions identical to those reported by Gervois et al, 2015, which allowed the detection of APs.
We selected cells that had a neuron-like morphology (e.g., round cell body with axon- or dendrite-like processes). Non-induced cells were measured as controls. Whole-cell patch-clamp was used to measure voltage-gated Na+ currents and K+ currents. We detected both voltage-dependent Na+ and K+ currents in DPSC-neuronal cells and GMSC-neuronal cells, but not in non-induced cells (Fig. 7A,B; Fig. 8A,B). These inward Na+ currents could be completely blocked upon perfusion of 1 μM TTX and rapidly recovered with wash of TTX. Similarly, the K+ currents could be completely and reversely blocked by 35 mM TEA (Fig. 7C-F; Fig. 8 C-F). Therefore, the electrophysiological response seen in DPSCs and GMSCs is mainly due the opening and closing of voltage-gated Na+ and K+ channels since the currents were blocked by TTX and TEA.
Fig. 7. Electrophysiology of neuronal cells derived from DPSCs using the neurosphere-mediated method-3.
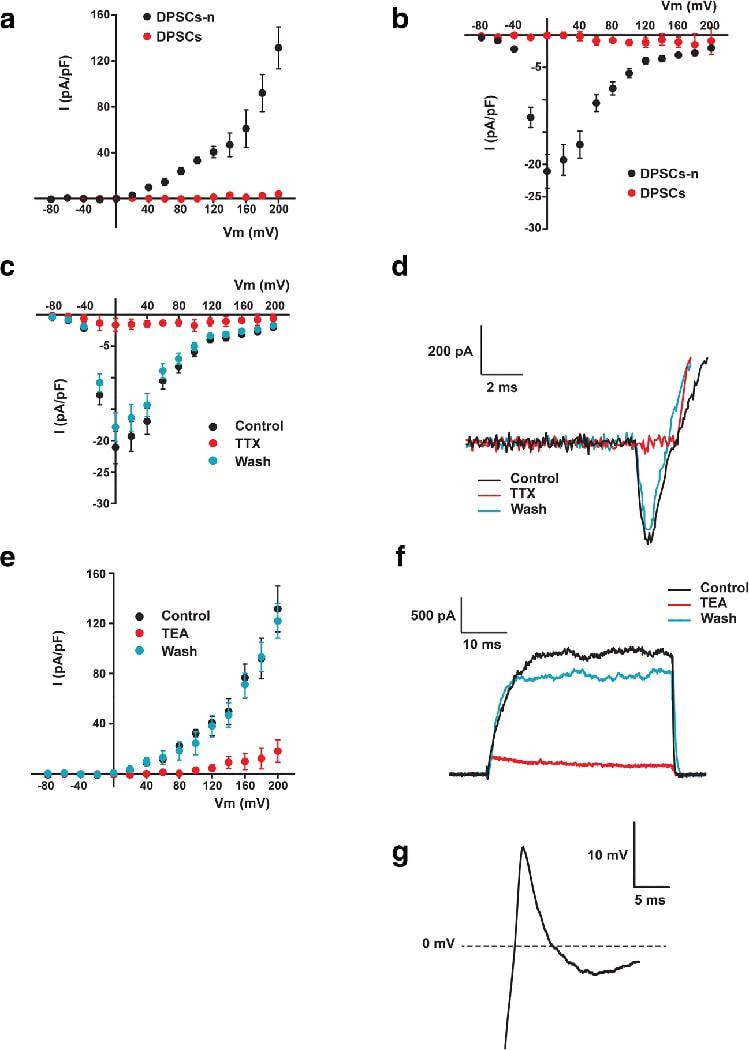
Neuronal cells derived from DPSCs (DPSCs-n), but not the unstimulated DPSCs, displayed voltage-dependent K+ and Na+ currents that evoked action potentials. I-V relationship of K+ (A) and Na+ (B) currents from −80 to 200 mV on DPSCs-n (n=5) and DPSCs (n=5). Perfusion on DPSCs-n of 1 μM tetrodotoxin (TTX) and 35 mM tetraethyl ammonium (TEA) reversibly blocked Na+-inward currents (n=5) (C and D) and K+-outward currents (n=5) (E and F) respectively. Single action potentials were elicited by depolarizing DPSCs-n (n=4) with a step current injection of 250 pA for 1000 ms (G).
Fig. 8. Electrophysiology of neuronal cells derived from GMSCs using the neurosphere-mediated method-3.
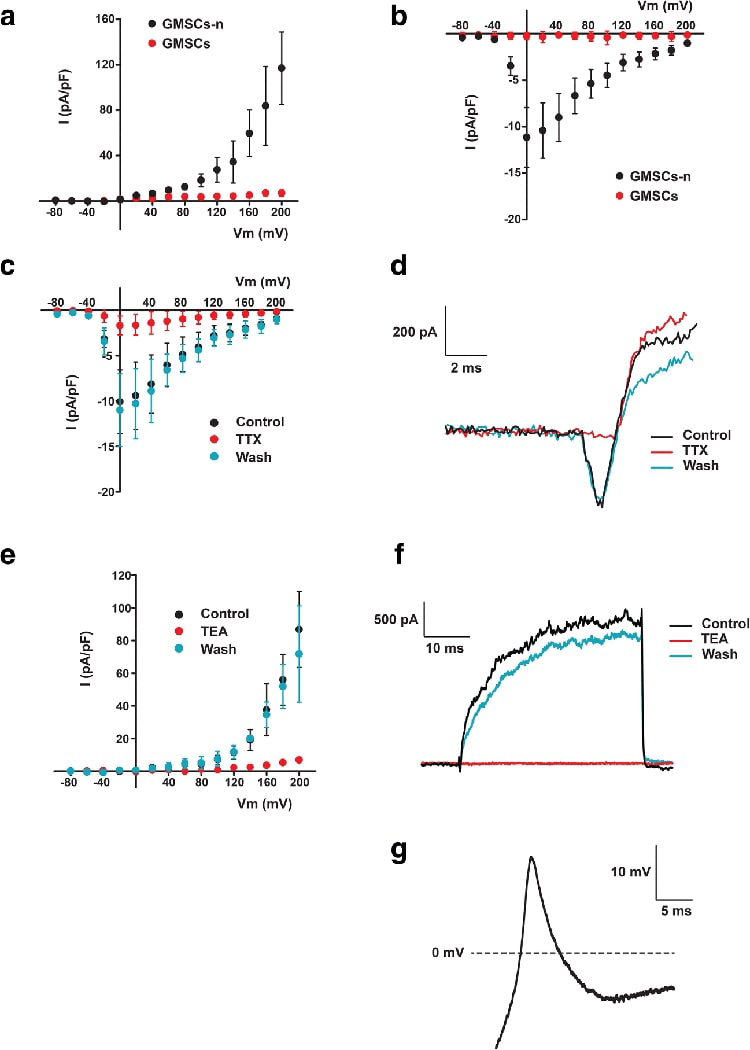
Neuronal cells derived from GMSCs (GMSCs-n), but not unstimulated GMSCs, displayed voltage-dependent K+ and Na+ currents that evoked action potentials. I-V relationship of K+ (A) and Na+ (B) currents from −80 to 200 mV on GMSCs-n (n=7) and GMSCs (n=5). Perfusion on GMSCs-n of 1 μM tetrodotoxin (TTX) and 35 mM tetraethyl ammonium (TEA) reversibly blocked Na+-inward currents (n=3) (C and D) and K+-outward currents (n=5) (E and F) respectively. Single action potentials were elicited by depolarizing GMSCs-n (n=10) with a step current injection of 250 pA for 1000 ms (G).
Overall, of all the cells successfully patched, 8.3% of DPSC-derived neurons and 21.4% of GMSC-derived neurons had AP detected (Table 2). The latter also had higher percentage of patched cells that exhibited Na+ and K+ current (DPSCs: Na+ 27.1%, K+ 37.5%; GMSCs: Na+ 60.7%, K+ 57.1%). If we consider the percentage of AP-positive by donors whose cells were tested, the percentage is slightly higher (DPSCs: 20%; GMSCs: 36.4%) than those percentages calculated by tested cells. We did not observe any spontaneous excitatory/inhibitory postsynaptic APs nor spontaneous AP activity during the current clamp experiments. The AP peak was smaller in magnitude than the ones reported for neurons (~+40 mV from 0) and the repolarization was incomplete. The magnitude of the Na+ current was between 150 – 400 pA. The cells remained partially depolarized after the initial spike and hyperpolarization was required to fire more than one AP; hence, one AP per depolarization.
Table 2:
Electrophysiology summary
| Cell type | Na current* | K current* | Action potential |
|---|---|---|---|
| % positive cells/total cells tested | |||
| DPSC-neurons | 27.1% (13/48) | 37.5% (18/48) | 8.3% (4/48) |
| GMSC-neurons | 67.3% (35/52) | 65.4% (34/52) | 21.2% (11/52) |
| % donors with positive response/total donors tested | |||
| DPSC-neurons | 40% (4/10) | 60% (6/10) | 20% (2/10) |
| GMSC-neurons | 63.6% (7/11) | 63.6% (7/11) | 36.4% (4/11) |
The amplitude of Na current larger than 50 pA and the amplitude of K current larger than 100 pA were counted as “+”.
5. Discussion
The present study extensively tested various neurogenic induction approaches to determine the potential of the neuronogenic potential of OSCs. As we have shown, DPSCs and GMSCs possess certain level of capacity to become functional neuronal cells in vitro, especially GMSCs. Our elaborate testing revealed that whether these OSCs can be guided to be functional neurons in vitro is dependent on specific approaches. We tested three non-neurosphere- and three neurosphere-mediated methods and only one of the latter methods was able to give rise to neuronal cells exhibiting action potential with a reliable level of consistency, although donor variation exists.
The best source to derive neural cells, particularly neurons, is from NSCs which have to be obtained from neural tissues for therapeutic purposes. Embryonic stem cells (ESCs) and induced pluripotent stem cells (iPSCs) are also a good source. It is considered that direct conversion of adult stem cells into neurons would be the most straightforward approach comparing to derivation from ESCs or iPSCs. Although most MSCs have neurogenic potential, their ability to become functional neurons is weak. This could explain why only one report by Gervois et al, 2015 was able to demonstrate in vitro AP from DPSC-derived neuronal cells while other protocols failed to achieve that on the same cell type 19,21, including those protocols tested in our present study. The major pitfall is that morphologic features and gene marker expression cannot indicate the true neuronogenic potential. It is important to note that a demonstration of electrophysiological activity, i.e., AP, is required to confirm the neuronal phenotype. It has been reported that morphological changes into neural-like cells in vitro during guided neural differentiation may be the result of cell shrinkage and actin cytoskeleton retraction in response to chemical stress of the component in the medium 33. In our studies of OSCs, some neuronal markers such as βIII-tubulin and NFM are already expressed in unstimulated OSCs, BMMSCs and even DFs, which indicate that neural gene expression is not a good indicator for neuronal function.
By examining the various protocols employed by investigators, we found that in terms of the component used in the induction process, growth factor bFGF is universally employed, followed by EGF which is frequently included. The chemicals that facilitate neurogenesis, such as retinoic acid, dibutyryl cAMP and forskolin are frequently added into the neural induction medium 19–22,34,35. The neuron culturing medium Neurobasal A plus B27 and/or N2 that contains a mixture of growth factors and chemicals is also commonly used as the component for MSC neurogenesis 19,21,22. Besides such a variation of neurogenic protocols, we also noticed the variability of cell responses from different donors. Together, these may be the reasons for the difficulty in characterizing MSC neuronogenic potential and obtaining consistent results. It is also not straightforward to dissect why some protocols do not yield electrophysiologically functional neurons from MSCs. In our present study, it appeared that the optimally designed neurosphere-mediated method is the method of choice to derive neuronal cells from MSCs. This method has two stages as described. The first stage appeared to function as guiding the MSCs into NSC-like cells via the neurosphere process and the cells displayed NSC-like morphologies and marker expression. In terms of NSC markers, nestin was already largely expressed and SOX1 considerably expressed in DPSCs and GMSCs in non-stimulated state. As for PAX6, although we detected protein expression, the mRNA expression was very low. It also reduced after neurogenic induction. Possibly it was due to a small subpopulation of cells having different kinetics during the process of neuronogenesis which requires further investigation.
Regarding non-neurosphere- vs neurosphere-mediated approach, no evidence can allow us to conclude which approach is more conducive of producing functional neurons in vitro. The culturing of NSCs using neurosphere approaches has been well-established for studying neurogenic process 36,37. It seems logical to adopt neurosphere method for non-NSC cell types for neuronogenesis. In our present study, the failure of our initial attempt using a neurosphere assay (method-1) 36,38, which has been used for neurogenesis from NSCs, could be due to the insufficient induction time. The neurosphere method-2 we employed was modified based on several reports 19,39,40 and it did not give rise to neural-like cells morphologically. The presence of EGF and bFGF in the stage-2 induction might have affected the neurogenesis. The neurosphere method-3 22 appeared to have the combination of the right components and the right timing which gave rise to functional neuronal cells.
Of important note, the neuronogenic induction methods caused certain levels of cell loss/death during the process and there were quite some variations among different cell donors. The non-neurosphere NDM-C had the most inconsistency during the process. Frequently, cell death occurred after 1–2 weeks of induction, although many cells showed morphologically neural-like. As for the neurosphere-mediated method-3, approximately 2 weeks into the maturation stage many cells seeded onto glass coverslips began to detach or underwent cell death, although this phenomenon was less observed when cells were seeded onto plastic culture wells. One possibility is the presence of insulin in the neurogenic differentiation medium which has been shown to cause apoptotic cell death of human NSCs and neurons in cultures at certain doses 41. However, because the concentration of insulin in B27 is not available to the public and there is a wide range of difference in the insulin concentrations used in different protocols, it is difficult to link the cell death phenomenon observed in our studies to insulin.
In principle, easily accessible cell types able to undergo guided-neurogenic differentiation are an ideal cell source. NSCs and BMMSCs are not feasible cell sources. Furthermore, our present studies indicate that DPSCs which can be acquired from discarded teeth or GMSCs which can be easily obtained from oral mucosa, are more potent in neurogenesis than other cells types tested, especially the non-oral cell types. Gingival or oral mucosa harbors potent MSCs that may be used for various medical applications 16,42. Although no clinical trials on humans have been recorded using OSCs for treating injury or diseases in the central or peripheral nervous system, considerable number of reports have shown that DPSCs can promote neural regeneration in rodent models (See review by Luo et al, 2018 43).
It was proposed that induced neuronal cells should display neuronal morphology, express neuron-specific gene products and exhibit electrophysiological functions including action potentials and synaptic transmission 44. Our patch-clamp studies did not observe synaptic AP activity and the overall electrophysiological properties were not as strong as what we found in iPSC-derived neuronal cells reported previously 26. Nonetheless, our findings further support the versatile properties of DPSCs and GMSCs that they could be a good source of neuronal cells. Future study should explore whether there are more potent neuronogenic subpopulations present in these OSCs. If so, using these subpopulations may improve the percentage of derived functional neuronal cells giving rise to more mature neurons and displaying better electrophysiological properties. Subsequently, these properties can be determined by in vivo experiments. The recent discovered small molecules 45 that seem to enhance the neurogenic induction medium to directly convert fibroblasts into neurons should also be tested to determine whether they can more easily guide these OSCs into functional neurons.
Supplementary Material
RT-PCR analysis of the expression of neural markers at day 0 (before induction). Donor information is the same as that in Fig. 2.
qPCR analysis of non-neurosphere mediated neurogenic induction (NDM-C). Representative data measured in triplicate showing various neurogenic gene expression in OSCs and BMMSCs at 0, 7, 21 and 35 days following induction. OSCs: DPSCs (donor: 18-yr female, passage 3); SCAP (donor: 17 yr female, p3); GMSCs. (donor: 53 yr male, p4). BMMSCs (20 yr male, p4). (Donors were different from those presented in Fig. 2)
Immunofluorescence analysis after neurogenic induction (NDM-C) for 21–35 days. Top panel: Oral stem cells including DPSCs, SCAP and GMSCs (GMSCs from A and B two donors). Bottom panel: Non-OSCs including BMMSCs, FFs and DFs. Genes tested included neural genes nestin, βIII-tubulin, NFM, Nav1.6 and CNPase. Scale bar: DPSCs, all 50 μm; SCAP, all 100 μm; GMSCs and BMMSCs, all 50 μm; DF, nestin, 100 μm; NFM, 200 μm; Nav1.6, 50 μm.
Neurosphere formation and differentiation of DPSCs (Method-1). Upper panel: (A, B) DPSC-derived neurospheres after 3 days cultured in NDM-1 stage-1. (C) Neural differentiation of DPSC-derived neurosphere on day 2 (NDM-1 stage-2). (D) After 6 days of neural differentiation (NDM-1 stage-2), fibroblast-like cells became confluent in the central area of neurospheres. Lower panel: A few cells with long processes could be seen in the peripheral area of neurospheres, while the cell bodies were not spheroidal. Immunofluorescence staining showing βIII-tubulin-positive cells (red). DAPI: nuclear stain. Mouse IgG serves as the negative control. Scale bar: all the scale bars are 100 μm, except in (D), 500 μm.
Neurogenesis of human DPSC neurospheres on low-attachment and adherent plates under low and normal oxygen conditions (Method-2). (A) Formation of primary (72 h) DPSC neurospheres under normoxic and hypoxic conditions at stage-1 (non-adherent images on left). Representative images of neurospheres cultured on adherent plates after 7 days (middle) and 12 days (right) with neurodifferentiation medium (stage-2). Similar cell morphological characteristics are observed in both normoxic and hypoxic plates. Scale bar 100μm. (B) Immunofluorescence analysis of neural markers. Cultured DPSC neurospheres were induced with neurodifferentiation media for 12 days under normoxic or hypoxic conditions. DAPI: nuclear stain; βIII-tubulin: neuronal-specific marker (green); GFAP: astrocyte-specific marker (red); Merged image with all three fields. Scale bars: 100 μm.
Neurosphere-mediated neuronogenesis (Method-3) of human GMSCs. Neurospheres formed under neural induction stage for 6–8 days as the spheres increased in size over time (stage-1). Representative images of late phase (day 6). After which, spheres were seeded onto poly-l-ornithine/laminin coated glass coverslips or culture wells and stimulated under neural maturation medium for ~4 weeks (stage-2). The cells gradually showed spherical cell body and axon-like extensions over time. Representative images showing early phase (day 4) and late phase (day 28). Control: non-stimulated. Scale bars: Top panel, 500 μm (left 2 images,) 100 μm (right 2 images). Bottom panel, 100 μm (left 2 images), 50 μm (right 2 images).
Neurosphere-mediated neuronogenesis (Method-3) of GMSCs. After stage-1 neurosphere step, the spheres were seeded onto wells of a 24-well plate under stage-2 NMM. Selected locations of the attached spheres were imaged consecutively starting at day 1 throughout the maturation period. The images were combined into a video format. Two locations each contains a single cell were traced (red and green box) backward from day 28 to day 1. From day 28 to 17, the same cell was recognized and traced. Days before the 17th day, the same cells were not easily recognized due to migration or crowdedness of cells.
Acknowledgments
The authors thank Dr. Kristen O’Connell (UTHSC) for her assistance during the early developmental stage of the project; Dr. Rebeca Caires Mugarra (UTHSC) for initial assistance in the patch-clamp studies; and UTHSC Biostatistic BERD Consulting Program for statistical support.
• Funding: This work was supported in part by grants from the National Institutes of Health R01 DE019156 (G.T.-J.H.), AHA 15SDG25700146 (J.F.C.), National Institutes of Health R01 GM125629–01 (J.F.C-M) and a Research Fund from the University of Tennessee Health Science Center (G.T.-J.H.).
List of abbreviations
- AP
action potential
- BM
bone marrow
- BSA
bovine serum albumin
- DAPI
4’,6-diamidino-2-phenylindole dihydrochloride
- DFs
human dermal fibroblasts
- DPSCs
dental pulp stem cells
- FFs
Human foreskin fibroblasts
- GMSCs
gingiva-derived mesenchymal stem cells
- hESC
human embryonic stem cell
- iPSCs
induced pluripotent stem cells
- MSCs
Mesenchymal stromal/stem cells
- NDM
neural differentiation medium
- NMM
neurogenic maturation medium
- NSC
neural stem/progenitor cell
- OSCs
oral stem cells
- PD
population doubling
- qPCR
quantitative real-time polymerase chain reaction
- SCAP
stem cell of apical papilla
Footnotes
• Conflict of Interest: The authors declare no potential conflicts of interest.
Declarations
• Ethics approval and consent to participate: To be discarded extracted teeth were collected from Clinics at Boston University (BU) and University of Tennessee Health Science Center (UTHSC) based on exempt protocols approved by the respective Medical Institutional Review Board (BU: #H-28882; and UTHSC:#12–01937-XM).
• Consent for publication: This manuscript has been approved by all authors and is solely the work of the authors named.
• Availability of data and material: All data and information of the materials relevant to this project are available upon request. Cell lines established and used in the project will be available upon request.
• Competing interests: The authors declare that they have no competing interests
Reference
- 1.Tondreau T, Dejeneffe M, Meuleman N, et al. Gene expression pattern of functional neuronal cells derived from human bone marrow mesenchymal stromal cells. BMC Genomics 2008;9:166. [DOI] [PMC free article] [PubMed] [Google Scholar]
- 2.Shiota M, Heike T, Haruyama M, et al. Isolation and characterization of bone marrow-derived mesenchymal progenitor cells with myogenic and neuronal properties. Exp Cell Res 2007;313:1008–23. [DOI] [PubMed] [Google Scholar]
- 3.Pittenger MF, Mackay AM, Beck SC, et al. Multilineage potential of adult human mesenchymal stem cells. Science 1999;284:143–7. [DOI] [PubMed] [Google Scholar]
- 4.Cho KJ, Trzaska KA, Greco SJ, et al. Neurons derived from human mesenchymal stem cells show synaptic transmission and can be induced to produce the neurotransmitter substance P by interleukin-1 alpha. Stem Cells 2005;23:383–91. [DOI] [PubMed] [Google Scholar]
- 5.Greco SJ, Zhou C, Ye JH, Rameshwar P. An interdisciplinary approach and characterization of neuronal cells transdifferentiated from human mesenchymal stem cells. Stem Cells Dev 2007;16:811–26. [DOI] [PubMed] [Google Scholar]
- 6.Sakai K, Yamamoto A, Matsubara K, et al. Human dental pulp-derived stem cells promote locomotor recovery after complete transection of the rat spinal cord by multiple neuro-regenerative mechanisms. J Clin Invest 2012;122:80–90. [DOI] [PMC free article] [PubMed] [Google Scholar]
- 7.Hofstetter CP, Schwarz EJ, Hess D, et al. Marrow stromal cells form guiding strands in the injured spinal cord and promote recovery. Proceedings of the National Academy of Sciences 2002;99:2199–204. [DOI] [PMC free article] [PubMed] [Google Scholar]
- 8.Joyce N, Annett G, Wirthlin L, Olson S, Bauer G, Nolta JA. Mesenchymal stem cells for the treatment of neurodegenerative disease. Regen Med 2010;5:933–46. [DOI] [PMC free article] [PubMed] [Google Scholar]
- 9.Vierbuchen T, Ostermeier A, Pang ZP, Kokubu Y, Sudhof TC, Wernig M. Direct conversion of fibroblasts to functional neurons by defined factors. Nature 2010;463:1035–41. [DOI] [PMC free article] [PubMed] [Google Scholar]
- 10.Marro S, Pang ZP, Yang N, et al. Direct lineage conversion of terminally differentiated hepatocytes to functional neurons. Cell Stem Cell 2011;9:374–82. [DOI] [PMC free article] [PubMed] [Google Scholar]
- 11.Chai Y, Jiang X, Ito Y, et al. Fate of the mammalian cranial neural crest during tooth and mandibular morphogenesis. Development 2000;127:1671–9. [DOI] [PubMed] [Google Scholar]
- 12.Karaoz E, Demircan PC, Saglam O, Aksoy A, Kaymaz F, Duruksu G. Human dental pulp stem cells demonstrate better neural and epithelial stem cell properties than bone marrow-derived mesenchymal stem cells. Histochem Cell Biol 2011;136:455–73. [DOI] [PubMed] [Google Scholar]
- 13.Huang GTJ, Gronthos S, Shi S. Mesenchymal stem cells derived from dental tissues vs. those from other sources: their biology and role in regenerative medicine. J Dent Res 2009;88:792–806. [DOI] [PMC free article] [PubMed] [Google Scholar]
- 14.Tang L, Li N, Xie H, Jin Y. Characterization of mesenchymal stem cells from human normal and hyperplastic gingiva. J Cell Physiol 2011;226:832–42. [DOI] [PubMed] [Google Scholar]
- 15.Morsczeck C, Huang GT-J, Shi S. Stem and progenitor cells of dental and gingival tissue origin In: Huang GT-J, Thesleff I, eds. Stem Cells, Craniofacial Development and Regeneration. 1st ed. Hoboken, New Jersey: Wiley-Blackwell; 2013:285–302. [Google Scholar]
- 16.Zhang Q, Shi S, Liu Y, Uyanne J, Shi Y, Le AD. Mesenchymal stem cells derived from human gingiva are capable of immunomodulatory functions and ameliorate inflammation-related tissue destruction in experimental colitis. J Immunol 2009;183:7787–98. [DOI] [PMC free article] [PubMed] [Google Scholar]
- 17.Huang GTJ, Shagramanova K, Chan SW. Formation of odontoblast-like cells from cultured human dental pulp cells on dentin in vitro. J Endod 2006;32:1066–73. [DOI] [PubMed] [Google Scholar]
- 18.Tomar GB, Srivastava RK, Gupta N, et al. Human gingiva-derived mesenchymal stem cells are superior to bone marrow-derived mesenchymal stem cells for cell therapy in regenerative medicine. Biochem Biophys Res Commun 2010;393:377–83. [DOI] [PubMed] [Google Scholar]
- 19.Arthur A, Rychkov G, Shi S, Koblar SA, Gronthos S. Adult human dental pulp stem cells differentiate toward functionally active neurons under appropriate environmental cues. Stem Cells 2008;26:1787–95. [DOI] [PubMed] [Google Scholar]
- 20.Ebrahimi B, Yaghoobi MM, Kamal-abadi AM, Raoof M. Human dental pulp stem cells express many pluripotency regulators and differentiate into neuronal cells. Neural regeneration research 2011;6:2666–72. [Google Scholar]
- 21.Aanismaa R, Hautala J, Vuorinen A, Miettinen S, Narkilahti S. Human dental pulp stem cells differentiate into neural precursors but not into mature functional neurons. Stem Cell Discovery 2012;2:85–91. [Google Scholar]
- 22.Gervois P, Struys T, Hilkens P, et al. Neurogenic maturation of human dental pulp stem cells following neurosphere generation induces morphological and electrophysiological characteristics of functional neurons. Stem Cells Dev 2015;24:296–311. [DOI] [PMC free article] [PubMed] [Google Scholar]
- 23.Huang GTJ, Yamaza T, Shea LD, et al. Stem/progenitor cell–mediated de novo regeneration of dental pulp with newly deposited continuous layer of dentin in an in vivo model. Tissue Eng Part A 2009;16:605–15. [DOI] [PMC free article] [PubMed] [Google Scholar]
- 24.Al-Habib M, Yu Z, Huang GT. Small molecules affect human dental pulp stem cell properties via multiple signaling pathways. Stem Cells Dev 2013;22:2402–13. [DOI] [PMC free article] [PubMed] [Google Scholar]
- 25.Yan X, Qin H, Qu C, Tuan RS, Shi S, Huang GT. iPS cells reprogrammed from human mesenchymal-like stem/progenitor cells of dental tissue origin. Stem cells and development 2010;19:469–80. [DOI] [PMC free article] [PubMed] [Google Scholar]
- 26.El Ayachi I, Zhang J, Zou XY, et al. Human dental stem cell derived transgene-free iPSCs generate functional neurons via embryoid body-mediated and direct induction methods. J Tissue Eng Regen Med 2017. [DOI] [PMC free article] [PubMed] [Google Scholar]
- 27.Yu Z, Gauthier P, Tran QT, et al. Differential properties of human ALP+ periodontal ligament stem cells vs their ALP- counterparts. Journal of Stem Cell Research and Therapy 2015;5:292. [DOI] [PMC free article] [PubMed] [Google Scholar]
- 28.Schmittgen TD, Livak KJ. Analyzing real-time PCR data by the comparative CT method. Nat Protocols 2008;3:1101–8. [DOI] [PubMed] [Google Scholar]
- 29.Zou XY, Yang HY, Yu Z, Tan XB, Yan X, Huang GT. Establishment of transgene-free induced pluripotent stem cells reprogrammed from human stem cells of apical papilla for neural differentiation. Stem Cell Res Ther 2012;3:43. [DOI] [PMC free article] [PubMed] [Google Scholar]
- 30.Alongi DJ, Yamaza T, Song Y, et al. Stem/progenitor cells from inflamed human dental pulp retain tissue regeneration potential. Regen Med 2010;5:617–31. [DOI] [PMC free article] [PubMed] [Google Scholar]
- 31.Sonoyama W, Liu Y, Yamaza T, et al. Characterization of the Apical Papilla and Its Residing Stem Cells from Human Immature Permanent Teeth: A Pilot Study. J Endod 2008;34:166–71. [DOI] [PMC free article] [PubMed] [Google Scholar]
- 32.Djouad F, Jackson WM, Bobick BE, et al. Activin A expression regulates multipotency of mesenchymal progenitor cells. Stem Cell Res Ther 2010;1:11. [DOI] [PMC free article] [PubMed] [Google Scholar]
- 33.Lu P, Blesch A, Tuszynski MH. Induction of bone marrow stromal cells to neurons: differentiation, transdifferentiation, or artifact? J Neurosci Res 2004;77:174–91. [DOI] [PubMed] [Google Scholar]
- 34.Abe S, Yamaguchi S, Amagasa T. Multilineage cells from apical pulp of human tooth with immature apex. Oral Science International 2007;4:45–58. [Google Scholar]
- 35.Jang S, Cho HH, Cho YB, Park JS, Jeong HS. Functional neural differentiation of human adipose tissue-derived stem cells using bFGF and forskolin. BMC Cell Biol 2010;11:25. [DOI] [PMC free article] [PubMed] [Google Scholar]
- 36.Deleyrolle LP, Reynolds BA. Isolation, expansion, and differentiation of adult Mammalian neural stem and progenitor cells using the neurosphere assay. Methods Mol Biol 2009;549:91–101. [DOI] [PubMed] [Google Scholar]
- 37.Louis SA, Mak CK, Reynolds BA. Methods to culture, differentiate, and characterize neural stem cells from the adult and embryonic mouse central nervous system. Methods Mol Biol 2013;946:479–506. [DOI] [PubMed] [Google Scholar]
- 38.Singec I, Knoth R, Meyer RP, et al. Defining the actual sensitivity and specificity of the neurosphere assay in stem cell biology. Nat Methods 2006;3:801–6. [DOI] [PubMed] [Google Scholar]
- 39.Pardal R, Ortega-Saenz P, Duran R, Lopez-Barneo J. Glia-like stem cells sustain physiologic neurogenesis in the adult mammalian carotid body. Cell 2007;131:364–77. [DOI] [PubMed] [Google Scholar]
- 40.Morrison SJ, Csete M, Groves AK, Melega W, Wold B, Anderson DJ. Culture in reduced levels of oxygen promotes clonogenic sympathoadrenal differentiation by isolated neural crest stem cells. J Neurosci 2000;20:7370–6. [DOI] [PMC free article] [PubMed] [Google Scholar]
- 41.Rhee YH, Choi M, Lee HS, et al. Insulin concentration is critical in culturing human neural stem cells and neurons. Cell Death Dis 2013;4:e766. [DOI] [PMC free article] [PubMed] [Google Scholar]
- 42.Marynka-Kalmani K, Treves S, Yafee M, et al. The lamina propria of adult human oral mucosa harbors a novel stem cell population. Stem Cells 2010;28:984–95. [DOI] [PubMed] [Google Scholar]
- 43.Luo L, He Y, Wang X, et al. Potential Roles of Dental Pulp Stem Cells in Neural Regeneration and Repair. Stem Cells Int 2018;2018:1731289. [DOI] [PMC free article] [PubMed] [Google Scholar]
- 44.Yang N, Ng YH, Pang ZP, Sudhof TC, Wernig M. Induced neuronal cells: how to make and define a neuron. Cell Stem Cell 2011;9:517–25. [DOI] [PMC free article] [PubMed] [Google Scholar]
- 45.Hu W, Qiu B, Guan W, et al. Direct Conversion of Normal and Alzheimer’s Disease Human Fibroblasts into Neuronal Cells by Small Molecules. Cell Stem Cell 2015;17:204–12. [DOI] [PubMed] [Google Scholar]
References
- 1.Huang GT, T Yamaza, LD Shea, F Djouad, NZ Kuhn, RS Tuan and S Shi. (2010). Stem/progenitor cell-mediated de novo regeneration of dental pulp with newly deposited continuous layer of dentin in an in vivo model. Tissue Eng Part A 16:605–15. [DOI] [PMC free article] [PubMed] [Google Scholar]
- 2.Al-Habib M, Z Yu and GTJ Huang. (2013). Small Molecules Affect Human Dental Pulp Stem Cell Properties Via Multiple Signaling Pathways. Stem Cells and Development 22:2402–2413. [DOI] [PMC free article] [PubMed] [Google Scholar]
- 3.Yu Z, P Gauthier, QT Tran, I El Ayachi, F-U-R Bhatti, R Bahabri, M Al-Habib and GTJ Huang. (2015). Differential properties of human ALP+ periodontal ligament stem cells vs their ALP- counterparts. Journal of Stem Cell Research and Therapy 5:292. [DOI] [PMC free article] [PubMed] [Google Scholar]
- 4.Gervois P, T Struys, P Hilkens, A Bronckaers, J Ratajczak, C Politis, B Brone, I Lambrichts and W Martens. (2015). Neurogenic maturation of human dental pulp stem cells following neurosphere generation induces morphological and electrophysiological characteristics of functional neurons. Stem Cells Dev 24:296–311. [DOI] [PMC free article] [PubMed] [Google Scholar]
Associated Data
This section collects any data citations, data availability statements, or supplementary materials included in this article.
Supplementary Materials
RT-PCR analysis of the expression of neural markers at day 0 (before induction). Donor information is the same as that in Fig. 2.
qPCR analysis of non-neurosphere mediated neurogenic induction (NDM-C). Representative data measured in triplicate showing various neurogenic gene expression in OSCs and BMMSCs at 0, 7, 21 and 35 days following induction. OSCs: DPSCs (donor: 18-yr female, passage 3); SCAP (donor: 17 yr female, p3); GMSCs. (donor: 53 yr male, p4). BMMSCs (20 yr male, p4). (Donors were different from those presented in Fig. 2)
Immunofluorescence analysis after neurogenic induction (NDM-C) for 21–35 days. Top panel: Oral stem cells including DPSCs, SCAP and GMSCs (GMSCs from A and B two donors). Bottom panel: Non-OSCs including BMMSCs, FFs and DFs. Genes tested included neural genes nestin, βIII-tubulin, NFM, Nav1.6 and CNPase. Scale bar: DPSCs, all 50 μm; SCAP, all 100 μm; GMSCs and BMMSCs, all 50 μm; DF, nestin, 100 μm; NFM, 200 μm; Nav1.6, 50 μm.
Neurosphere formation and differentiation of DPSCs (Method-1). Upper panel: (A, B) DPSC-derived neurospheres after 3 days cultured in NDM-1 stage-1. (C) Neural differentiation of DPSC-derived neurosphere on day 2 (NDM-1 stage-2). (D) After 6 days of neural differentiation (NDM-1 stage-2), fibroblast-like cells became confluent in the central area of neurospheres. Lower panel: A few cells with long processes could be seen in the peripheral area of neurospheres, while the cell bodies were not spheroidal. Immunofluorescence staining showing βIII-tubulin-positive cells (red). DAPI: nuclear stain. Mouse IgG serves as the negative control. Scale bar: all the scale bars are 100 μm, except in (D), 500 μm.
Neurogenesis of human DPSC neurospheres on low-attachment and adherent plates under low and normal oxygen conditions (Method-2). (A) Formation of primary (72 h) DPSC neurospheres under normoxic and hypoxic conditions at stage-1 (non-adherent images on left). Representative images of neurospheres cultured on adherent plates after 7 days (middle) and 12 days (right) with neurodifferentiation medium (stage-2). Similar cell morphological characteristics are observed in both normoxic and hypoxic plates. Scale bar 100μm. (B) Immunofluorescence analysis of neural markers. Cultured DPSC neurospheres were induced with neurodifferentiation media for 12 days under normoxic or hypoxic conditions. DAPI: nuclear stain; βIII-tubulin: neuronal-specific marker (green); GFAP: astrocyte-specific marker (red); Merged image with all three fields. Scale bars: 100 μm.
Neurosphere-mediated neuronogenesis (Method-3) of human GMSCs. Neurospheres formed under neural induction stage for 6–8 days as the spheres increased in size over time (stage-1). Representative images of late phase (day 6). After which, spheres were seeded onto poly-l-ornithine/laminin coated glass coverslips or culture wells and stimulated under neural maturation medium for ~4 weeks (stage-2). The cells gradually showed spherical cell body and axon-like extensions over time. Representative images showing early phase (day 4) and late phase (day 28). Control: non-stimulated. Scale bars: Top panel, 500 μm (left 2 images,) 100 μm (right 2 images). Bottom panel, 100 μm (left 2 images), 50 μm (right 2 images).
Neurosphere-mediated neuronogenesis (Method-3) of GMSCs. After stage-1 neurosphere step, the spheres were seeded onto wells of a 24-well plate under stage-2 NMM. Selected locations of the attached spheres were imaged consecutively starting at day 1 throughout the maturation period. The images were combined into a video format. Two locations each contains a single cell were traced (red and green box) backward from day 28 to day 1. From day 28 to 17, the same cell was recognized and traced. Days before the 17th day, the same cells were not easily recognized due to migration or crowdedness of cells.