

Abstract
Multiplexing strategies are at the forefront of mass-spectrometry-based proteomics, with SPS-MS3 methods becoming increasingly commonplace. A known caveat of isobaric multiplexing is interference resulting from coisolated and cofragmented ions that do not originate from the selected precursor of interest. The triple knockout (TKO) standard was designed to benchmark data collection strategies to minimize interference. However, a limitation to its widespread use has been the lack of an automated analysis platform. We present a TKO Visualization Tool (TVT). The TVT viewer allows for automated, web-based, database searching of the TKO standard, returning traditional figures of merit, such as peptide and protein counts, scan-specificion accumulation times, as well as the TKO-specific metric, the IFI (interference-free index). Moreover, the TVT viewer allows for plotting of two TKO standards to assess protocol optimizations, compare instruments, or measure degradation of instrument performance over time. We showcase the TVT viewer by probing the selection of (1) stationary phase resin, (2) MS2 isolation window width, and (3) number of synchronous precursor selection (SPS) ions for SPS-MS3 analysis. Using the TVT viewer will allow the proteomics community to search and compare TKO results to optimize user-specific data collection workflows.
Keywords: TKO standard, ion interference, TMT, iTRAQ, SPS-MS3, TVT, shiny application
Graphical Abstract
INTRODUCTION
Isobaric tag-based multiplexing can suffer from ratio compression due to ions that are coisolated and cofragmented with the precursor of interest. The development of the TKO standard facilitated the quantification of ion interference in isobaric labeling experiments.1–3 In the TKO9-plex standard, three yeast deletion strains featuring knockouts of Met6, Pfk2 or Ura2 proteins are present in triplicate. These proteins and associated peptides are absent in three TMT channels, and, as such, the presence of TMT reporter ion signal in a “knockout channel” indicates instrument noise or ion interference. As previously described, we assessed ion interference by calculating the interference-free index (IFI). A score of 1 reflects no interference, and it follows that as the degree of interference increases, IFI decreases.1
The TKO standard provides a metric of interference. However, analyzing this standard had not been automated. Plotting relative abundances of TKO peptides and calculating the interference-free indices required additional computational effort, thereby limiting the utility and acceptance of the standard. More recently, a commercial variant of the TKO standard has been released with two minor differences: (1) the addition of two wildtype yeast channels (creating a TMT11 plex) and (2) the substitution of the His4 deletion strain (in place of the slow-growing Pfk2 strain). Notwithstanding, the potential of the TKO standard remained hindered by the need for manual analysis of the acquired data, a process that may differ from laboratory to laboratory.
Here we present a user-friendly, web-based, TKO-specific application called the TKO Visualization Tool (TVT). This viewer permits quick and efficient analysis of the TKO standard, thereby assessing data quality via a universal pipeline across instruments and laboratories. Simply dragging the RAW file into a web browser initiates a predefined Sequest2 search that produces plots and tables for TKO-specific data in addition to standard figures of merit. The TVT viewer is versatile enough to accommodate the initial TKO9-plex, the commercial TKO11-plex, or any customized yeast deletion strain TKO variant. We foresee the TVT viewer as a necessary tool for expanding the usage of the TKO standard.
We aimed to showcase the TVT viewer with three optimization experiments aiming to decrease ion interference and maximize proteome depth. We compared column stationary phases, isolation widths, and the number of synchronous precursor selection (SPS) ions. These are merely three of many parameters that impact ion interference, as numerous parameters may be tested. The TVT viewer allows effortless database search and comparison of data across instruments, the tracking of instrument performance over time, and further optimization of experimental workflows.
EXPERIMENTAL SECTION
Mass Spectrometry
Unfractionated yeast TKO standard was prepared as previously described.1 The protocol is based on SL-TMT sample processing, with the omission of the high-pH reversed-phase fractionation performed prior to LC–MS3 analysis.4 Mass-spectrometric data were collected on an Orbitrap Fusion Lumos mass spectrometer in-line with a Proxeon NanoLC-1200 UHPLC. Two C18 resins were compared as stationary phases in 100 μm inner diameter (ID) flame-pulled, fritless-tip, fused silica microcapillary columns. The 1.8 μm-bead capillary column was packed with 0.5 cm of Magic C4 resin (5 μm, 100 Å, Michrom Bioresources), followed by 30 cm of GP-18 resin (1.8 μm, 120 Å, Sepax, Newark, DE). The 2.6 μm-bead capillary column was packed with 30 cm of Accucore 150 resin (2.6 μm, 150 Å; ThermoFisher Scientific). Alterations in data collection from the SL-TMT method, specifically changes in isolation window width and the number of SPS ions chosen, are mentioned in the Results and Discussion section. Each analysis was of 0.5 μg of TKO-peptide standard over a 150 min gradient. Peptides were separated using gradients of 6 to 26% acetonitrile in 0.125% formic acid at a flow rate of ~500 nL/ min. The scan sequence began with an MS1 spectrum (Orbitrap analysis, resolution 120 000, 350–1400 Th, automatic gain control (AGC) target 5E5, maximum injection time 100 ms). The top 10 precursors were then selected for MS2/MS3 analysis. MS2 analysis consisted of: collision-induced dissociation (CID), quadrupole ion trap analysis, AGC 2E4, NCE (normalized collision energy) 35, maximum injection time 120 ms, and isolation window at 0.7. Following the acquisition of each MS2 spectrum, we collected an MS3 spectrum in which multiple MS2 fragment ions are captured in the MS3 precursor population using isolation waveforms with multiple frequency notches. MS3 precursors were fragmented by HCD and analyzed using the Orbitrap (NCE 65, AGC 1.5E5, maximum injection time 150 ms, resolution of 50 000 at 200 Th, and isolation window of 1.2). The acquired RAW files were analyzed using the TVT viewer web interface.
TKO Visualization Tool (TVT)
The TVT viewer is an R Shiny application that can be used without knowledge of the R programming language through a simple web browser interface. The input is a RAW file from an Orbitrap-based mass spectrometer. Importantly, as the TVT viewer was designed only for TMT-labeled yeast TKO analysis, the search parameters are preset and cannot be altered by the end user. Mass spectra were processed using a Sequest-based software pipeline.5 Database searching included all entries from the yeast SGD (Saccharomyces Genome Database) (March 20, 2016), concatenated with one composed of all protein sequences in the reversed order. Searches were performed using a 50 ppm precursor ion tolerance. The product ion tolerance was set to 0.9 Da for ion-trap-based MS2 or 0.03 Da for Orbitrap-based MS2 scans. TMT tags on lysine residues and peptide N termini (+229.163 Da) and carbamidomethylation of cysteine residues (+57.021 Da) were set as static modifications, whereas oxidation of methionine residues (+15.995 Da) was set as a variable modification.
Peptide-spectrum matches (PSMs) were adjusted to a 1% false discovery rate (FDR).6,7 PSM filtering was performed using a linear discriminant analysis, as previously described,5 while considering the following parameters: XCorr, ΔCn, missed cleavages, peptide length, charge state, and precursor mass accuracy. For TMT-based reporter ion quantitation, we extracted the signal-to-noise (S:N) ratio for each TMT channel and found the closest matching centroid to the expected mass of the TMT reporter ion. PSMs were identified, quantified, and collapsed to a 1% peptide FDR and then collapsed further to a final protein-level FDR of 1%. Moreover, protein assembly was guided by principles of parsimony to produce the smallest set of proteins necessary to account for all observed peptides. Peptide intensities were quantified by summing reporter ion counts across all matching PSMs.8,9 PSMs with poor quality, with MS3 spectra with TMT reporter summed signal-to-noise measurements that were <200, or with no MS3 spectra were excluded from quantitation. Isolation specificity of ≥0.8 (i.e., peptide purity >80% at the MS1 level) was required.9
The TVT viewer can also process postsearch data using a standard text file as input (e.g., the output from MaxQuant10 or Proteome Discoverer). Input files for “TVT-lite” require the following columns in this order: protein identifier (e.g., UniProt accession or gene name), peptides, and 9 or 11 columns of TMT measurements. These links are at the bottom of the TVT File Uploader, along with an example input file. Using TVT-lite output is limited to the TKO-specific data and does not include the additional figures of merit, as can be obtained by uploading the RAW file and performing the online Sequest search. An example RAW file is available on the front page of the TVT viewer. The mass spectrometry proteomics data have been deposited to the ProteomeXchange Con-sortium via the PRIDE11 partner repository with the data set identifier PXD011654.
RESULTS AND DISCUSSION
The TVT viewer was designed to streamline and automate the TKO analysis process while providing valuable data on instrument performance via traditional figures of merit. A simple flow diagram illustrates the sample processing workflow (Figure 1A) in addition to the equation for the IFI (Figure 1B). As input, the user uploads a RAW file and enters an e-mail address through the “TVT File Uploader” Web site. The RAW file is then searched with preset parameters. Once the search is completed, the user will be sent a hyperlink by e-mail, which opens the TVT Homepage. Below, we highlight several features of the TVT viewer.
Figure 1.

TVT overview. (A) The TVT workflow begins when a RAW file is uploaded to the “TVT file uploader”.1 The user provides an e-mail address, and following the analysis, an e-mail sends a link to the “TVT Homepage”.2 The end user can navigate through tabs that are specific to TKO proteins or unchanging proteins, an interactive IFI plot, instrument performance data, and an instrument performance comparison. (B) Equation for the IFI for the TKO9-plex standard.
TVT File Uploader
A RAW file must be uploaded, and a contact e-mail address provided to fully utilize the instrument performance output. Once a RAW file has been uploaded and the data searched (5 to 10 min), an e-mail message with a unique search identifier and a hyperlink to the data will be sent to the provided e-mail address. In lieu of a RAW file, postsearch TKO9 or TKO11 data sets can be uploaded (in the form of a tab- or comma-delimited file) via hyperlinks located on the TVT File Uploader page. The limitation of this text file upload method is that the end user is capable of viewing only TKO quantification data and no further figures of merit. The URL for the uploader is https://elk.med.harvard.edu/gfy/www/modules/single_standard/ or http://TKOmics.com.
TVT Homepage
The TVT Homepage offers a summary of the unfiltered data, including the number of total peptides, unique peptides and proteins, and links to several other tabs. The data can be explored further by selecting provided options, including a TKO peptide table, TKO abundance graphs, an interactive IFI scatter plot, graphs for unchanging proteins, and general instrument performance. The “Settings” tab allows for some parameters to be altered. For example, peptide filters that set a minimum isolation purity threshold (default: 0.8) and summed signal-to-noise cutoff (default: 200) can be modified. In addition, the Settings tab allows the identity of the TKO proteins to be changed. For example, this feature is useful as the second TKO protein differs between the classic TKO9 and commercial TKO11 standard (i.e., Pfk2 was replaced with His4). In addition, the customizability of the TKO proteins allows for novel application-specific standards (such as a phosphoprotein-centric TKO standard) to use this Shiny application.
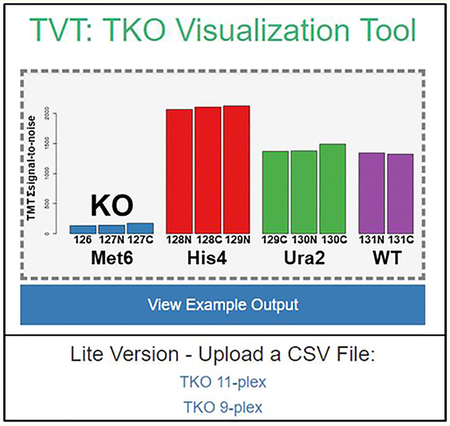
The “TKO Peptide Table” includes columns denoting protein names, peptide sequences, and TMT signal-to-noise values. As default, only peptides from the three TKO proteins are displayed, but unchecking the “Only Show TKO” option allows visualization of the full data set. The “TKO Graphs” tab provides three bar graphs, each representing a TKO protein with TMT channels along the x axis and TMT summed signal-to-noise values along the y axis (Figure 2). A scatterplot of the individual peptides associated with each protein and their IFI values is located at the bottom of this page. This graph is replicated, but with additional functionality, in the “Interactive IFI Graph” tab. Here hovering over any data point in this scatterplot shows the corresponding peptide sequence, the TMT summed signal-to-noise values, and the IFI value to seamlessly identify outlying peptides.
Figure 2.

Example output for TKO quantification and analysis. This screen capture is representative of both the “KO Graphs” and “Unchanging Protein Graphs” tabs. The TMT relative abundance graphs (A–C and E–G) display each channel with the corresponding TMT summed signal-to-noise across all filtered peptides. A “knockout” is evident in the three KO proteins for this run (MET6, HIS4, URA2) as opposed to the unchanging proteins (ENO2, PGK1, RPL10). D) The IFI for all TKO peptides are plotted, as are H) the CV for the three selected “unchanging proteins.”
We note that the IFI was calculated differently depending on whether the TKO9 or TKO11-plex was used. For the TKO9-plex, the IFI is calculated as the difference from one of the average TMT signal-to-noise values from the KO channels (e.g., for Met6:126, 127N, and 127C) divided by the average TMT signal-to-noise of the other six channels, whereas for an 11-plex, the denominator used was the average of the final two (wildtype yeast) channels (131 and 131C). In both cases, an IFI score of 1 reflected no interference, with decreasing values indicative of increasing interference.
In addition to visualizing data for the TKO proteins, we included a tab that can be used to track proteins that do not change in abundance across channels, which we have termed “Unchanging Proteins.” These proteins were deemed “unchanging” because they demonstrated consistently low CVs (coefficients of variation) across multiple TKO analyses. The TKO tables and graphs are modified to represent the unchanging proteins, the identities of which may be changed using the “Settings” tab. The IFI scatter plot has been replaced by a CV scatterplot for these “unchanging proteins.”
The “Instrument Performance” tab highlights multiple instrument performance figures of merit (Figure 3). We note that these data are available only when the RAW file is uploaded into the TVT viewer and are not offered for the text file upload option. The Instrument Performance data were presented in a table as well as in a series of graphs. The parameters included chromatographic peak width, PPM, a base peak chromatogram, the number matched MS2 per second, XCorr, TMT summed signal-to-noise, MS2 and MS3 ion injection times, precursor max intensity, ΔCn, the number of missed cleavages, isolation specificity (isolation purity), and PPM versus retention time. The histograms include a small table with the mean, median, minimum, maximum, and standard deviation.
Figure 3.

Example output for general instrument performance (a screen capture of the “Instrument Performance” tab). Visual representations of the following figures of merit are included in the output: (A) peak width (chromatographic integrity), (B) PPM mass error (mass accuracy), (C) base peak chromatogram, (D) precursor max intensity, (E) ΔCn, (F) missed cleavages, (G) isolation specificity, (H) number of matched MS2 spectra collected per second, (I) XCorr, (J) TMT summed signal-to-noise for reporter ions, (K) MS2 and (L) MS3 ion injection times, and (M) PPM versus retention time.
A unique identifier (search identification number) is provided on the “Instrument Performance” tab for every analysis. This identifier was included in the e-mail with the link to the data. This number can be used for comparisons between standards. Once the TVT viewer has analyzed multiple RAW files, the unique search identifiers can be used to compare instrument performance between two raw files in the “Instrument Performance Comparison” tab (Supplemental Figure 1). This comparison was displayed as side-by-side boxplots with the current data on the left and the data from a previous analysis on the right. As such, figures of merit can be compared, for example, before and after instrument maintenance or between two different instruments. Future updates will allow for more than two comparisons.
Examples of Optimizing the Instrument Performance Using the TKO9 Standard and TVT Viewer
We used the TVT viewer to analyze a series of RAW files from the TKO9 standard to assess how stationary phase resins, MS2 isolation width, and the number of SPS ions influence proteome depth and limit ion interference. First, we compared 1.8 μm porous and 2.6 μm solid-core C18 resins, noting differences in peak width, quantified peptides, and ion interference. Our data showed that the smaller bead size resulted in narrower peak widths (Figure 4A). Interestingly, this improvement did not translate into more quantified peptides (Figure 4B). In fact, under all conditions tested, the 2.6 μm solid-core resin produced the most quantified peptides. Next, we compared three MS2 isolation windows using the TKO9 as our standard. Our data showed that decreasing the isolation width resulted in less interference (Figure 4C,D) and marginally increased peptide identifications (Figure 4B). Finally, we assessed the degree of interference by varying the number of SPS ions, that is, selecting 3, 6, or 10 SPS ions. We observed a slightly lower number of quantified peptides when fewer SPS ions were chosen (Figure 4B), which can be mainly attributed to the lower reporter ion signal. Coincidentally, IFI had a tighter distribution when fewer SPS ions were selected. However, selecting more SPS ions resulted in marginally higher interference but did not significantly impair quantification accuracy, which was in stark contrast with MS2-based quantification (Figure 4C,D). More specifically, the median IFI values across all numbers of SPS ions tested were above 0.95, whereas MS2-based quantification had a median value of ~0.75 and a wider distribution. To summarize, analyzing the TKO standard using the TVT viewer allowed us to quickly and effortlessly screen alterations in analytical parameters. From these data, we achieved similar results regardless of beads used, isolation width, or number of SPS ions. Regarding the beads, unique peptide species are expected to be better resolved with smaller diameter beads. Although relatively subtle, we note the tails toward low IFI in the distributions of the 2.6 μm beads compared with the 1.8 μm beads. The gains were minimal for all parameters except for the comparison of MS2- versus SPSMS3-based data acquisition strategies. Our data support that the increased number of quantified peptides in MS2-only quantification is offset by increased interference. Further studies are needed to better generalize the benefits and overcome the caveats of each method.
Figure 4.

Investigating critical SPS-MS3 parameters using the TVT viewer. (A) Dot plot displaying the median peak width of 20 SPS-MS3 analyses per bead type. (B) Bar graph illustrating the number of total quantified peptides using different parameters. More specifically: columns packed with 1.8 and 2.6 μm diameter bead resins; 3, 6, and 10 SPS ions; MS2 isolation widths 0.4, 0.7, and 1.2. Note that MS2-based quantitation is included (last two bars). A 1% peptide and protein FDR is implemented, and peptides are filtered with a minimum summed reporter S/N of 100 and an isolation specificity of 0.7. Bars represent mean ± standard deviation. IFIs for MET6 are plotted for columns packed with either (C) 1.8 or (D) 2.6 μm diameter beads.
CONCLUSIONS
The TKO viewer tool is a valuable companion software to the TKO standard. We described the versatility of the TVT viewer to analyze two variants of the TKO standard (TKO9 and TKO11). This Shiny application facilitated automated, web-based, database searching of the TKO standard, and results are generated in approximately 5–10 min. The TVT viewer provides TKO-specific metrics in addition to traditional figures of merit, such as peptide and protein counts and scan-specific ion accumulation times with minimal user input. We analyzed the TKO standard with the TVT viewer to evaluate the effects of stationary phase resin, MS2 isolation window width, and the number of SPS ions for SPS-MS3 analyses. We caution that each mass spectrometer and liquid chromatography system has its own idiosyncrasies, and what is optimal for one does not generalize for all. However, the TKO and TVT viewer can be used on any instrument to screen for interference and generate the necessary metrics to assess and benchmark instrument performance. We envision the application of this pipeline to numerous other parameter optimizations to enhance proteomic depth and quantitative data quality. In its current form, the TVT viewer is limited to yeast database searching, albeit by design to promote the use of the TKO standard, but we note how a similar Shiny application can be used for the analysis of virtually any standard. For example, a more peptide-complex mammalian-based TKO standard may be constructed using CRISPR-CAS9 gene editing technology. The TVT can be readily updated so as to enable similar analysis, as generated with the TKO standard. In summary, the TVT viewer permits standardized, rapid analysis and visualization of TKO data while evaluating instrument performance with minimal user input.
Supplementary Material
ACKNOWLEDGMENTS
We thank the members of the Gygi Lab at Harvard Medical School for invaluable discussion. We also thank the members of ThermoFisher Scientific, in particular, John Rogers, Rosa Viner, Jae Choi, Ryan Bomgarden, and Aaron Robitaille, for valuable discussion and early access to the commercially available Pierce Yeast TKO11-plex interference standard. This work was funded in part by an NIH/NIDDK grant K01 DK098285 (J.A.P.) and GM97645 (S.P.G.).
Supporting Information
The Supporting Information is available free of charge on the ACS Publications website at DOI: 10.1021/acs.jproteome.8b00737.
Figure S1: Comparing two TKO11 analyses (PDF)
Notes
The authors declare no competing financial interest.
The mass spectrometry proteomics data have been deposited to the ProteomeXchange Consortium via the PRIDE11 partner repository with the data set identifier PXD011654.
REFERENCES
- (1).Paulo JA; O’Connell JD; Gygi SP A Triple Knockout (TKO) Proteomics Standard for Diagnosing Ion Interference in Isobaric Labeling Experiments. J. Am. Soc. Mass Spectrom. 2016, 27 (10), 1620–5. [DOI] [PMC free article] [PubMed] [Google Scholar]
- (2).Eng JK; McCormack AL; Yates JR An approach to correlate tandem mass spectral data of peptides with amino acid sequences in a protein database. J. Am. Soc. Mass Spectrom. 1994, 5 (11), 976–89. [DOI] [PubMed] [Google Scholar]
- (3).Ting L; Rad R; Gygi SP; Haas W MS3 eliminates ratio distortion in isobaric multiplexed quantitative proteomics. Nat. Methods 2011, 8 (11), 937–40. [DOI] [PMC free article] [PubMed] [Google Scholar]
- (4).Navarrete-Perea J; Yu Q; Gygi SP; Paulo JA SL-TMT: A Streamlined Protocol for Quantitative (Phospho)proteome Profiling using TMT-SPS-MS3. J. Proteome Res. 2018, 17, 2226. [DOI] [PMC free article] [PubMed] [Google Scholar]
- (5).Huttlin EL; Jedrychowski MP; Elias JE; Goswami T; Rad R; Beausoleil SA; Villen J; Haas W; Sowa ME; Gygi SP A tissue-specific atlas of mouse protein phosphorylation and expression. Cell 2010, 143 (7), 1174–89. [DOI] [PMC free article] [PubMed] [Google Scholar]
- (6).Elias JE; Gygi SP Target-decoy search strategy for mass spectrometry-based proteomics. Methods Mol. Biol 2010, 604, 55–71. [DOI] [PMC free article] [PubMed] [Google Scholar]
- (7).Elias JE; Gygi SP Target-decoy search strategy for increased confidence in large-scale protein identifications by mass spectrometry. Nat. Methods 2007, 4 (3), 207–14. [DOI] [PubMed] [Google Scholar]
- (8).McAlister GC; Nusinow DP; Jedrychowski MP; Wuhr M; Huttlin EL; Erickson BK; Rad R; Haas W; Gygi SP MultiNotch MS3 enables accurate, sensitive, and multiplexed detection of differential expression across cancer cell line proteomes. Anal. Chem 2014, 86 (14), 7150–8. [DOI] [PMC free article] [PubMed] [Google Scholar]
- (9).McAlister GC; Huttlin EL; Haas W; Ting L; Jedrychowski MP; Rogers JC; Kuhn K; Pike I; Grothe RA; Blethrow JD; Gygi SP Increasing the multiplexing capacity of TMTs using reporter ion isotopologues with isobaric masses. Anal. Chem 2012, 84 (17), 7469–78. [DOI] [PMC free article] [PubMed] [Google Scholar]
- (10).Cox J; Mann M MaxQuant enables high peptide identification rates, individualized p.p.b.-range mass accuracies and proteome-wide protein quantification. Nat. Biotechnol 2008, 26 (12), 1367–72. [DOI] [PubMed] [Google Scholar]
- (11).Perez-Riverol Y; Csordas A; Bai J; Bernal-Llinares M; Hewapathirana S; Kundu DJ; Inuganti A; Griss J; Mayer G; Eisenacher M; Perez E; Uszkoreit J; Pfeuffer J; Sachsenberg T; Yilmaz S; Tiwary S; Cox J; Audain E; Walzer M; Jarnuczak AF; Ternent T; Brazma A; Vizcaino JA The PRIDE database and related tools and resources in 2019: improving support for quantification data. Nucleic Acids Res. 2018, gky1106. [DOI] [PMC free article] [PubMed] [Google Scholar]
Associated Data
This section collects any data citations, data availability statements, or supplementary materials included in this article.