Abstract
Objective:
Epidermal growth factor receptor (EGFR) is a theranostic biomarker for a variety of cancer types. The aim of the present study was to develop an 18F radiolabeled EGFR targeting RNA aptamer, and to investigate its ability to visualize and quantify EGFR in xenograft models.
Methods:
Biolayer interferometry binding assay was used to detect the binding affinity of the alkyne modified EGFR aptamer MinE07 (denoted as ME07) with recombinant human wild-type EGFR protein and the mutant EGFRvIII protein. Cy5-conjugated ME07 was used for flow cytometry and immunofluorescence staining, and an Alexa Fluor 488-labeled EGFR antibody (ab193244) was used as a control. 18F-Fluorobenzoyl (FB) azide was employed as a synthon to produce 18F-FB-ME07 via click chemistry, and the cellular uptake and internalization characteristics of 18F-FB-ME07 were investigated. Static PET scans, 60-min dynamic scans and biodistribution study of 18F-FB-ME07 were performed in three types of tumor models.
Results:
The Kd values of ME07 to wtEGFR and EGFRvIII proteins were 0.3 nM and 271 nM, respectively. The A431, U87MG and HCT-116 cells showed strong, weak and negative binding with Cy5-ME07, which is consistent with EGFR expression level in these cells. Peak cell uptake values of 18F-FB-ME07 in A431, U87MG and HCT-116 cells were 2.86%, 2.19% and 0.88% of the added dose, respectively. The mean internalization of 18F-FB-ME07 in these cells were 60.02%, 53.1% and 52.8% of the total accumulated radioactivity. In static PET imaging, despite of high uptake in the liver and kidneys, 18F-FB-ME07 showed reasonable accumulation in A431 tumors (1.02 ± 0.13 %ID/g at 30 min after injection). Of note, the uptake of 18F-FB-ME07 in A431 xenografts was significantly higher than that in U87MG and HCT-116 xenografts. In A431 xenografted mice, the tumor/blood ratio was 3.89 and the tumor/muscle ratio reached 8.65.
Conclusions:
We for the first time generated an aptamer-derived EGFR targeting PET tracer 18F-FB-ME07, which showed highly selective targeting ability in mouse tumor models expressing different levels of EGFR. Our results suggest that 18F-FB-ME07 is a potential EGFR targeting molecular imaging probe for future clinical translation.
Keywords: EGFR, RNA aptamer, 18F-FB-ME07, PET
INTRODUCTION
Epidermal growth factor receptor (EGFR) is one of four transmembrane receptor tyrosine kinases within the human epidermal growth factor receptor (HER) family. By homo-or heterodimerization with other family members, EGFR modulates cellular growth, survival, adhesion, migration and differentiation [1, 2]. Aberrant EGFR expression and/or activation has been described in many epithelial tumors such as head and neck squamous cell carcinoma (HNSCC), breast, lung, ovary, bladder, prostate, kidney cancer and glioma [3-6]. Consequently, EGFR has been explored as an attractive biomarker for the diagnosis, prognosis and therapy of the related cancers [7].
To date, two EGFR-targeting antibodies, cetuximab and panitumumab, have been approved for the treatment of metastatic colorectal cancer (mCRC), and cetuximab is also used in HNSCC [8]. In addition, three small-molecule inhibitors targeting the intracellular domain of EGFR, including gefitinib (Iressa™, AstraZeneca), erlotinib (Tarceva™, Genentech), and lapatinib (Tykerb™, GlaxoSmithKline) have been used to treat patients with NSCLC or pancreatic cancer [7, 8]. The response of cancer patients to EGFR-targeted therapeutics have been reported to be correlated with EGFR expression levels [9]. Particularly, in patients without EGFR overexpression, these EGFR-targeted drugs are unlikely beneficial and even harmful. Thus, profiling EGFR expression is very critical in decision making for EGFR targeted therapy. Conventionally used immunohistochemistry (IHC) is not as satisfactory for patient stratification due mainly to its invasiveness and heterogeneity of EGFR expression in both primary and metastatic tumors [10].
Molecular imaging techniques such as PET and SPECT have been employed as reliable and noninvasive methods to quantify EGFR expression and predict EGFR-targeted therapies [10]. Imaging probes have been developed based on endogenous ligand EGF, small molecules, antibodies and affibodies by labeling with various radionuclides such as 11C, 18F, 68Ga, 64Cu, 124I, 111In and 99mTc [7]. However, the results of these studies are inconsistent. For example, 64Cu-DOTA-cetuximab [11] and 111In-DOTA-cetuximab [12] had depicted a correlation between tumor uptake of the imaging probes and EGFR expression levels, but 89Zr labeled cetuximab did not provide positive correlations [13]. Similar disparity was also observed with radiolabeled panitumumab [14]. It is indicated in those publications that molar concentration or dose plays a crucial role for the tumor accumulation. The inconsistency calls for optimized protocols or alternative approaches to visualize and quantify EGFR expression in malignant tumors.
Generated from systematic evolution of ligands by exponential enrichment (SELEX) technology, aptamer probes are single-stranded DNA/RNA oligonucleotides that bind to given targets based on their unique three-dimensional structures. Aptamers typically are highly selective, specific to targets with high affinities comparable to antibodies. Aptamers are also of low immunogenicity, and amenable to chemical modification and bioconjugation [15, 16]. In contrast to antibodies, the relatively small size and negative charges of aptamers allow for rapid tissue penetration and fast blood clearance to reveal high target-to-background ratio at early time points. Therefore, aptamers are promising candidates for molecular imaging and targeted therapy [17, 18].
Using cell-based SELEX, an RNA aptamer named E07 was developed to target the extracellular domain of EGFR with high binding affinity (Kd = 2.4 nM) [19, 20]. E07 has been utilized to detect human GBM cells with high levels of EGFR and genetically engineered murine glioma cells overexpressing the mutant EGFR variant III (EGFRvIII) [20]. To facilitate in vivo biological application, E07 was truncated to 48 oligonucleotides, and modified with 2’-fluoro at the pyrimidines to generate MinE07 [21]. In this study we developed an aptamer-based PET probe to evaluate EGFR expression in cancer, using an alkyne modified MinE07, denoted as ME07. 18F-fluorobenzoyl (FB) azide was employed as a synthon to produce 18F-FB-ME07 via click chemistry. The ability of 18F-FB-ME07 to image and quantify EGFR expression was tested in mice bearing A431, U87MG and HCT-116 xenografts, which expressed different levels of EGFR.
MATERIALS AND METHODS
General
The alkyne-modified and 2’F stabilized sequence of aptamer ME07 (5’-Alkyne-rGrGrA/I2FC/rGrGrA/I2FU//I2FU//I2FU/rArA/I2FU//I2FC/rG/I2FC//I2FC/rG/I2FU/rArGrA rArArArG/I2FC/rA/I2FU/rG/I2FU//I2FC/rArArArG/I2FC//I2FC/rG/rGrArA/I2FC//I2FC/rG/I2FU//I2FC//I2FC/−3’) was synthesized by Bio-synthesis Inc. (Lewisville, TX). AlexaFluor® 488-labeled rabbit anti-EGFR (ab 193244) was purchased from Abeam. Biotinylated human EGFRvIII, Avi Tag (Avitag™) and biotinylated human EGFR, Avi Tag (Avitag™) was purchased from Amsbio (AMS.EGR-H82E0 and AMS.EGR-H82E3). Fluorescent dye Cyanine 5 (Cy5) and biocytin were purchased from Thermo Scientific. Cy5 was conjugated with ME07 by click chemistry between alkyne and Cy5 azide, and the product was purified by a NAP-5 column.
Biolayer interferometry (BLI)
The binding kinetics of ME07 with EGFR extracellular domain was evaluated by BLI binding assay on an Octet Red96® instrument (ForteBio, Inc.). Briefly, the assays were conducted in solid black 96-well plates (Geiger Bio-One) in seven steps: 1, baseline in PBS for 60 s; 2, loading of biotinylated EGFR protein (1 μg/mL) for 600 s; 3, baseline in PBS for 60 s; 4, quenching with 1 μg/mL Biocytin in 0.1% BSA for 180 s; 5, baseline with PBS for 60 s; 6. association with ME07 aptamer in a series concentration of 0.975, 3.9, 15.6, 62.5, 250 and 1000 nM for 600 s; 7, dissociation in PBS for 600 s. Nonspecific binding was measured by albumin-loaded biosensor to PBS and blank biosensor to analytes. Data processing were performed using Octet Analysis software 7.0 provided by the manufacturer. The dissociation constants (Kd) were obtained by nonlinear regression analysis using the specific binding model (1:1 ligand interaction) in the Graph Pad Prism program 6.0 (Graph Pad Software, San Diego, CA).
Cell culture
The A431 human epidermoid carcinoma cells, U87MG human glioblastoma cells and HCT-116 human colorectal carcinoma cells were purchased from the American Type Culture Collection (ATCC, Rockville MD). The cells were grown in Dulbecco’s modified Eagle medium (DMEM), Minimum Essential Medium (MEM), and McCoy’s 5A Medium respectively, all of which were supplemented with 10% FBS, penicillin (100 IU/mL), and streptomycin (100 mg/mL) and cultured at 37 °C in a humidified atmosphere containing 5% CO2. Cells were passaged three times per week.
Flow cytometry
Flow cytometry was used to study the expression levels of EGFR among the three cell lines with abl93244, and the ability of ME07 to bind EGFR was studied with Cy5-ME07. A BD Beckman Coulter flow cytometer (Brea, CA) was used for flow cytometry analysis. A431,U87MG and HCT-116 cells (1 × 10⁶ mL−1) were suspended in 200 μL cold binding buffer (0.1% BSA PBS, 5 mM Mg2+), followed by staining on ice with 1:50 diluted ab 193244 or 100 nM Cy5-E07 for 30 min. Then cells were rinsed with 500 μL PBS three times and suspended in 200 μL of binding buffer for flow cytometry. Results were analyzed using FlowJo Software 10.0 (TreeStar, Ashland, OR).
Live cell immunofluorescence staining
Suspended cells at the concentration of 1 × 10⁵ mL−1 were applied in 8-well removable silicone cultivation chambers (1 mL/well) and cultured overnight. Then the culture medium was removed, and cells were rinsed with 0.1% BSA blocking solution. Ab193244 and Cy5-ME07 was prepared in 1:100 dilution or at 100 nM concentration respectively with 0.1% BSA, and applied to incubate the cells for 30 min at 4°C. Then the wells were emptied and rinsed. Hoechst-3342 was added for nuclear stain for another 30 min. Confocal microscopy was performed with a Zeiss 780 confocal microscope.
Synthesis of18F-FB-ME07
Fluorobenzoyl (FB) was used for the radiosynthesis of 18F-FB-ME07 according to a previously reported method [22-24]. ME07 (150 μg in 15 μL of water) were mixed in a tube with 0.7 mg of CuSO4 5H2O in 20 μL of water and 5.6 mg of sodium ascorbate in 200 μL 0.1 M borate buffer (pH 8.6). Then, 50 μL of 18F-fluorobenzyl azide (5–6 mCi, 185-222 MBq) in CH3CN were added, followed by a short vortex and incubation at 37 °C for 15 min. A NAP5 column was used to purify the crude reaction mixture with 0.5 mL fractions of H2O.
Cell uptake and internalization studies
Uptake and internalization of 18F-FB-ME07 were examined in A431, U87MG and HCT-116 cells. The cells were seeded in 24-well plates at a density of 1 × 10⁵ cells/well 24 h before the experiment. After rinsing the cells with PBS, 7.4 kBq/well of tracers in 0.5 mL of serum free medium were added. The cells were incubated at 37 °C for 5, 15, 30 and 60 min. At each time point, the medium was disposed, and cells were rinsed with cold PBS (1 mL/well) and lysed by adding 0.2 mL 0.1 M NaOH. For internalization assay, after the removal of the medium at the same time points as the cell uptake assay, the cells were incubated with 0.5 mL of acid buffer (50 mM Glycine, 100 mM NaCl, pH 2.8) for 1 min. Then the acid buffer was removed, and the cells were rinsed with 1 mL PBS, followed by addition of 0.2 mL 0.1 M NaOH. Cell lysate for both assays was collected for radioactivity measurement using a γ-counter. The cell uptake and internalization values were normalized to the amount of added radioactivity. Each experiment was performed in triplicate.
Animal models
All animal studies were approved by the Institutional Animal Care and Use Committee of the Clinical Center, National Institutes of Health (NIH) and were conducted according to the principles and procedures in the Guide for the Care and Use of Laboratory Animals [25]. Female athymic nude mice and female Balb/c mice were purchased from Harlan Laboratories. Balb/c mice were used for in vivo stability assays, while nude mice were used to establish tumor models.
Tumor models were prepared by subcutaneous injection of 5×10⁶ cells into the right shoulder of nude mice (n = 4 per group). Tumor sizes were measured with a digital caliper. Tumor volume (mm3) was calculated according to the formula 0.5×length×width2. The mice were subjected to micro PET studies when the tumor volume reached 100 ~ 300 mm3 (2 ~ 4 weeks after inoculation).
PET imaging
PET scans were obtained with an Inveon small-animal PET scanner (Siemens Medical Solutions). For static PET scan, A431, U87MG, and HCT-116 tumor-bearing mice (n = 4 per group) were scanned at 30, 60, and 90 min under isoflurane anesthesia after intravenous administration of 3.70~5.55 MBq of 18F-FB-ME07.
For dynamic PET, 60-min dynamic scans were performed in A431, U87MG and HCT-116 tumor-bearing mice respectively (n = 3 per group). Under isoflurane anesthesia, the mice were each implanted with a catheter in the tail vein before scans, 3.70~5.55 MBq of 18F-FB-ME07 was then injected by the catheter instantly after the scans began.
The PET images were reconstructed using 3-dimensional ordered-subsets expectation maximum (3D OSEM). No correction was applied for attenuation or scatter. Regions of interest (ROIs) were drawn on decay-corrected whole-body coronal images using vendor software (ASI Pro 5.2.4.0; Siemens Medical Solutions). The radioactivity accumulation within the tumor and interested organs were acquired from mean pixel values of the ROI volumes and post-processed as percentage injected dose per gram (%ID/g). In addition, the dynamic PET images were reconstructed into 26 time-frames with frame rates of 10×30 s, 5×60 s, 5×120 s, 4×300 s and 2×600 s. The last frame was applied to define the tumor ROI and extract the tumor time-activity curves (TAC). For each frame, TACs of tumor, liver, kidneys, blood and muscle were generated by the mean tracer uptake within the defined ROIs. ROIs over left ventricles defined on the frame at the first minute was used to generate the blood curves.
Biodistribution
Immediately after PET scan at 90 min after injection of 18F-FB-ME07, the tumor bearing mice were sacrificed. Normal organs and tissues including blood, heart, liver, kidneys, spleen, bone, muscle, intestine and tumor were collected, and the radioactivity was measured using a γ-counter after the organs being wet weighed.
Statistical analysis
All data were expressed as means ± SD. One-way analysis of variance (ANOVA) was used for statistical analysis. A p value less than 0.05 was considered statistically significant. (*P<0.05, *P <0.01)
RESULTS
Binding of ME07 towards EGFR
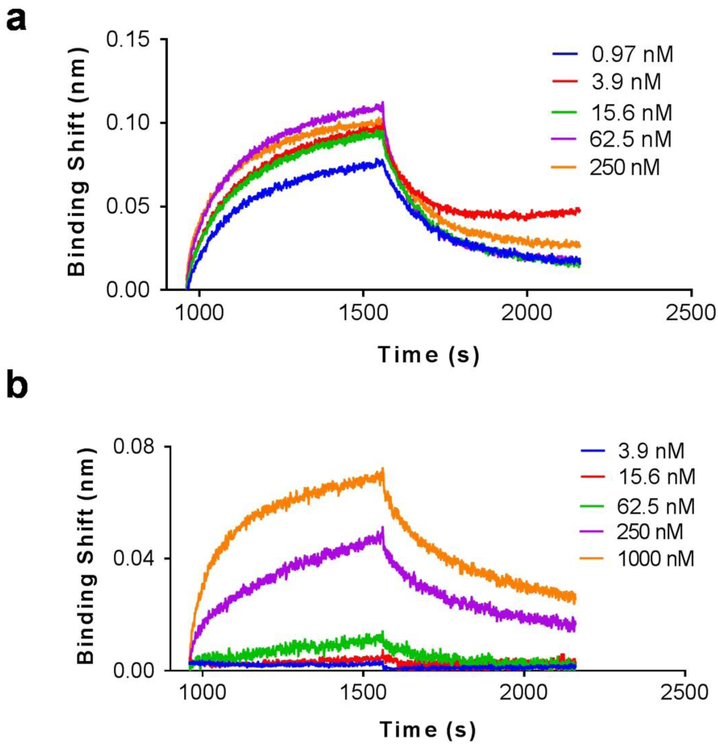
The binding affinity of ME07 towards EGFR proteins was investigated using a BLI assay. As shown in Fig 1, ME07 exhibited strong binding affinity with the extracellular domain of human wtEGFR with a dissociation constant Kd value of 0.3 nM (R2 = 0.9835). Interestingly, this aptamer also binds to EGFR vIII, with a Kd value of 271 nM (R2 = 0.9012). The strong receptor binding of the aptamer meets the prerequisite to be used as a probe for the imaging of EGFR.
Figure 1.
BLI binding assays of ME07 towards recombinant human wtEGFR (a) and mutant EGFRvIII proteins (b). In these assays, the biosensors pre-coated with streptavidin interacted with biotinylated wtEGFR or EGFRvIII protein, followed by exposure to different concentrations of ME07 (0.97~1000 nM) for association and then to PBS for dissociation.
Cell binding assay
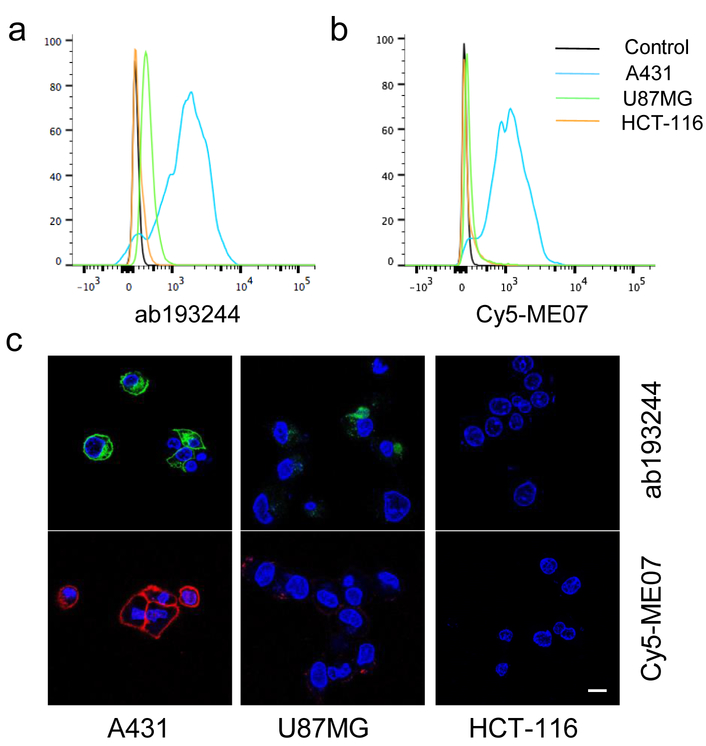
The binding of aptamer ME07 to EGFR expressing cells was studied using Cy5-labeled ME07 by flow cytometry and fluorescence imaging. Three cell lines with different levels of EGFR expression were used, including A431 with high EGFR expression, U87MG with medium EGFR expression, HCT-116 with no EGFR expression. EGFR expression on each cell line was validated by flow cytometry using an Alexa488-labeled anti-EGFR antibody (Fig. 2a). Cy5-ME07 aptamer staining revealed consistent EGFR expression profiles on all these three cell lines as shown by the fluorescence signal intensities (Fig. 2b). The difference of EGFR expression on A431, U87MG and HCT-116 cells were further verified by confocal fluorescence microscopy after staining using Alexa488-labeled antibody and Cy5-ME07, respectively (Fig 2c-h). Specifically, A431 cells showed the strongest fluorescence signal intensities, and U87MG cells displayed low fluorescence signals, while HCT-116 cells showed undetectable florescence. High concentration of EGFR antibody Erbitux failed to block the binding of Cy5-ME07 with EGFR positive cells, indicating the binding epitopes of ME07 and EGFR antibody on EGFR protein are different (Fig. S1).
Figure 2.
EGFR binding studies of Alexa488-labeled EGFR antibody ab193244 and Cy5-ME07 in A431, U87MG and HCT-116 cells. (a-b) Flow cytometry study of ab193244 and Cy5-ME07. (c) Confocal microscopy of Alexa488-ab193244 (green) and Cy5-ME07 (red) in live cells. The nuclei were stained by DAPI (blue).
Cell uptake and internalization of 18F-FB-ME07
The average radiochemical yield of 18F-FB-ME07 was 70 ± 4 %, non-decay-corrected (ndc) based on 18F-fluorobenzyl azide. The specific activity was 7.4~14.8 kBq/nmol.
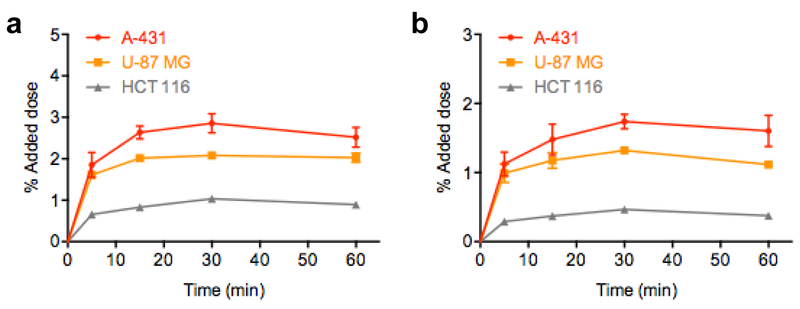
Time dependent cellular uptake of 18F-FB-ME07 was studied in A431, U87MG and HCT-116 cells, and the results were presented in Fig. 4. The uptake of 18F-FB-ME07 was rapid and high in A431 cells and U87MG cells, and reached the peak of about 2.86 ± 0.23% and 2.08 ± 0.05% of added doses after 30 min, and remained at around 2.52 ± 0.24% and 2.03 ± 0.11%, respectively after incubation for 60 min. By contrast, the uptake of 18F-FB-ME07 in HCT-116 cells was much lower than that in A431 cells and U87MG cells (1.04 ± 0.04% at 30 min) (Fig. 3a).
Fig. 4.
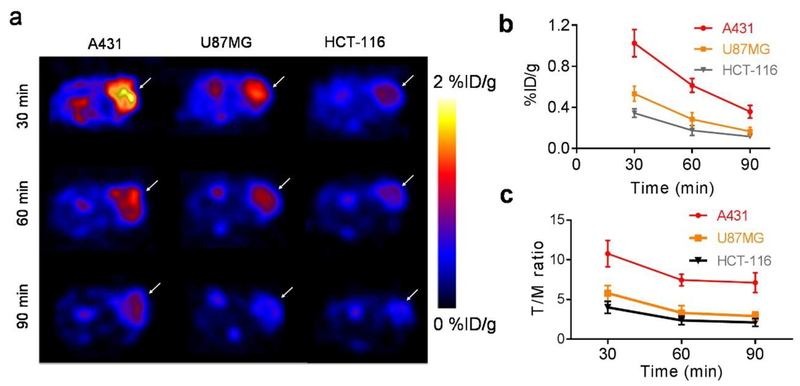
PET imaging of 18F-FB-ME07 in A431, U87MG and HCT-116 xenografted mice (n = 4/group). (a) Representative transverse micro-PET images of xenograft mice at 30, 60 and 90 min after injection. (b) Tumor uptake quantification of regions of interest (ROI), expressed as %ID/g_mean. (c) Comparative ratios of the tumor uptake to muscle derived from ROI quantification for 18F-FB-ME07 between different tumor models.
Fig. 3.
In vitro uptake (a) and internalization (b) assays of 18F-FB-ME07 in A431, U87MG and HCT-116 cells (data represent mean ± SD).
The internalization studies showed steady and considerable internalization of around 40 ~ 60% of the attached radioactivity among all three cell lines throughout the incubation (Fig. 3b).
Static PET imaging
Representative transverse PET images of tumor-bearing mice at different time points were shown in Fig. 4a. While the A431 and U87MG tumors were clearly visualized with high contrast at 30 min post-injection (n = 4/group), HCT-116 tumor was barely detectable at the same time point. Specifically, A431 tumors showed much stronger signal intensities than U87MG tumor and HCT-116 tumor at each corresponding time point. The radioactivity intensities in all tumor models rapidly declined from 0.5 h to 1.5 h after injection. High signal intensity in kidneys and bladder was observed on coronal PET images (Fig. S2), indicating renal-urinary clearance of 18F-FB-ME07.
Based on PET quantification, the mean tumor uptake values were determined to be 1.02 ± 0.13, 0.61 ± 0.07, and 0.36 ± 0.06 % ID/g in A431 tumors, at 30, 60, and 90 min post injection respectively. The values were significantly higher than those in U87MG tumors (0.53 ± 0.07, 0.28 ± 0.06, and 0.17 ± 0.04 %ID/g at 30, 60, and 90 min post-injection, respectively) and in HCT-116 tumors (0.34 ± 0.04, 0.17 ± 0.05, 0.12 ± 0.02 %ID/g at 30, 60, and 90 min post injection respectively). The tumor uptake values in U87MG tumors were also significant higher than those in HCT-116 tumors at 30 and 60 min p.i. (Fig. 4b). Tumor/muscle (T/M) ratios generated from PET quantification for 18F-FB-ME07 after injection were shown in Fig. 4c, which were calculated as 10.78, 7.46, 7.12 in A431 tumors, at 30, 60, and 90 min post injection respectively. The values were significantly higher than those in U87MG and HCT-116 tumors.
Biodistribution
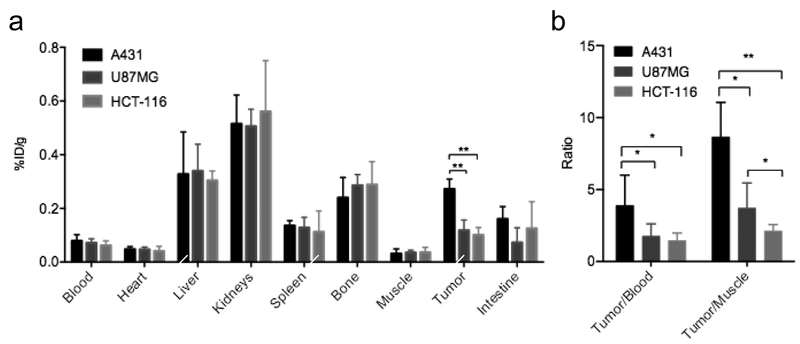
Ex vivo biodistribution results confirmed the above PET study. The biodistribution of 18F-FB-ME07 at 90 min post-injection in tumor and other organs was presented in Fig. 5a. Likewise, the tumor uptakes were determined to be 0.27 ± 0.04, 0.12 ± 0.04 and 0.12 ± 0.03 %ID/g for A431, U87MG and HCT-116 tumors, respectively. And typically, retention of the radioactivity was observed within liver and kidneys, accompanied by traceable accumulation in bone for all three xenograft models.
Fig. 5.
(a) Biodistribution of 18F-FB-ME07 in A431, U87MG and HCT-116 xenograft mice at 90 min after injection. (b) Comparative ratios of the tumor uptake to blood and muscle for 18F-FB-ME07 between different tumor models at 90 min post-injection. (*P < 0.05, **P < 0.01)
Moreover, the tumor/blood (T/B) and T/M ratios for 18F-FB-ME07 at 90 min after injection were shown in Fig. 5b. The T/B ratios were 3.89, 1.76, 1.46 for A431, U87MG and HCT-116 tumors respectively, and the corresponding T/M ratios were 8.65, 3.71, 2.12. Remarkably, A431 xenografts showed much higher T/B and T/M contrasts of 18F-FB-ME07 than those of U87MG and HCT-116 xenografts (P < 0.01, P < 0.05).
Dynamic PET
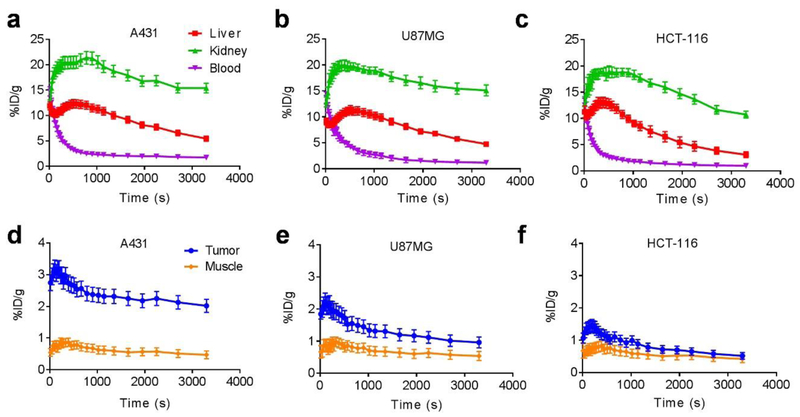
We further studied dynamic PET imaging of 18F-FB-ME07 in the above three tumor models. As shown in Fig. 6, we observed similar radioactivity uptake characteristics of the tracer in liver, kidneys, blood and muscle in A431, U87MG and HCT-116 tumors. Noticeably, the tracer accumulated largely and instantly into liver and kidneys in all tumor models and slowly dropped from around 15 %ID/g to around 5.0 %ID/g in the liver, and 20 %ID/g to 10.0 ~ 15.0 %ID/g in the kidneys, respectively. The peak tracer uptake value in A431 tumors was 3.24 %ID/g at 3 min after injection, and those for U87MG and HCT-116 were 2.17 and 1.35 %ID/g, respectively.
Fig. 6.
60-min dynamic PET scans of 18F-FB-ME07 in A431, U87MG and HCT-116 (n = 3/group) xenograft mice. (a, b, c) ROI quantification of dynamic PET of 18F-FB-ME07 in liver, kidney and blood of mice models. (d, e, f) ROI quantification of dynamic PET imaging of 18F-FB-ME07 in tumor and muscle.
DISCUSSION
By folding into 3-dimensional structures to recognize a wide range of molecules, nucleic acid aptamers have been developed for various clinical applications, including in vitro diagnostics, molecular imaging, biomarker discovery, and therapeutics [26]. The successful application of aptamer based nuclear imaging probes has been demonstrated with 99mTc labeled tenascin-C and MUC1 targeted aptamers [27, 28]. Tenascin C is an extracellular matrix protein, which is expressed during tissue remodeling processes including angiogenesis and tumor growth. MUC1 protein is a well-established biomarker for several tumors, including breast cancer. Compared with tenascin C and MUC1, EGFR is another significant biomarker for diagnosis and therapy of malignant diseases [10].
Since the discovery of E07 aptamer in 2010 [20], E07 has been applied as EGFR targeting moiety for tumor specific delivery and accumulation of several theranostic nanoformulations [29, 30]. In this study, we labeled ME07 with 18F to develop a PET imaging agent to visualize and evaluate EGFR expression in tumor models. Indeed, PET and biodistribution studies showed highly selective targeting of 18F-FB-ME07 in EGFR positive tumors (Fig. 5). Moreover, the tumor uptake of 18F-FB-ME07 is proportionally related to the EGFR expression status, as highest accumulation of 18F-FB-ME07 was observed in A431 tumor that expresses high level of EGFR, while medium-level EGFR U87MG xenografts showed lower uptake of 18F-FB-E07. Although HCT-116 is EGFR-negative, tumor uptake of 18F-FB-ME07 is observed at low level, presumably due to non-specific accumulation of the imaging probe.
Based on the static and dynamic PET images, 18F-FB-ME07 was mainly excreted through renal-urinary route, probably due to the hydrophilicity and negative charge of the nucleotides, as observed in other aptamers [22, 28, 31]. Liver also showed relatively high accumulation, as compared with the other organs. The predominant renal and liver retention of 18F-FB-ME07 may limit the applications in detecting lesions in the liver area and urinary systems. For dynamic imaging, it is of note that the tracer uptake values in tumors and other indicated organs were significantly higher than data captured on static scans at comparable time points in each model, which was likely due to reduced glomerular filtration rate of anesthetized mice by isoflurane over conscious mice, a common phenomenon observed and reported previously [32, 33].
The labeling of ME07 was performed through a click reaction between the prosthetic group 18F-FB and alkyne modified aptamer. The same labeling strategy has been applied to label a PTK7 aptamer, named as Sgc 8 [22]. We found the RCY of this labeling method is better than labeling via N-succinimidyl 4-18F-fluorobenzoate (18F-SFB), as we did for the Tenascin-C aptamer [31]. However, rapid clearance through kidneys and liver was uniformly observed for all reported aptamer tracers. Optimization of the labelling method and ways to retard the in vivo clearance of aptamer may be needed to further improve the imaging quality using aptamer-based molecular probes.
Besides fast clearance, stability is another major issue facing aptamers. For example, a modified RNA aptamer with HER2-specific binding has been labeled with 99mTc for diagnostic imaging. While the radioconjugated aptamer bound specifically to HER2 receptor on cells in vitro it did not show any significant tumor-to-blood or tumor-to-muscle ratio in mice [34]. The backbone of E07 has been modified to increase the resistance of enzymatic degradation [20]. The results from in vivo stability assay showed that at 20 min after injection, only 15% of 18F-FB-ME07 remained intact in blood circulation (Fig. S3). On PET images, we also observed rapid decrease of tumor uptake of 18F-FB-ME07 from 30 min to 90 min, which may be partially resulted from degradation and dissociation of 18F-FB-ME07 from tumor cells. Thus, PET imaging at early time point may better reflect the receptor expression in vivo. The fast clearance of the aptamer from tumor and whole body will facilitate repetitive PET scans to reflect the dynamics of receptor expression upon treatment [35, 36]. Due to the slight degradation of 18F-FB-ME07, free 18F- ions may be released for bone deposition, which may result in relatively high radioactivity observed in bone.
To conclude, by demonstrating highly selective targeting ability and distinctive tumor contrast, 18F-FB-ME07 is shown as a promising candidate for EGFR targeted PET imaging, which might offer an alternative to mAb or affibody based EGFR imaging.
Supplementary Material
Acknowledgments
Funding: This work was supported by the Intramural Research Program of the National Institute of Biomedical Imaging and Bioengineering (NIBIB), National Institutes of Health (NIH), National Natural Science Foundation of China (81671718 and 81271600), and Natural Science Foundation of Hubei Province of China (2016CFB687).
Footnotes
Conflict of Interest: The authors declare that declares they have no conflict of interest.
Ethical approval: All applicable international, national, and/or institutional guidelines for the care and use of animals were followed.
Reference
- 1.Yarden Y The EGFR family and its ligands in human cancer. signalling mechanisms and therapeutic opportunities. Eur J Cancer. 2001. ;37 Suppl 4:S3–8. [DOI] [PubMed] [Google Scholar]
- 2.Pool M, de Boer HR, Hooge MNL, van Vugt M, de Vries EGE. Harnessing Integrative Omics to Facilitate Molecular Imaging of the Human Epidermal Growth Factor Receptor Family for Precision Medicine. Theranostics. 2017;7:2111–33. [DOI] [PMC free article] [PubMed] [Google Scholar]
- 3.Hynes NE, Lane HA. ERBB receptors and cancer: the complexity of targeted inhibitors. Nat Rev Cancer. 2005;5:341–54. [DOI] [PubMed] [Google Scholar]
- 4.Subik K, Lee JF, Baxter L, Strzepek T, Costello D, Crowley P, et al. The Expression Patterns of ER, PR, HER2, CK5/6, EGFR, Ki-67 and AR by Immunohistochemical Analysis in Breast Cancer Cell Lines. Breast Cancer (Auckl). 2010;4:35–41. [PMC free article] [PubMed] [Google Scholar]
- 5.Kobayashi S, Boggon TJ, Dayaram T, Janne PA, Kocher O, Meyerson M, et al. EGFR mutation and resistance of non-small-cell lung cancer to gefitinib. N Engl J Med. 2005;352:786–92. [DOI] [PubMed] [Google Scholar]
- 6.Heimberger AB, Hlatky R, Suki D, Yang D, Weinberg J, Gilbert M, et al. Prognostic effect of epidermal growth factor receptor and EGFRvIII in glioblastoma multiforme patients. Clin Cancer Res. 2005;11:1462–6. [DOI] [PubMed] [Google Scholar]
- 7.Corcoran EB, Hanson RN. Imaging EGFR and HER2 by PET and SPECT: a review. Med Res Rev. 2014;34:596–643. [DOI] [PubMed] [Google Scholar]
- 8.Baselga J, Arteaga CL. Critical update and emerging trends in epidermal growth factor receptor targeting in cancer. J Clin Oncol. 2005;23:2445–59. [DOI] [PubMed] [Google Scholar]
- 9.Pirker R, Pereira JR, von Pawel J, Krzakowski M, Ramlau R, Park K, et al. EGFR expression as a predictor of survival for first-line chemotherapy plus cetuximab in patients with advanced non-small-cell lung cancer: analysis of data from the phase 3 FLEX study. Lancet Oncol. 2012;13:33–42. [DOI] [PubMed] [Google Scholar]
- 10.Cai W, Niu G, Chen X. Multimodality imaging of the HER-kinase axis in cancer. Eur J Nucl Med Mol Imaging. 2008;35:186–208. [DOI] [PubMed] [Google Scholar]
- 11.Cai W, Chen K, He L, Cao Q, Koong A, Chen X. Quantitative PET of EGFR expression in xenograft-bearing mice using 64Cu-labeled cetuximab, a chimeric anti-EGFR monoclonal antibody. Eur J Nucl Med Mol Imaging. 2007;34:850–8. [DOI] [PubMed] [Google Scholar]
- 12.Achmad A, Hanaoka H, Yoshioka H, Yamamoto S, Tominaga H, Araki T, et al. Predicting cetuximab accumulation in KRAS wild-type and KRAS mutant colorectal cancer using 64Cu-labeled cetuximab positron emission tomography. Cancer Sci. 2012;103:600–5. [DOI] [PMC free article] [PubMed] [Google Scholar]
- 13.Aerts HJ, Dubois L, Perk L, Vermaelen P, van Dongen GA, Wouters BG, et al. Disparity between in vivo EGFR expression and 89Zr-labeled cetuximab uptake assessed with PET. J Nucl Med. 2009;50:123–31. [DOI] [PubMed] [Google Scholar]
- 14.Niu G, Li Z, Xie J, Le QT, Chen X. PET of EGFR antibody distribution in head and neck squamous cell carcinoma models. J Nucl Med. 2009;50:1116–23. [DOI] [PMC free article] [PubMed] [Google Scholar]
- 15.Ni X, Castanares M, Mukherjee A, Lupold SE. Nucleic acid aptamers: clinical applications and promising new horizons. Curr Med Chem. 2011;18:4206–14. [DOI] [PMC free article] [PubMed] [Google Scholar]
- 16.Tan W, Donovan MJ, Jiang J. Aptamers from cell-based selection for bioanalytical applications. Chem Rev. 2013;113:2842–62. [DOI] [PMC free article] [PubMed] [Google Scholar]
- 17.Jacobson O, Chen X. Interrogating tumor metabolism and tumor microenvironments using molecular positron emission tomography imaging. Theranostic approaches to improve therapeutics. Pharmacol Rev. 2013;65:1214–56. [DOI] [PMC free article] [PubMed] [Google Scholar]
- 18.Shangguan D, Li Y, Tang Z, Cao ZC, Chen HW, Mallikaratchy P, et al. Aptamers evolved from live cells as effective molecular probes for cancer study. Proc Natl Acad Sci U S A. 2006;103:11838–43. [DOI] [PMC free article] [PubMed] [Google Scholar]
- 19.Li N, Nguyen HH, Byrom M, Ellington AD. Inhibition of cell proliferation by an anti-EGFR aptamer. PLoS One. 2011;6:e20299. [DOI] [PMC free article] [PubMed] [Google Scholar]
- 20.Wan Y, Kim YT, Li N, Cho SK, Bachoo R, Ellington AD, et al. Surface-immobilized aptamers for cancer cell isolation and microscopic cytology. Cancer Res. 2010;70:9371–80. [DOI] [PubMed] [Google Scholar]
- 21.Avutu V Avidity Effects of MinE07, an Anti-EGFR Aptamer, on Binding to A431 Cells [undergraduate]. Texas ScholarWorks University of Texas at Austin; 2010. [Google Scholar]
- 22.Jacobson O, Weiss ID, Wang L, Wang Z, Yang X, Dewhurst A, et al. 18F-Labeled Single-Stranded DNA Aptamer for PET Imaging of Protein Tyrosine Kinase-7 Expression. J Nucl Med. 2015;56:1780–5. [DOI] [PMC free article] [PubMed] [Google Scholar]
- 23.Zhu G, Zhang H, Jacobson O, Wang Z, Chen H, Yang X, et al. Combinatorial Screening of DNA Aptamers for Molecular Imaging of HER2 in Cancer. Bioconjug Chem. 2017;28:1068–75. [DOI] [PubMed] [Google Scholar]
- 24.Rotstein BH, Stephenson NA, Vasdev N, Liang SH. Spirocyclic hypervalent iodine(III)-mediated radiofluorination of non-activated and hindered aromatics. Nat Commun. 2014;5:4365. [DOI] [PubMed] [Google Scholar]
- 25.Guide for the Care and Use of Laboratory Animals. Washington (DC); 1996. [Google Scholar]
- 26.Wang AZ, Farokhzad OC. Current progress of aptamer-based molecular imaging. J Nucl Med. 2014;55:353–6. [DOI] [PMC free article] [PubMed] [Google Scholar]
- 27.Hicke BJ, Stephens AW, Gould T, Chang YF, Lynott CK, Heil J, et al. Tumor targeting by an aptamer. J Nucl Med. 2006;47:668–78. [PubMed] [Google Scholar]
- 28.Pieve CD, Perkins AC, Missailidis S. Anti-MUC1 aptamers: radiolabelling with (99m)Tc and biodistribution in MCF-7 tumour-bearing mice. Nucl Med Biol. 2009;36:703–10. [DOI] [PubMed] [Google Scholar]
- 29.Melancon MP, Zhou M, Zhang R, Xiong C, Allen P, Wen X, et al. Selective uptake and imaging of aptamer- and antibody-conjugated hollow nanospheres targeted to epidermal growth factor receptors overexpressed in head and neck cancer. ACS Nano. 2014;8:4530–8. [DOI] [PMC free article] [PubMed] [Google Scholar]
- 30.Wan Y, Mahmood MA, Li N, Allen PB, Kim YT, Bachoo R, et al. Nanotextured substrates with immobilized aptamers for cancer cell isolation and cytology. Cancer. 2012;118:1145–54. [DOI] [PMC free article] [PubMed] [Google Scholar]
- 31.Jacobson O, Yan X, Niu G, Weiss ID, Ma Y, Szajek LP, et al. PET imaging of tenascin-C with a radiolabeled single-stranded DNA aptamer. J Nucl Med. 2015;56:616–21. [DOI] [PMC free article] [PubMed] [Google Scholar]
- 32.Li ZB, Chen K, Chen X. (68)Ga-labeled multimeric RGD peptides for microPET imaging of integrin alpha(v)beta (3) expression. Eur J Nucl Med Mol Imaging. 2008;35:1100–8. [DOI] [PubMed] [Google Scholar]
- 33.Cai W, Zhang X, Wu Y, Chen X. A thiol-reactive 18F-labeling agent, N-[2-(4–18F-fluorobenzamido)ethyl]maleimide, and synthesis of RGD peptide-based tracer for PET imaging of alpha v beta 3 integrin expression. J Nucl Med. 2006;47:1172–80. [PMC free article] [PubMed] [Google Scholar]
- 34.Varmira K, Hosseinimehr SJ, Noaparast Z, Abedi SM. A HER2-targeted RNA aptamer molecule labeled with 99mTc for single-photon imaging in malignant tumors. Nucl Med Biol. 2013;40:980–6. [DOI] [PubMed] [Google Scholar]
- 35.Niu G, Li Z, Cao Q, Chen X. Monitoring therapeutic response of human ovarian cancer to 17-DMAG by noninvasive PET imaging with (64)Cu-DOTA-trastuzumab. Eur J Nucl Med Mol Imaging. 2009;36:1510–9. [DOI] [PMC free article] [PubMed] [Google Scholar]
- 36.Smith-Jones PM, Solit DB, Akhurst T, Afroze F, Rosen N, Larson SM. Imaging the pharmacodynamics of HER2 degradation in response to Hsp90 inhibitors. Nat Biotechnol. 2004;22:701–6. [DOI] [PubMed] [Google Scholar]
Associated Data
This section collects any data citations, data availability statements, or supplementary materials included in this article.


