Abstract
Purpose:
To determine if DCE-MRI adds diagnostic value to the combined use of T2WI and DWI-MRI in the determination of clinical complete response (cCR) after neoadjuvant treatment (NAT) in patients with locally advanced rectal cancer.
Methods and Materials:
In this IRB-approved, HIPAA-compliant retrospective study, response was assessed using a 5-point confidence score by T2WI and DWI-MRI only (“standard MRI”), then with addition of DCE-MRI. Review of digital rectal exams and endoscopy notes produced a clinical overall response score. The reference standard was CR by histopathology or cCR determined after a minimum of 18 months follow-up. Diagnostic accuracy and ROC curves were calculated for standard MRI and added DCE-MRI (to detect complete or good response), for clinical evaluation (to detect CR) and for MRI and clinical methods combined.
Results:
Of 65 patients undergoing NAT, 20 had cCR (31%). Sensitivity, specificity and area under the ROC (AUC) were 0.55, 0.87 and 0.69 for clinical evaluation; 0.42, 0.77 and 0.66 for standard MRI, and 0.53, 0.76 and 0.68 for added DCE-MRI respectively. Combined clinical evaluation and standard MRI with DCE-MRI resulted in the highest specificity of 0.96 and highest AUC of 0.72.
Conclusion:
For the assessment of cCR after neoadjuvant therapy using clinical and multi-sequence MRI reading strategies, the addition of DCE-MRI increased specificity and PPV, but not significantly.
Keywords: Rectal cancer, Chemoradiotherapy, Magnetic resonance imaging
Introduction:
Complete tumor response to chemoradiotherapy (CRT) for rectal cancer occurs in approximately one-quarter of patients [1]. Rather than subject such patients to surgery, in which morbidity from bowel and sexual dysfunction occurs up to 65% and from bladder dysfunction up to 35% of the time [2] with resultant profound lifestyle alterations, there has been a growing use of non-operative management (NOM, also called “Watch and Wait”) for those patients achieving a complete or near-complete clinical response (cCR) by endoscopy and imaging. Significant limitations to accurate identification of cCR are encountered at imaging, now somewhat obviated by diffusion-weighted imaging (DWI-MRI) [3]. Dynamic-contrast enhanced MRI (DCE-MRI), is another functional MRI type sequence able to identify tumor presence due to earlier perfusion and washout compared with normal tissues [4] that could possibly supplement the evaluation of cCR.
A large body of research has reported on the quantitative potentials of both DWI-MRI [5] and DCE-MRI [6] in the evaluation of rectal cancer response to CRT. The apparent diffusion coefficient (ADC), based on pharmacokinetic modeling, was found to be generally useful in that responding tumors showed increased ADC reflecting decreased cellular tumor density, however, the accuracy in identifying pathologic complete responders (pCR) was limited and showed poor reproducibility [6] between studies and institutions. Furthermore, methods of quantitation could be cumbersome and not practical in a daily read-out situation. It emerged subsequently that qualitative observation of DWI-MRI images could assess response and particularly complete response better than standard sequence observation alone [3]. In a similar tale, quantitative DCE-MRI investigations which attempted to better identify patients with pCR showed poor agreement on the permeability transfer coefficient values (Ktrans), amongst studies and between differing pharmacokinetic models used [6]. Similarly, the workflow to obtain these quantities is cumbersome and not practical on a daily read-out basis.
Although DCE-MRI is not used for rectal cancer imaging at most institutions, we have routinely used it for over 2 decades and hypothesized that a simple qualitative observation of this sequence might help in the identification of patients with pCR. Given the limitations in accuracy shown thus far for quantitative DCE-MRI, and the lack of practicality of its use from a workflow perspective, the purpose of this study was to assess the added value of qualitative DCE-MRI to standard MRI for identification of complete response to CRT in rectal cancer.
Materials and Methods:
Patient inclusion and reader blinding
In this HIPPA-approved retrospective study, our Institutional Review Board waived the need for patient consent. No author reported a conflict of interest related to this study. At our tertiary referral cancer center, we searched the surgical database of flexible sigmoidoscopy and the radiological rectal MRI database for consecutive patients examined between January 1, 2008 and December 31, 2014. We then searched our institutional database for the term “color photo” amongst both lists and merged these results. This interval represents the period of optimized DWI-MRI at our institution and allows for 18 months minimum clinical follow up. Patients with recurrent rectal cancer, anal squamous cell cancer and those receiving only neoadjuvant chemotherapy followed by surgery on a clinical trial were excluded. Eligible patients had primary non-mucinous rectal adenocarcinoma treated at our institution by either surgery or NOM with clinical follow-up for a minimum of 18 months. Patients had to undergo sigmoidoscopy 4-12 weeks after the end of chemoradiotherapy and before either surgery or NOM and also have MRI with DWI (hereafter “standard MRI”) and dynamic contrast-enhanced (DCE) MRI within 3 weeks of the sigmoidoscopy. Retrospective review of prospectively collected data between 2008 and 2014 was conducted. Pre-treatment MRIs were used for localization of tumor and tumor/tumor bed appearance. All MRI were stripped of identifiers including dates, in order to blind the radiologist to the presence of multiple post-chemoradiotherapy (CRT) MRI for those patients on surveillance versus those just completing CRT, to avoid bias. The radiologist was also blinded to endoscopy, clinical exam notes and surgical histopathology and was only aware that the patient underwent chemoradiotherapy and not if they underwent surgery or NOM. MRI was only included if within 3-weeks of an endoscopic assessment for tumor.
Rectal MRI
Rectal MRI was performed, on different MRI scanners manufactured by GE Healthcare as previously described [5] at a field strength of 1.5 Tesla or 3 Tesla using a standardized MRI protocol that included standard high resolution T2-weighted imaging in axial, sagittal, coronal and oblique orientation (TR: 4400-5000; TE: 90-110; echo train length: 12–24; slice thickness: 3–4 mm; interslice gap: 1 mm; FOV: 20 cm; matrix: 320 × 160; NEX: 2), an axial DW sequence (single-shot spin-echo EPI sequence, b-values: 0 and 750–1,000 s/mm2; TR: 1,800–5,550ms; TE: 60–112ms slice thickness: 3–5 mm; interslice gap: 1 mm; FOV: 18–40 cm; matrix: 96–256 × 96–128; NEX: 3–6; mean acquisition time: 2.4 min) and a sagittal DCE-MRI sequence (TR: 3.1–7.9 ms; TE: 0.9–4.2 ms; slice thickness: 4–8 mm; no interslice gap; FOV: 20–34 cm; matrix: 256–320 × 128-219; mean temporal resolution: 8.3 (5–11.5) s; 40-50 phases; mean acquisition time: 5.2 min). A bolus of Gd-DTPA (Magnevist, Bayer Schering) at a constant dose of 0.1 mmol/kg was power injected at a rate of 2 ml/s followed by a saline flush for all patients. No adverse events were reported from the index test.
Reader strategy and grading scales used
One expert radiologist (MG) with 15 years’ experience with pelvic MRI assessed residual tumor using standard MRI using a 5-point scale previously published [3]. Finally, at the same session, DCE-MRI was added and a new assessment was made using a novel 5-point confidence scale created by the authors based on experience (Appendix A). Flexible sigmoidoscopy was re-reviewed by two surgeons (PBP and JJS), with 5 and 2 years’ experience, who re-read the flexible sigmoidoscopy notes and reviewed the combination of the digital rectal exam (DRE) and endoscopy photos but also gave strong deference to the treating surgeon’s note. Surgeons were blinded to MRI results, selected treatment and further clinical outcome and independently assigned a confidence level score for an overall clinical assessment. Disagreements were discussed and reconciled in consensus with a third surgeon with 25 years of experience. The 3-point response scale of an internal protocol (Appendix B) [7] was used for flexible sigmoidoscopic assessment of residual tumor (1 – complete response; 2 – near complete response; 3 – incomplete response). This was determined at a consensus conference at Memorial Hospital in January 2015 involving a multi-disciplinary team of North American and European rectal cancer experts which took into consideration the current literature and need for a prospective assessment tool [7-11]. The reference standard was composite including histopathology after surgical resection or 18 months minimum follow up for those patients managed with a non-operative treatment strategy off-protocol.
Patient Treatment
The CRT regimen consisted of a total of 5600 cGy of radiation (4500 cGy to the pelvis, with an integrated boost to the primary tumor and involved nodes of 5000 cGy, followed by a 600 cGy boost to the primary tumor and involved nodes) in 28 fractions of 180-200 cGy each, over a 5-6-week period. Starting on the first day of RT, patients receive 5-FU administered by continuous infusion, or capecitabine, for the duration of radiotherapy.
Patient exclusions and final cohort
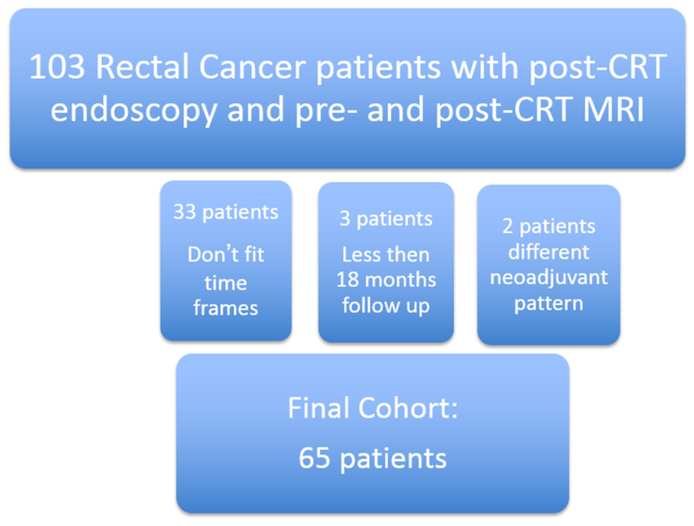
One hundred-three consecutive rectal cancer patients had post-CRT endoscopy and pre- and post-CRT MRI. We excluded 33 patients that did not fit the time frames required; 3 patients with less than 18 months follow up and 2 patients who had a different pattern of neoadjuvant treatment. The final cohort size was 65 patients (Figure 1]. The median time between the completion of chemotherapy and endoscopy was 43 days (mean 45.2, range 30-87 days). Of 65 patients 37 were men (57%) and the median age was 51 years (range: 30-77yr). Twenty-eight patients were female with mean age of 54 years (range 26-86yr). Patients had clinical stage II (n=17) and III (n=48) locally advanced rectal cancer (Table 1).
Figure 1.
Patient flow chart
Table 1.
Clinical and pathologic stages of Rectal Cancer
| MRI baseline (cT, CN-category) | Pathology (ypT, ypN) | |
|---|---|---|
| T0 | 0 | 7 |
| Tis | 0 | 0 |
| Tx | 0 | N/A |
| T1 | 0 | 3 |
| T1/2 | 4 | N/A |
| T2 | 6 | 19 |
| T2/3 | 1 | N/A |
| T3 | N/A | 22 |
| T3a | 2 | N/A |
| T3b | 38 | N/A |
| T3c | 6 | N/A |
| T3d | 3 | N/A |
| T4a | 1 | 0 |
| T4b | 4 | 1 |
| Nx | 12 | N/A |
| N0 | 5 | 39 |
| N+ | 48 | N/A |
| N1 | N/A | 8 |
| N2 | N/A | 5 |
N/A = This T or N category not used in clinical or pathologic staging
cT = clinical (MRI/endorectal ultrasound and digital rectal examination) T stage
cN = clinical (MRI/endorectal ultrasound and digital rectal examination) N stage
yp = post therapy pathologic stage
Sensitivity, specificity, positive and negative predictive values were calculated for standard MRI, standard MRI plus DCE, clinical evaluation and all tests together. The cutoff for calculation of diagnostic parameters was set between confidence levels 1 and 2 for clinical assessment and between levels 2 and 3 for MRI assessment; for all tests together, the cutoff was set to the maximum value of Youden’s J statistic [12]. Sensitivity and specificity were compared between strategies using McNemar’s test. ROC curves were generated and the area under the ROC curve (AUC) was calculated for each strategy and compared using the method of Delong, Delong & Clarke-Pearson [13]. All tests were evaluated for statistical significance at alpha level 0.05. Statistical analysis was performed using SAS version 9.4.
Results:
Reference standard
Complete response (CR) was observed in 20 of 65 patients (31%). Of 46 patients who had surgery, 6 had a pathologic CR (ypT0N0) and of 19 patients managed non-operatively, 14 had clinical CR (recurrence-free during follow-up). Median follow-up time for clinical CR patients was 28 months (range: 19-38 months).
Clinical and MRI assessments (Table 2, 3 and Figure 2-6)
Table 2.
Clinical and MRI assessment results (N=65)
| Frequency (%) | |
|---|---|
| Clinical assessment | |
| 1 – Complete response | 17 (26%) |
| 2 – Near complete response | 20 (31%) |
| 3 – Incomplete response | 28 (43%) |
| T2wMRI / DWI * | |
| 1 – Complete response | 11 (17.7) |
| 2 – Good response | 7 (11.3) |
| 3 – Moderate response | 7 (11.3) |
| 4 – Slight response | 23 (37.1) |
| 5 – No response | 14 (22.6) |
| T2wMRI / DWI / DCE † | |
| 1 – Complete response | 13 (20.3) |
| 2 – Good response | 8 (12.5) |
| 3 – Moderate response | 6 (9.4) |
| 4 – Slight response | 23 (35.9) |
| 5 – No response | 14 (21.9) |
Missing for 3 patients
Missing for 1 patient
Table 3.
Diagnostic parameters for clinical and MRI assessments (with 95% CI)
| Clinical* | T2wMRI+DWI* | T2wMRI+DWI+DCE* | Clinical + T2wMRI+DWI+DCE† |
|
|---|---|---|---|---|
| N | 65 | 62 | 64 | 64 |
| Sensitivity | 55.0 (31.5, 76.9) | 42.1 (20.3, 66.5) | 52.6 (28.9, 75.6) | 42.1 (20.3, 66.5) |
| Specificity | 86.7 (73.2, 94.9) | 76.7 (61.4, 88.2) | 75.6 (60.5, 87.1) | 95.6 (84.9, 99.5) |
| PPV | 64.7 (38.3, 85.8) | 44.4 (21.5, 69.2) | 47.6 (25.7, 70.2) | 80.0 (44.4, 97.5) |
| NPV | 81.3 (67.4, 91.1) | 75.0 (59.7, 86.8) | 79.1 (64.0, 90.0) | 79.6 (66.5, 89.4) |
| AUC | 0.69 (0.54, 0.84) | 0.66 (0.51,0.81) | 0.68 (0.54, 0.83) | 0.72 (0.57, 0.87) |
Univariate analysis results; cutoff for calculation of diagnostic parameters was set between confidence levels 1 and 2 for clinical assessment and between levels 2 and 3 for MRI assessments.
Multivariate analysis results; cutoff for calculation of diagnostic parameters was set at the maximum value of Youden’s J statistic, sensitivity + specificity − 1 = 0.38.
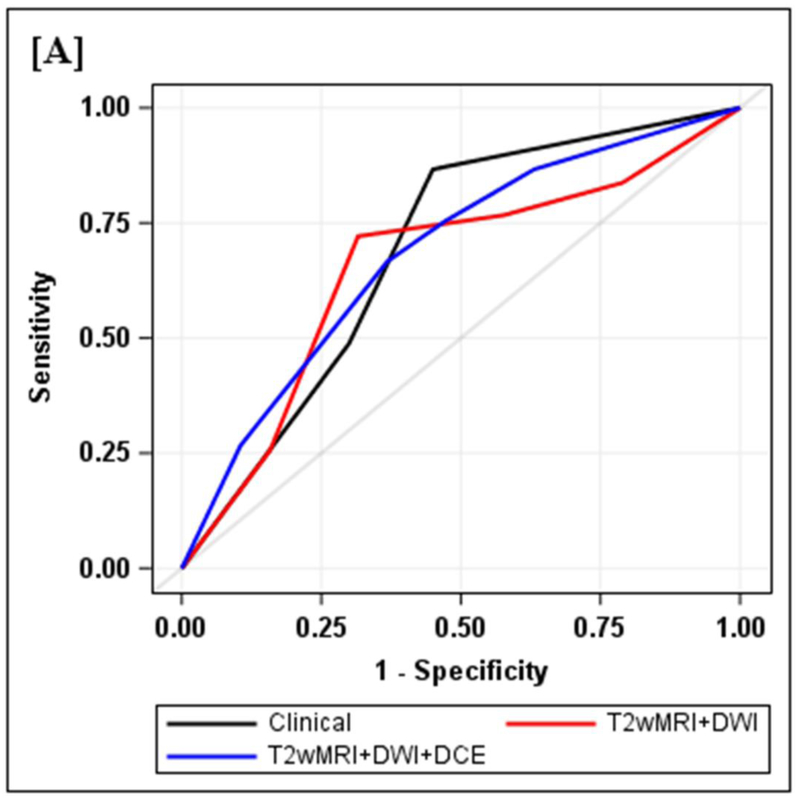
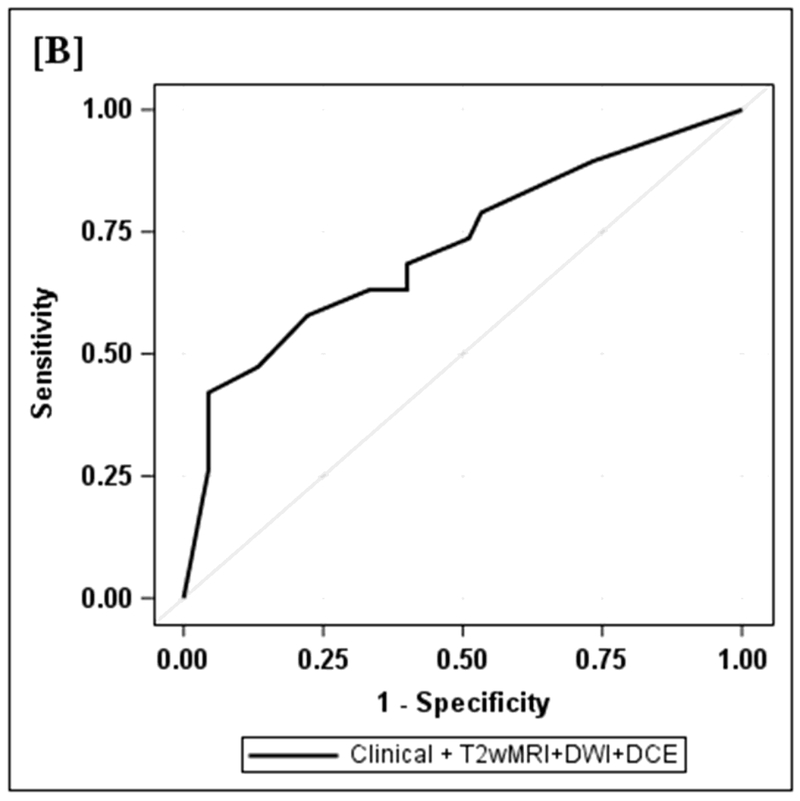
Figure 2.
Diagnostic performance of clinical and MRI assessments
2A: ROC curves for clinical, T2wMRI+DWI and T2wMRI+DWI+DCE: Diagnostic performance of clinical and MRI assessments. Clinical assessment had the highest sensitivity, specificity, positive and negative predictive values. The AUC was similar to standard MRI and standard MRI with added DCE (0.69, 0.66, 0.68). Comparisons of sensitivity and specificity showed that all reading strategies were not significantly different (p>0.05). Each of the ROC curves based on the MRI assessments was not significantly different from the ROC curve based on clinical evaluation (standard MRI, p=0.80; standard MRI+DCE, p=0.91).
2B: ROC curve for both clinical and T2wMRI+DWI+DCE included in multivariate mode. Diagnostic performance of clinical and MRI assessments combined. The highest specificity 43/45 (95.6) and highest AUC (0.72) were achieved by the combination of all strategies including clinical evaluation, standard MRI and DCE-MRI.
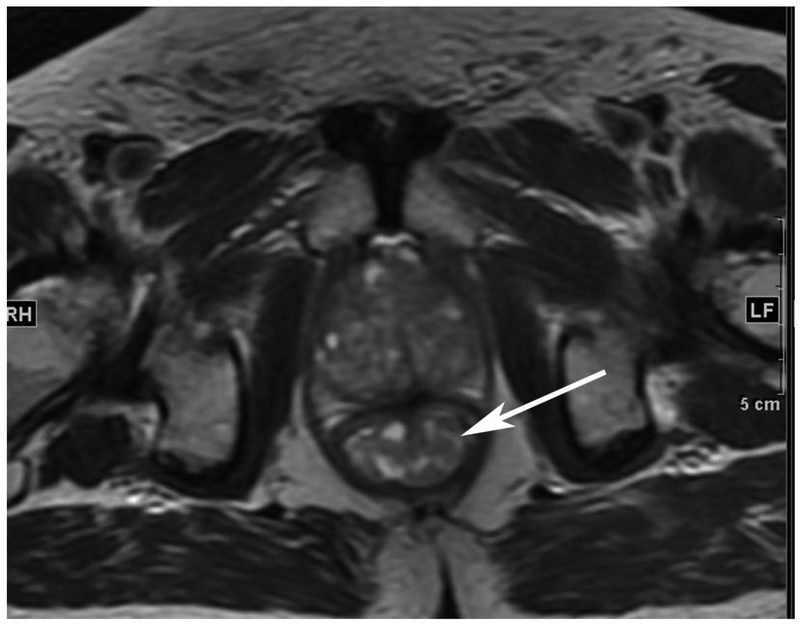
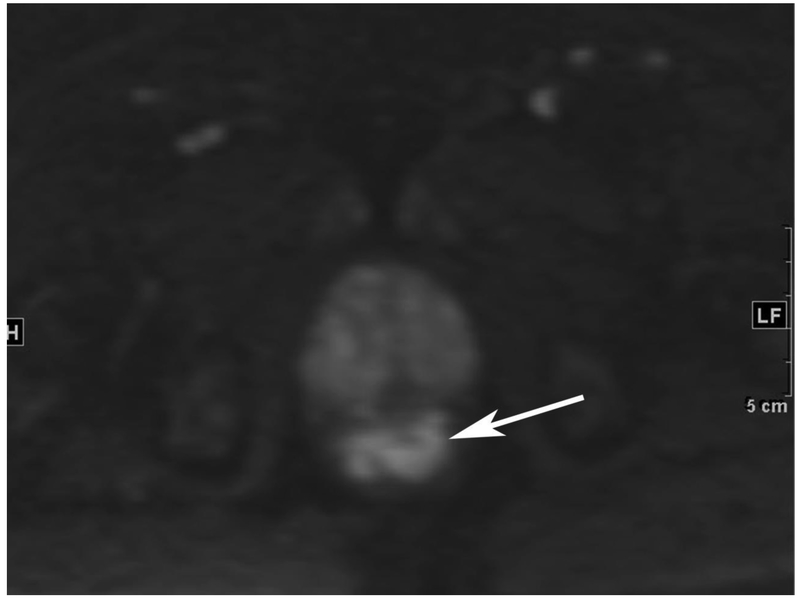
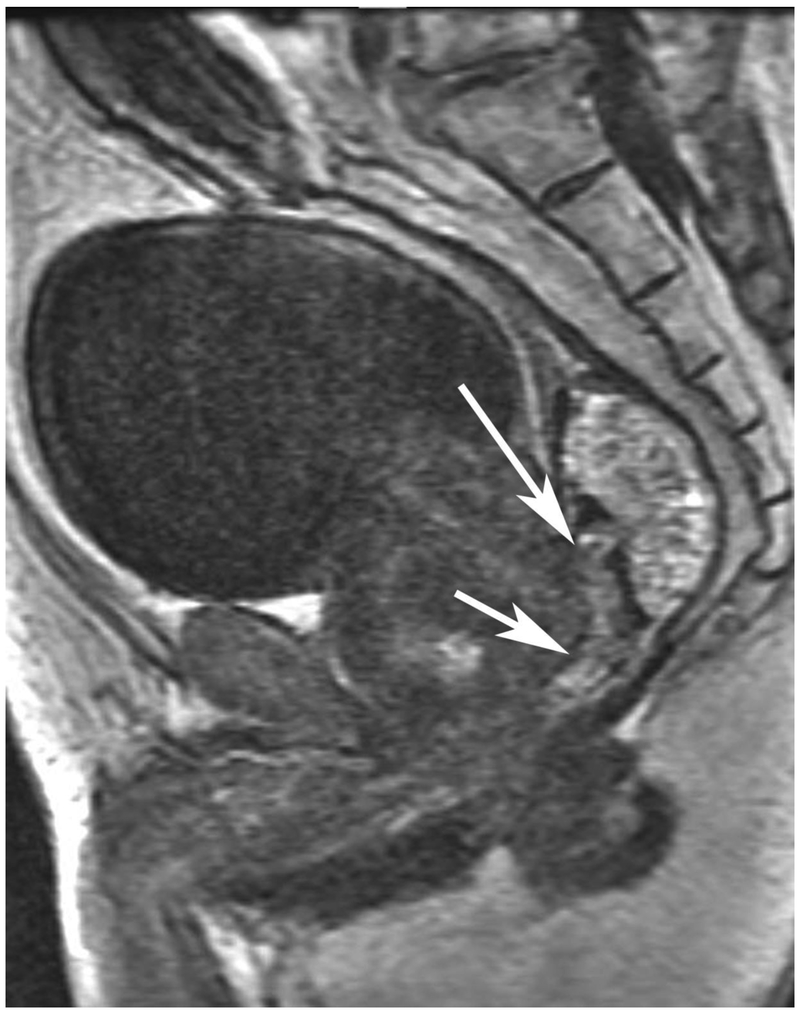
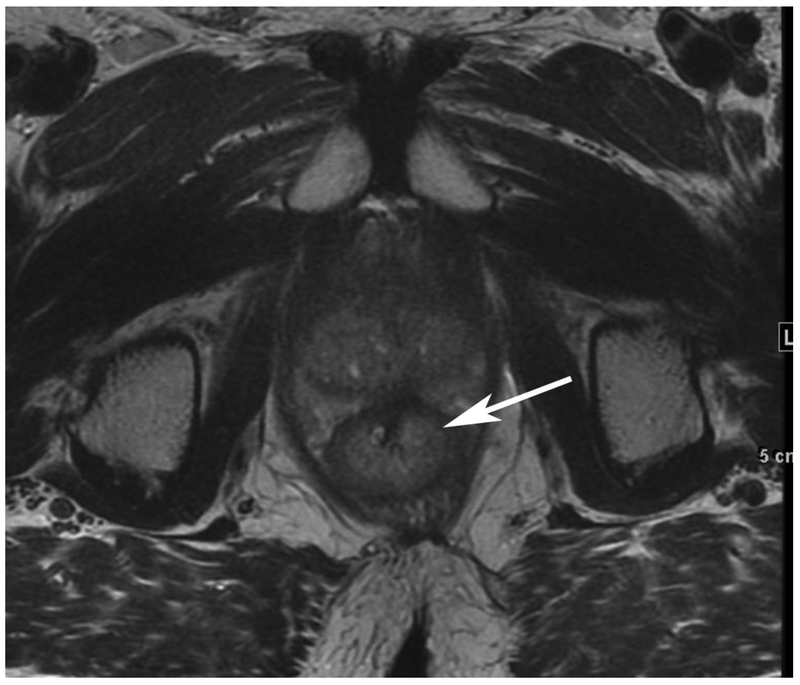
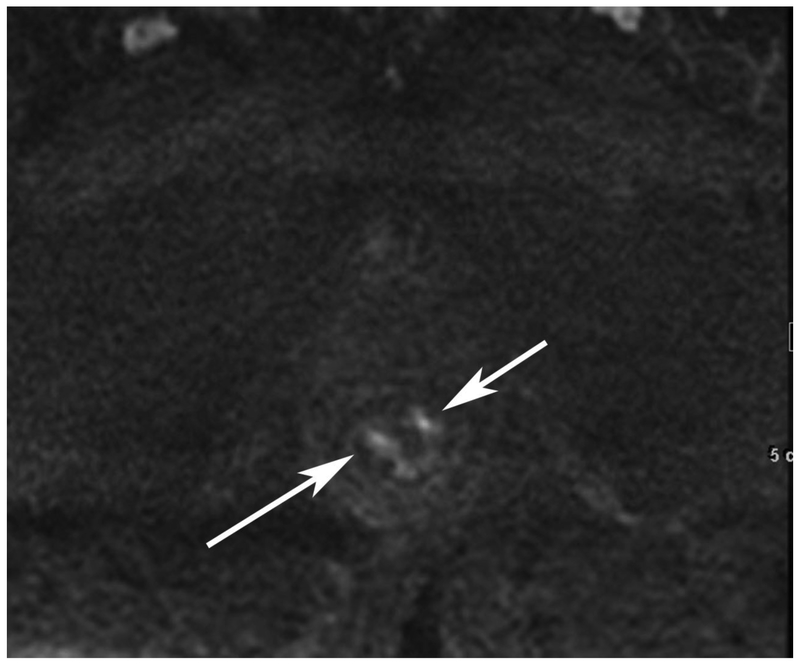
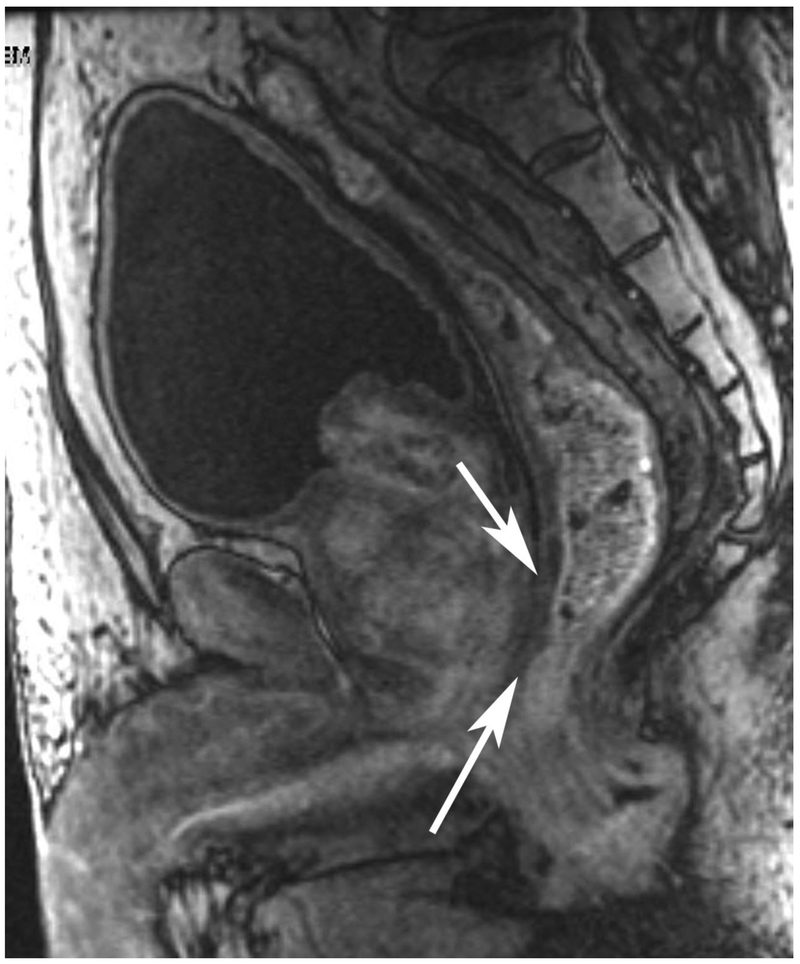
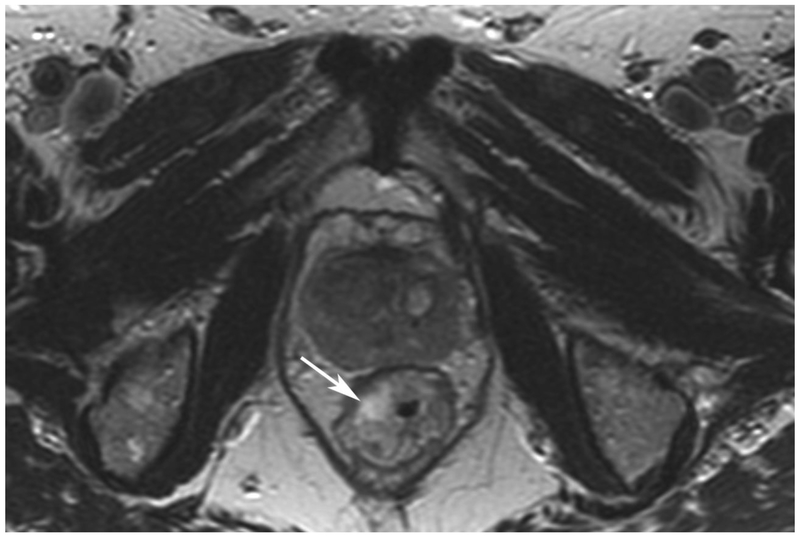
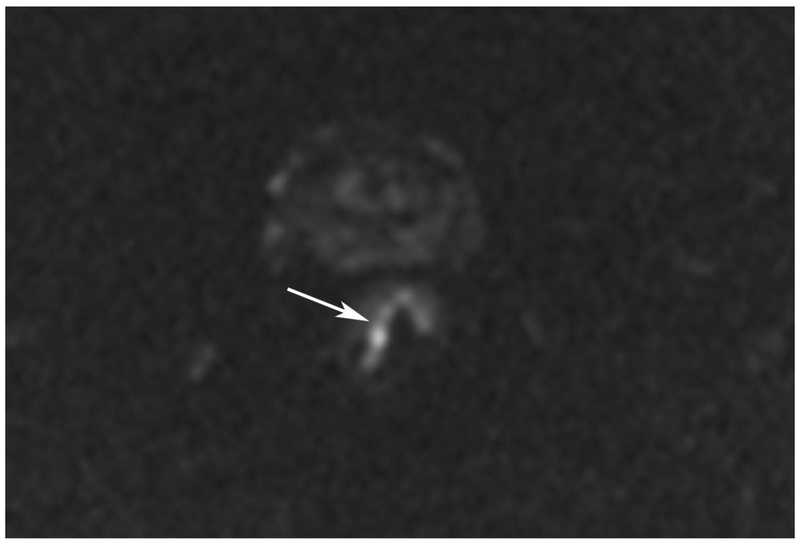
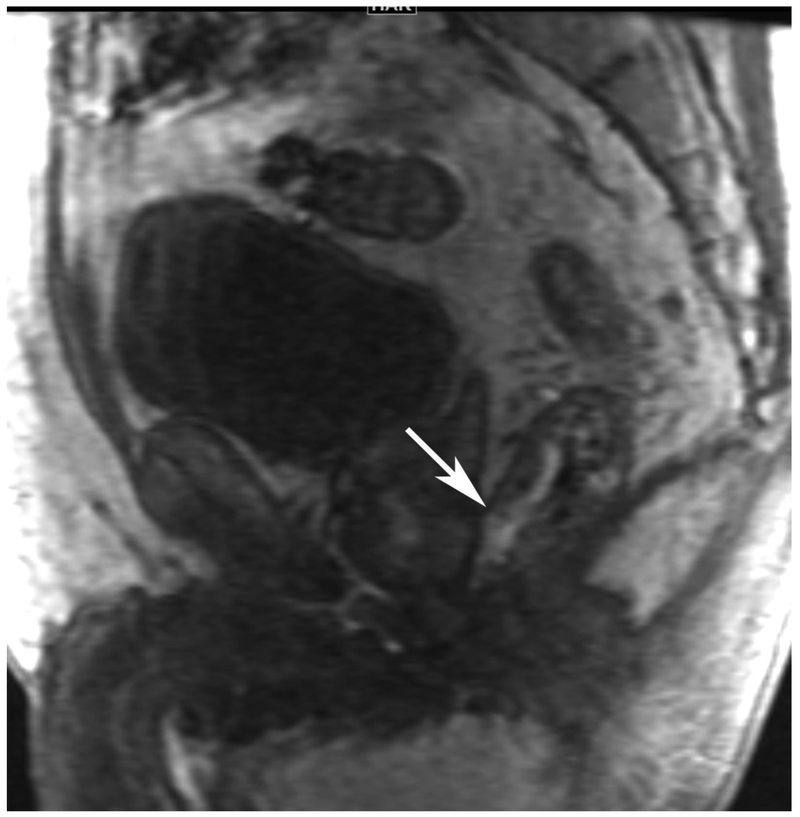
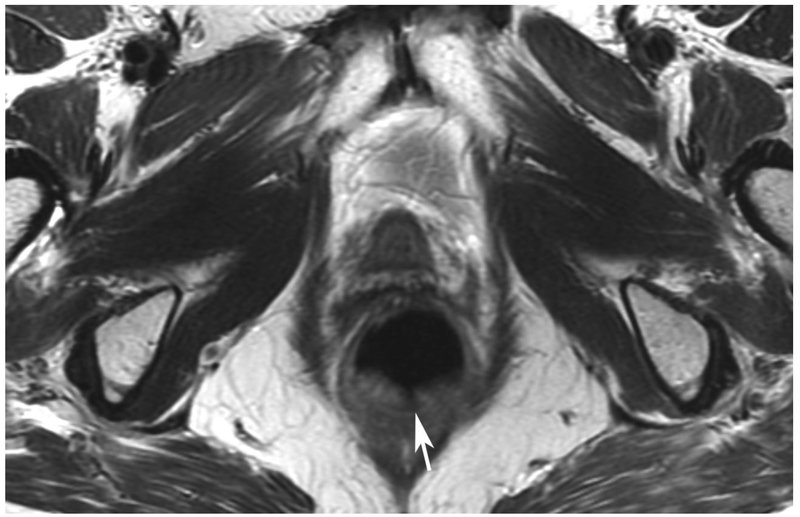
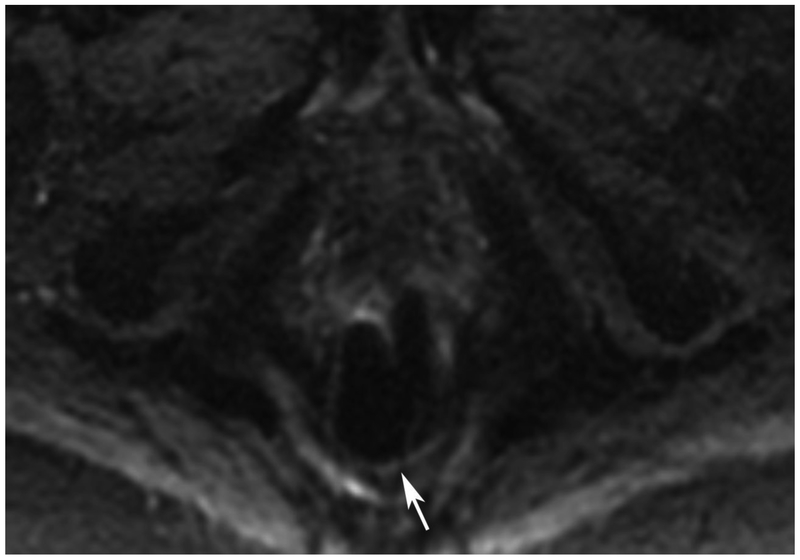
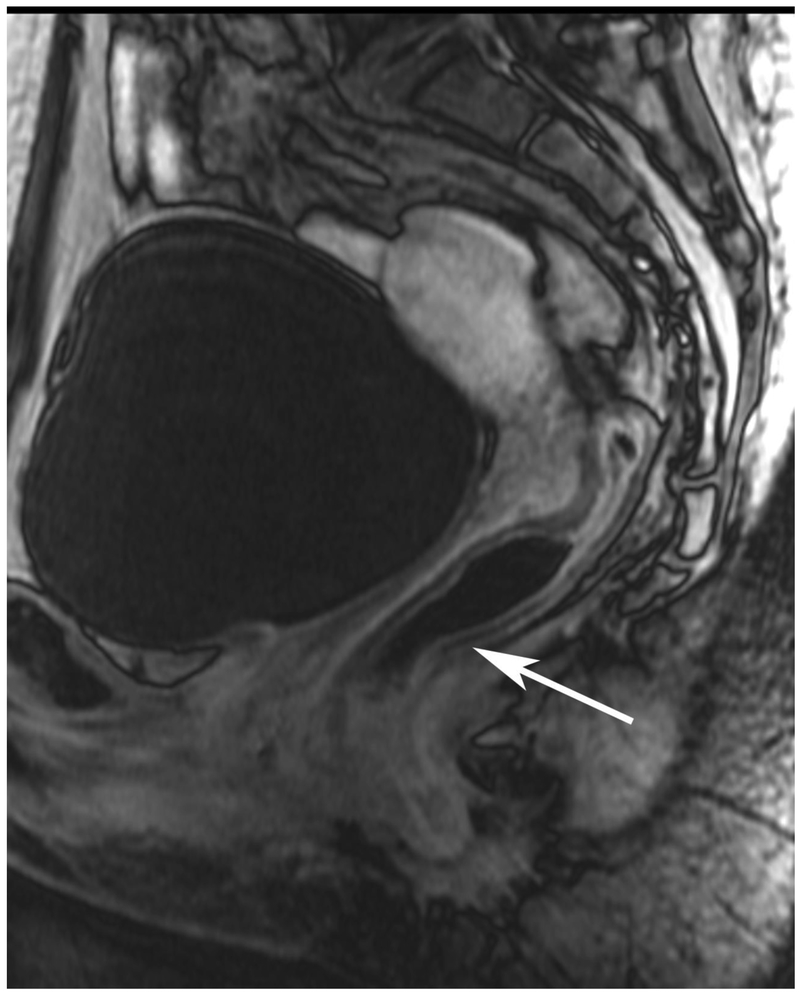
Figure 6.
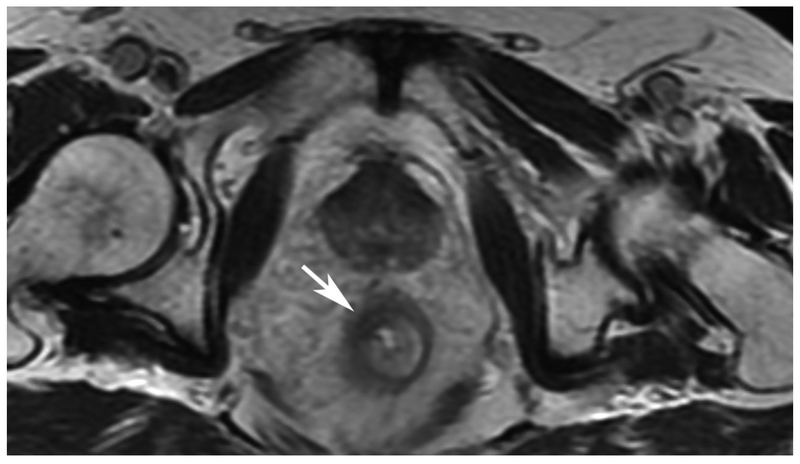
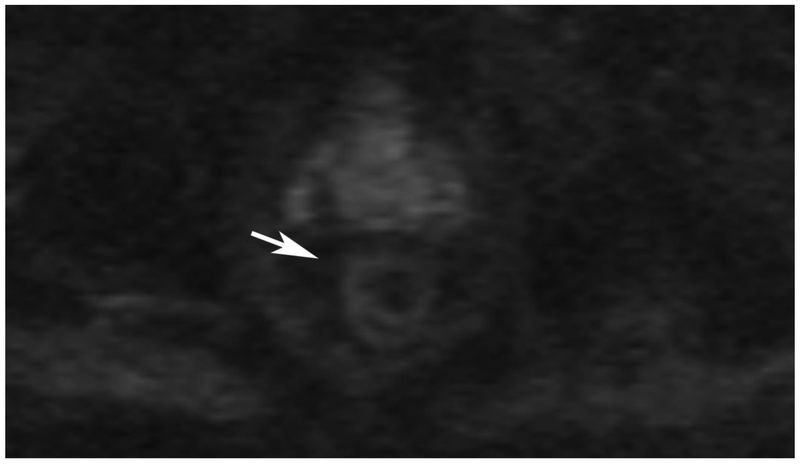
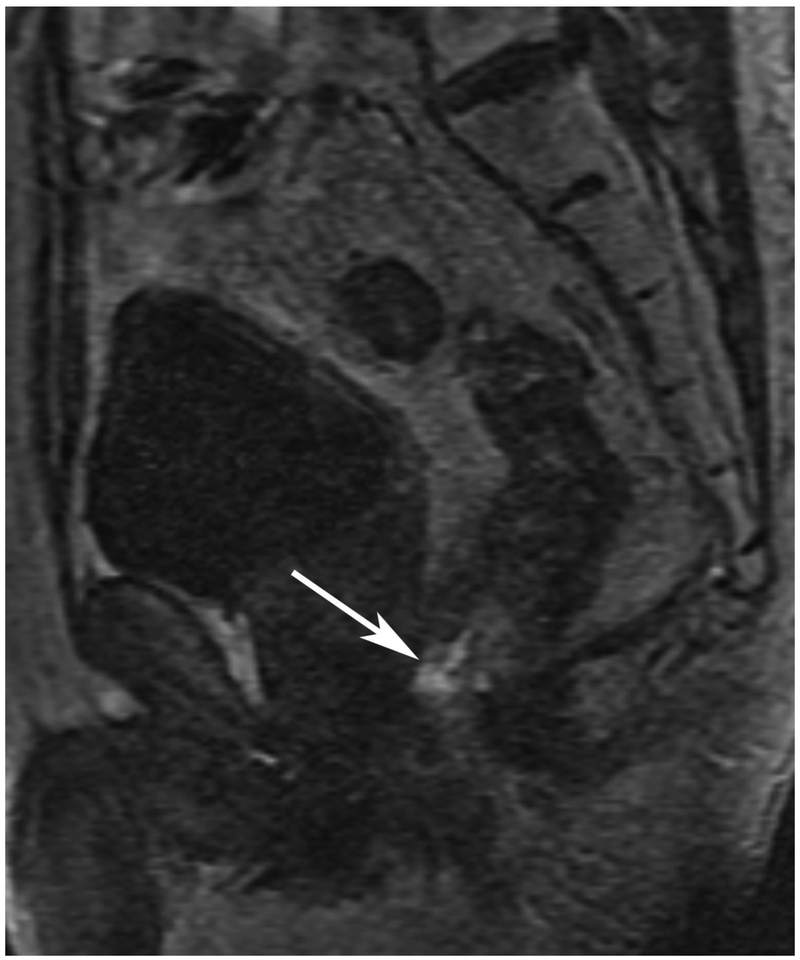
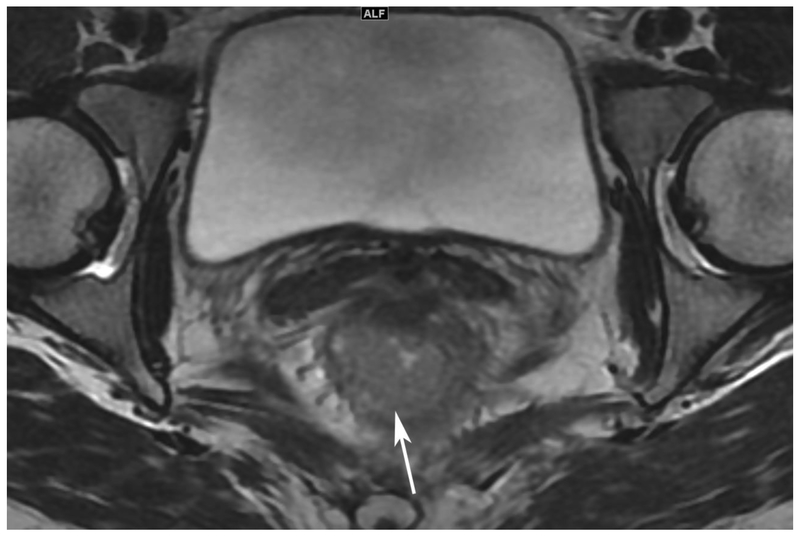
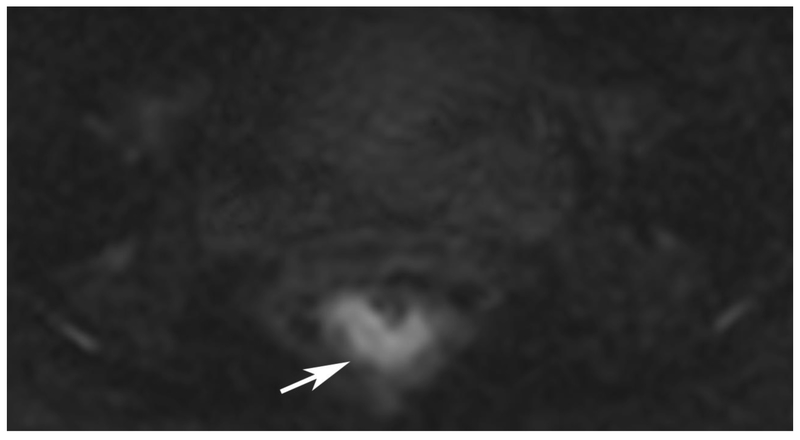
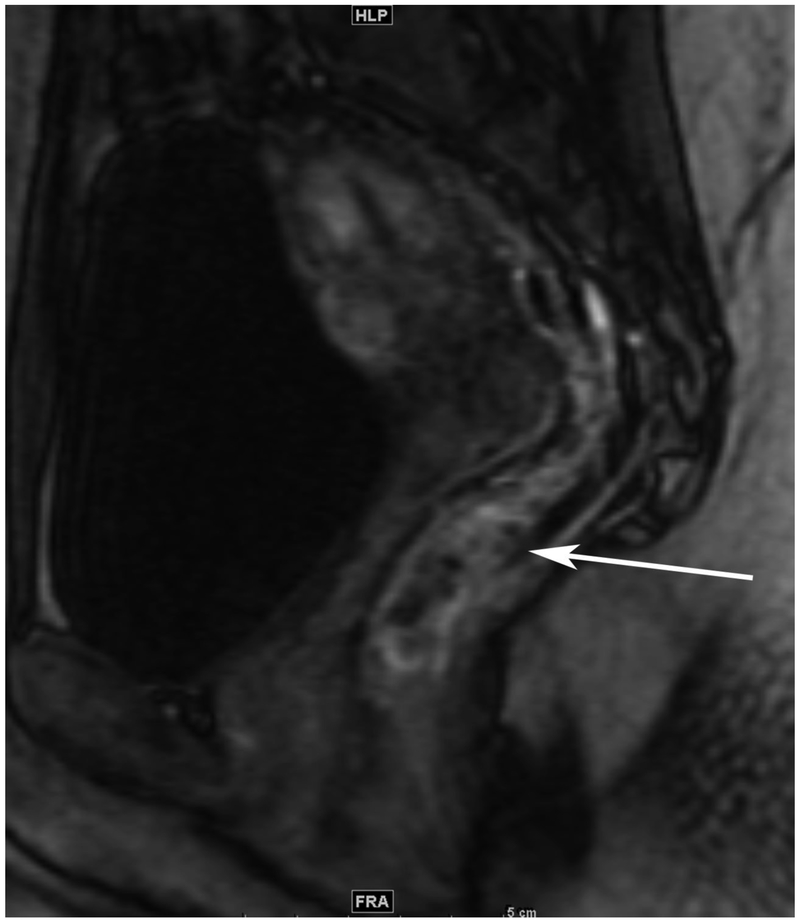
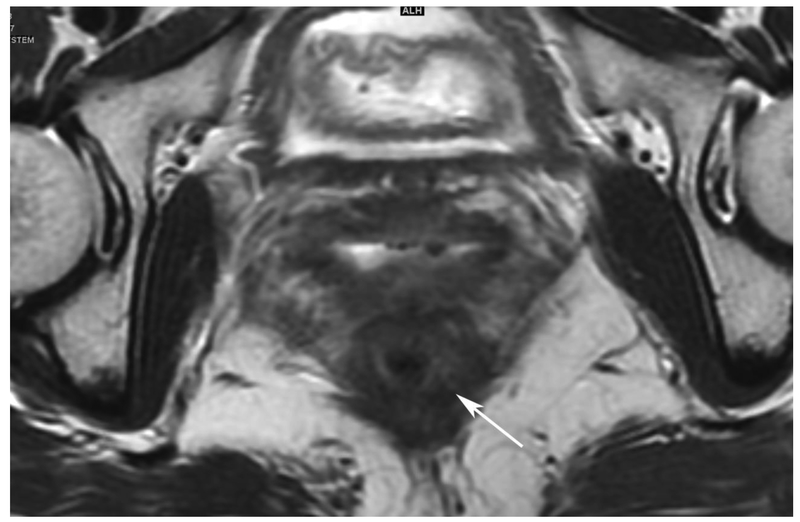
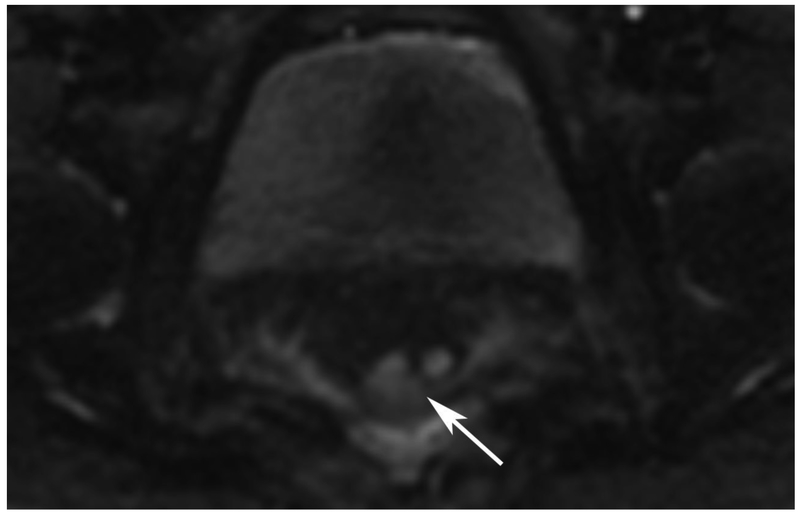
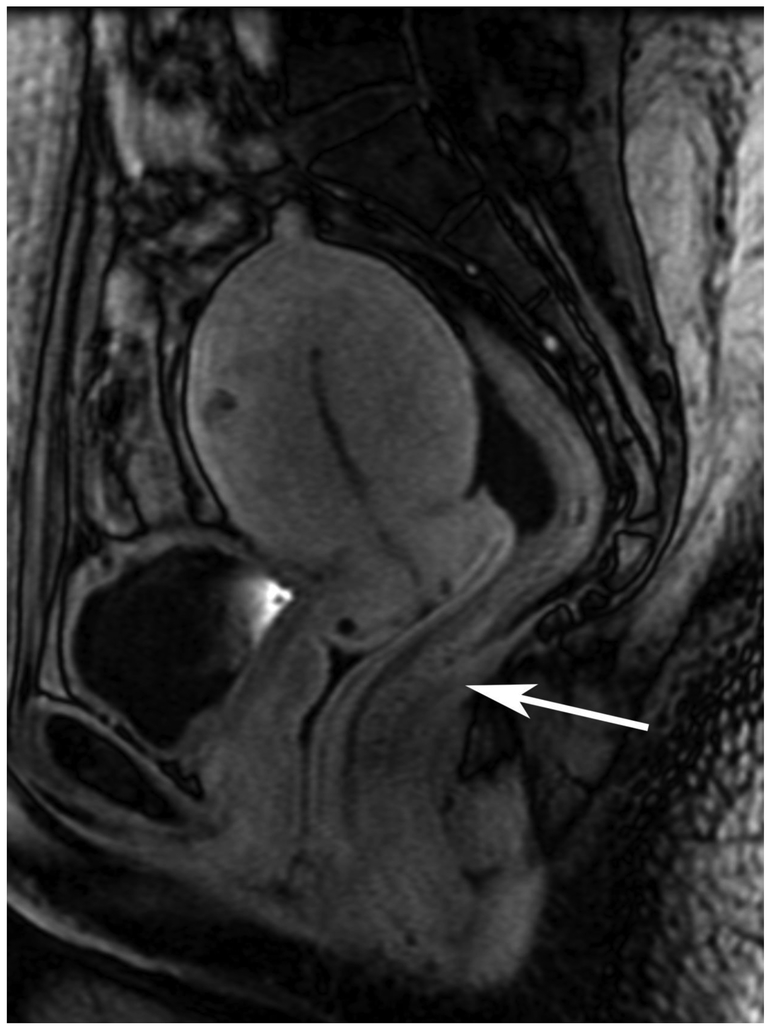
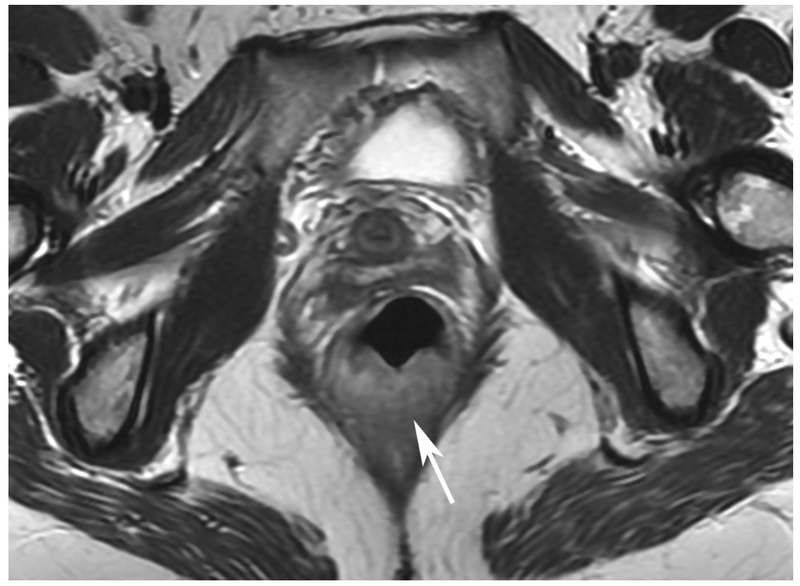
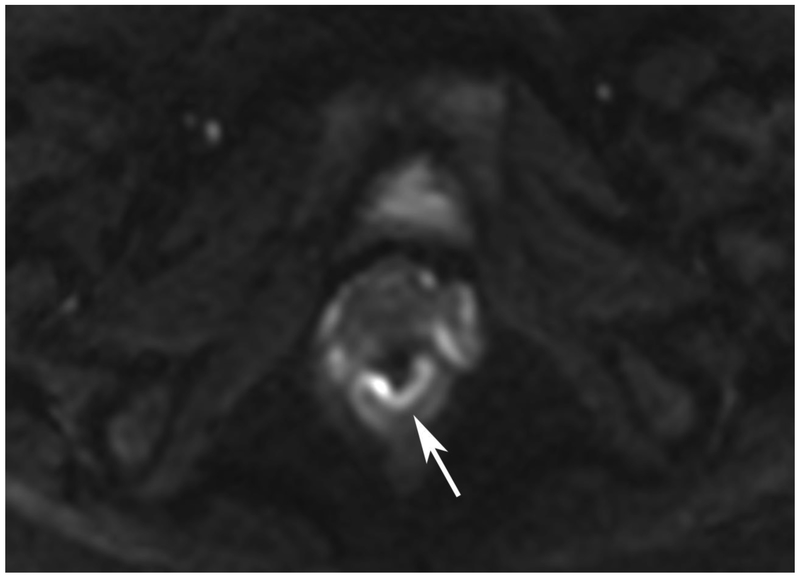
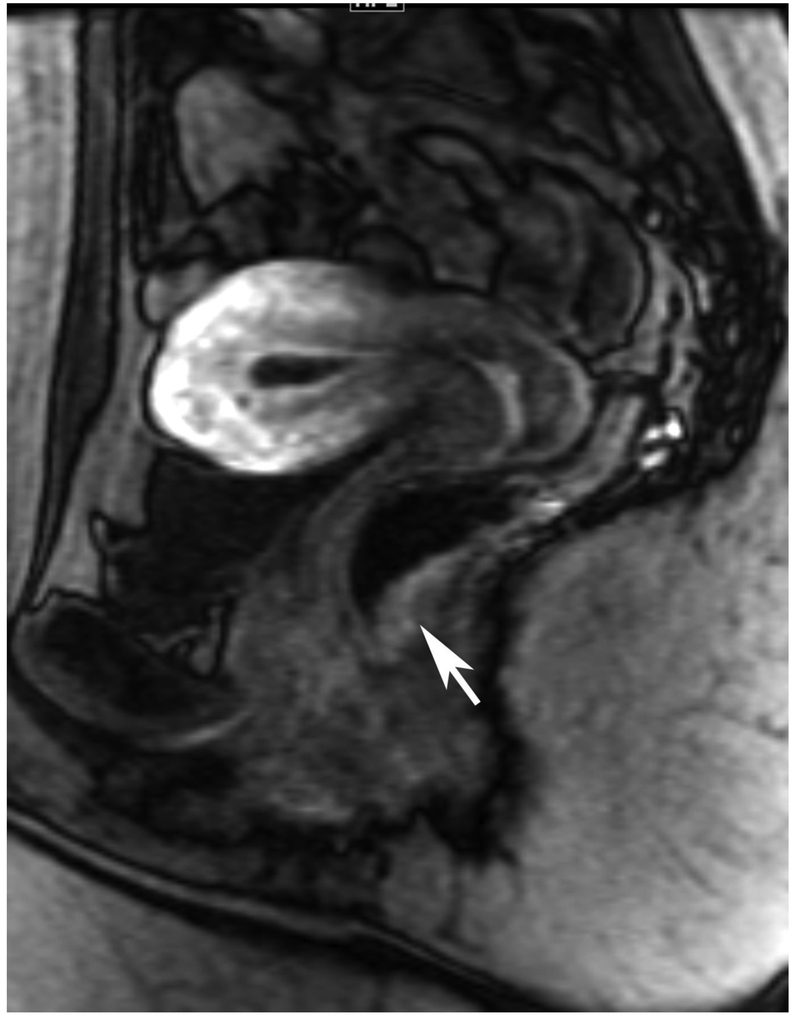
72-year-old male with rectal cancer with complete clinical response after CRT and false positive DWI, but true negative DCE. Three and one-half year follows up patient remains free of disease with no local tumor regrowth.
A. Baseline axial T2-weighted image showing low anterior tumor (arrow)
B. Baseline axial DWI b800 showing strong tumor diffusion restriction (arrow)
C. Baseline sagittal dynamic contrast-enhanced image with tumor blush (arrow)
D. Post-CRT axial T2-weigthed image shows thickened mucosa, indeterminate for tumor (arrow)
E. Post-CRT axial DWI b800 shows few foci of diffusion restriction (arrows)
F. Post-CRT sagittal dynamic contrast-enhanced image shows absence of focal tumor blush and only normal mucosal enhancement
Clinical assessment judged the presence of complete response in 17/65 (26%) patients whereas standard MRI with added DCE-MRI found 13/65 (20.3%) to be complete responders (Table 2). Clinical assessment had the highest sensitivity, specificity, positive and negative predictive values. The AUC for clinical assessment was similar to standard MRI and standard MRI with added DCE (0.69, 0.66, 0.68). Comparisons of sensitivity and specificity showed that all reading strategies were not significantly different (p>0.05). Each of the ROC curves based on the MRI assessments was not significantly different from the ROC curve based on clinical evaluation (standard MRI, p=0.80; standard MRI+DCE, p=0.91). The ROC curves for standard MRI and standard MRI and DCE were not significantly different from each other (p=0.82) [8]. The highest specificity 43/45 (95.6) and highest AUC (0.72) were achieved by the combination of all strategies including clinical evaluation, standard MRI and DCE-MRI (Figure 2B, Table 2).
Discussion:
In this study of the additional value of DCE-MRI over standard MRI (T2WI and DWI-MRI) for identification of complete responders to CRT, we found no overall added value of DCE-MRI based on AUC. Fewer false negative results occurred when adding DCE-MRI, but this was not statistically significant. All evaluation strategies amongst clinical, standard MRI and standard MR with added DCE-MRI showed similar AUC. The highest AUC however, was achieved by combining all strategies.
Though not statistically significant, the sensitivity to identify pCR/cCR, when adding DCE-MRI, showed the greatest difference compared with T2WI plus DWI-MRI alone. This finding is curious as we might have instead anticipated a higher specificity as follows: a tumor felt to be resolved on other sequences might show a small but very conspicuous focus of perfusion, thus preventing an assignment as true positive for pCR/cCR. The other situation would seem less intuitive; that regular sequences would show findings suspicious for tumor residua; but DCE-MRI, by lack of focal enhancement, would arbitrate towards pCR/cCR. That is to say, on DCE-MRI, like in general, a positive finding is often more impressionable than a negative one. However, the data bear out that fewer false negatives resulted with the use of DCE-MRI. Though not statistically significant, the highest PPV was attained with the use of clinical assessment alone; the method most able to avoid the false positive assignment of complete response.
While studies have been done using both quantitative and semiquantitative evaluation of DCE-MRI to assess for the presence of complete response [6], we are unaware of any publication using a visual assessment scale or other qualitative features of DCE-MRI images such as ours. A recent meta-analysis showed consistently improved sensitivity for predicting tumor response using DWI-MRI compared with the use of T2WI alone [14] and a more recent seminal study showed the benefit of DWI and its role when a clinical assessment was included [3]. As such, we did not choose to evaluate the added value of DWI to T2WI assessment alone. Also, it would seem unlikely, given the prior results and the recent ESGAR recommendations encouraging the use of DWI [15] that radiologists would cease from incorporating DWI into the re-staging evaluation of rectal cancer. Finally, like Maas et al, and after which this study was designed [3], we too showed that as a stand-alone evaluation method, clinical assessment was superior to any imaging approach used amongst T2 plus DWI, or T2 plus DWI plus DCE. This is encouraging given the expertise and routine use of these evaluations, and the low cost. Nonetheless, based on the overall operating characteristics, the combination of all imaging sequences compared with clinical exam alone performed similarly. The addition of all imaging strategies to the clinical evaluation afforded the highest AUC of 0.72 and afforded the highest specificity and PPV and thus the fewest false positive assessments of CR. Should we continue to use DCE-MRI for response assessment? Should we encourage others to start using it if they aren’t already? These are challenging questions and are not answered effectively in this small retrospective study with wide confidence intervals. Given the minimal added advantage over DWI and clinical evaluation and given the need for an IV injection of gadolinium-based contrast agent, there would be substantial obstacles to making this routine practice and, so at this time, we would not favor its routine use. Furthermore, as we gain experience with DWI we have become even more impressed by its potential to supplement the information provided by T2WI alone. A more formal, prospective multicenter study using DWI and including single center DCE collection is near completion at our institution, which may answer these questions with greater power than the current retrospective one [7].
We acknowledge limitations to our study. Our study is primarily hypothesis-generating and exploratory. It was not specifically powered in advance since we only had access to a convenience sample. In addition to its relatively small cohort size and retrospective nature, we used one expert radiologist, similar to the Maas study design, in a proof-of-principle first study of visual assessment of DCE only. This reader has 15 years of experience with this sequence and therefore reproducibility with other radiologists would need further study. The DCE-MRI scale used came from our institutional experience and would require formal validation. A number of our patients underwent NOM and we do not have pathology proof of lack of tumor for cCR. However, the use of a surrogate of a minimum of 18 months of clinical follow up without tumor regrowth has precedent in the literature [1, 3]. Finally the clinical evaluation scale used is currently undergoing validation in a multicenter prospective trial and awaits the final results to strengthen its merit [7].
In conclusion, in a cohort of rectal cancer patients undergoing imaging evaluation for post-CRT response, the addition of DCE-MRI to standard MRI, did not improve overall operating characteristics compared with standard MRI or clinical evaluation alone. Of note is that all imaging sequences combined could achieve the same accuracy as the clinical impression from endoscopy and digital rectal examination. Nonetheless, the highest AUC was achieved combining clinical evaluation, standard MRI and DCE-MRI. Given these results - the small, non-statistically significant incremental value of DCE-MRI, and the requirement for gadolinium-based contrast agent injection-these disadvantages probably out-weigh any advantages hypothetically generated in this proof of concept study using one expert radiologist, and while further study would be of interest, widespread adoption of DCE-MRI for the evaluation of tumor response is not advised at this time. However, DWI-MRI continues to show efficacy and has already been adopted by many radiologists in keeping with the recent meta-analyses indicating its added value to using T2WI alone when assessing response of rectal cancer to CRT [10].
Supplementary Material
Figure 3.
67-year-old male with rectal cancer and pathological complete response after CRT with false positive DCE-MRI
A. Baseline axial T2-weighted image showing partly mucinous tumor (arrow)
B. Baseline axial DWI b800 showing tumor diffusion restriction (arrow)
C. Baseline sagittal dynamic contrast-enhanced image with tumor blush (arrow)
D. Post-CRT axial T2-weighted image shows scar in tumor bed (arrow)
E. Post-CRT axial DWI b800 shows absence of diffusion restriction in tumor bed (arrow)
F. Post-CRT sagittal dynamic contrast-enhanced image shows apparent residual tumor blush (arrow)
Figure 4.
31-year-old female with rectal cancer and 50% tumor response after CRT at pathology and false negative DCE-MRI
A. Baseline axial T2-weighted image showing posterior tumor (arrow)
B. Baseline axial DWI b800 showing strong tumor diffusion restriction (arrow)
C. Baseline sagittal dynamic contrast-enhanced image with heterogeneous tumor blush (arrow)
D. Post-CRT axial T2-weighted image shows ill-defined, decreased soft tissue in tumor bed (arrow)
E. Post-CRT axial DWI b800 shows residual diffusion restriction in tumor bed (arrow)
F. Post-CRT sagittal dynamic contrast-enhanced image shows complete lack of focal enhancement in tumor bed (arrow)
Figure 5.
45-year-old female with rectal cancer with pathological complete response after CRT and true negative DCE-MRI
A. Baseline axial T2-weighted image showing low posterior tumor (arrow)
B. Baseline axial DWI b800 showing strong tumor diffusion restriction (arrow)
C. Baseline sagittal dynamic contrast-enhanced image with tumor blush (arrow)
D. Post-CRT axial T2-weighted image shows little or no residual soft tissue in tumor bed (arrow)
E. Post-CRT axial DWI b800 shows absence of diffusion restriction in tumor bed (arrow)
F. Post-CRT sagittal dynamic contrast-enhanced image shows absence of residual tumor blush (arrow)
Key Points.
The addition of dynamic contrast-enhanced MRI to standard MRI, including DWI-MRI, may not significantly improve accuracy of response assessment in rectal cancer treatment
Clinical assessment consisting of digital rectal examination and endoscopy is the most accurate standalone test to assess response to chemoradiotherapy in rectal cancer
Combining MRI using DWI and DCE with the clinical assessment may potentially improve the accuracy for response assessment in rectal cancer
Methodology:
retrospective
diagnostic or prognostic study
performed at one institution
Acknowledgments
Funding:
This study has received funding by NIH.
Research reported in this publication was supported by the National Cancer Institute of the National Institutes of Health under Award Number R25CA020449. The content is solely the responsibility of the authors and does not necessarily represent the official views of the National Institutes of Health
Non-common abbreviations and acronyms
- ADC
apparent diffusion coefficient
- cCR
clinical complete response
- cGy
centi-Gray
- CRT
chemoradiotherapy
- DCE
dynamic contrast-enhanced
- ESGAR
European Society of Gastrointestinal and Abdominal Radiologists
- FU
fluorouracil
- NAT
neoadjuvant treatment
- NEX
number of signal averages
- NOM
non operative management
- pCR
pathologic complete response
Footnotes
Guarantor:
The scientific guarantor of this publication is Marc J. Gollub, MD.
Conflict of interest:
The authors of this manuscript declare no relationships with any companies, whose products or services may be related to the subject matter of the article.
Statistics and biometry:
Ms. Andrea Knezevic, MS and Dr. Mithat Gonen, PhD, kindly provided statistical advice for this manuscript.
Informed consent:
Written informed consent was waived by the Institutional Review Board.
Ethical approval:
Institutional Review Board approval was obtained.
References
- 1.Habr-Gama A, Perez RO, Nadalin W et al. (2004) Operative versus nonoperative treatment for stage 0 distal rectal cancer following chemoradiation therapy: long-term results. Ann Surg 240(4): 711–717 [DOI] [PMC free article] [PubMed] [Google Scholar]
- 2.Hassan I, and Cima RR. (2007) Quality of Life After Rectal Resection and Multimodality Therapy Journal of Surgical Oncology 96: 684–692 [DOI] [PubMed] [Google Scholar]
- 3.Maas M, Lambregts DMJ, Nelemans PJ, Heinjen LA, Martens MH, Leijtens JWA. (2015) Assessment of Clinical Complete Response After Chemoradiation for Rectal Cancer with Digital Rectal Examination, Endoscopy, and MRI: Selection for Organ-Saving Treatment Ann Surg Oncol 22:3873–3880 [DOI] [PMC free article] [PubMed] [Google Scholar]
- 4.Gollub MJ, Gultekin DH, Akin O, Do RK, Fuqua JL, Gonen M. Dynamic contrastenhanced MRI for the detection of pathological complete response to neoadjuvant chemotherapy for locally advanced rectal cancer. Eur Rad 102; 22(4): 821–831 [DOI] [PubMed] [Google Scholar]
- 6.Hötker AM, Tarlinton L, Mazaheri Y, Woo KM, Gönen M, Saltz LB, Goodman KA, Garcia-Aguilar J, Gollub MJ. Multiparametric MRI in the assessment of response of rectal cancer to neoadjuvant chemoradiotherapy: A comparison of morphological, volumetric and functional MRI parameters. Eur Radiol (2016) 26:4303–4312 [DOI] [PMC free article] [PubMed] [Google Scholar]
- 7.Dijkhoff RAP, Beets-Tan RGH, Lambregts DMJ, Beets GL, Maas M. (2017) Value of DCE-MRI for staging and response evaluation in rectal cancer: A systematic review. European Journal of Radiology 95: 155–168. [DOI] [PubMed] [Google Scholar]
- 7.Smith JJ; Chow OS; Gollub MJ; Nash GM; Temple LK; Weiser MR; Guillem JG; Paty PB; Avila K; Garcia-Aguilar J Organ Preservation in Rectal Adenocarcinoma: a phase II randomized controlled trial evaluating 3-year disease-free survival in patients with locally advanced rectal cancer treated with chemoradiation plus induction or consolidation chemotherapy, and total mesorectal excision or nonoperative management. BMC Cancer 2015; 15: 767–780. [DOI] [PMC free article] [PubMed] [Google Scholar]
- 8.Habr-Gama A, Perez RO, Wynn G, Marks J, Kessler H, Gama-Rodrigues J. (2010) Complete clinical response after neoadjuvant chemoradiation therapy for distal rectal cancer: characterization of clinical and endoscopic findings for standardization. Dis Colon Rectum 53(12): 1692–8. [DOI] [PubMed] [Google Scholar]
- 9.Guillem JG, Chessin DB, Shia J, et al. (2005) Clinical examination following preoperative chemoradiation for rectal cancer is not a reliable surrogate end point. J Clin Oncol 23(15):3475–9. [DOI] [PubMed] [Google Scholar]
- 10.Lambregts DM, Maas M, Bakers FC et al. (2011) Long-term follow-up features on rectal MRI during a wait-and-see approach after a clinical complete response in patients with rectal cancer treated with chemoradiotherapy. Dis Colon Rectum 54(12): 1521–8. [DOI] [PubMed] [Google Scholar]
- 11.Curvo-Semedo L, Lambregts DM, Maas M et al. (2011). Rectal cancer: assessment of complete response to preoperative combined radiation therapy with chemotherapy--conventional MR volumetry versus diffusion-weighted MR imaging. Radiology. 260(3): 734–43. [DOI] [PubMed] [Google Scholar]
- 12.Youden WJ. (1950) Index for rating diagnostic tests. Cancer 3: 32–35. [DOI] [PubMed] [Google Scholar]
- 13.DeLong ER, DeLong DM, and Clarke-Pearson DL. (1998) Comparing the areas under two or more correlated receiver operating characteristic curves: A nonparametric approach. Biometrics 44: 837–845 [PubMed] [Google Scholar]
- 14.van der Paardt MP, Zagers MB, Beets-Tan RG, Stoker J, Bipat S. (2013) Patients who undergo preoperative chemoradiotherapy for locally advanced rectal cancer restaged by using diagnostic MR imaging: a systematic review and meta-analysis. Radiology. 269(1): 101–12 [DOI] [PubMed] [Google Scholar]
- 15.Beets-Tan RGH, Lambregts DMJ, Maas M, Bipat S, Barbaro B 4, Curvo-Semedo L (2107) Magnetic resonance imaging for clinical management of rectal cancer: Updated recommendations from the 2016 European Society of Gastrointestinal and Abdominal Radiology (ESGAR) consensus meeting. Eur Radiol 28 (4) : 1465–1475. [DOI] [PMC free article] [PubMed] [Google Scholar]
Associated Data
This section collects any data citations, data availability statements, or supplementary materials included in this article.


