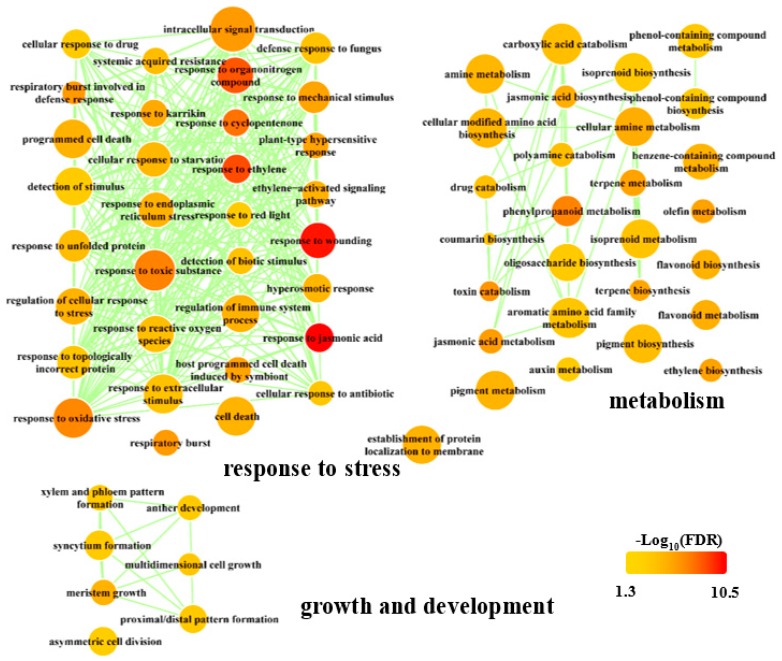
Figure 2.
Significantly enriched gene ontology (GO) terms in biological process. The results were obtained in R using the “clusterProfiler” package, reduced with REVIGO (http://revigo.irb.hr/) and visualized in Cytoscape. The color indicated the significance of GO terms, and node size represented the frequency of the GO term. Only significant GO terms were shown. FDR, false discovery rate.

