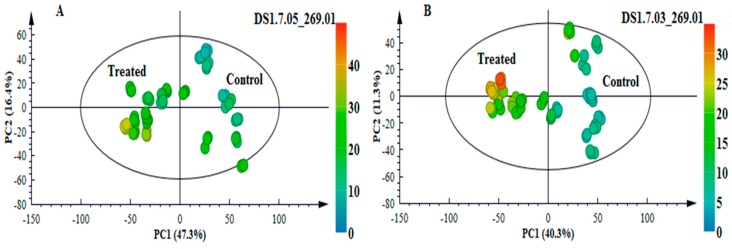
Figure 7.
An unsupervised colour-coded PCA score plot displaying the presence/absence and intensity of the phytoalexin apigenin across the samples. (A): NS 5511 (BT) and (B): NS 5655 (ST). The absence of the metabolite in control samples and presence in samples from infected plants indicates that the metabolite was pathogen-induced.

