Abstract
Gastrodia elata Blume (G. elata) is a prominent traditional herb and its dry tuber is officially listed in the Chinese Pharmacopoeia. To ensure the quality of dried G. elata, the establishment of a nondestructive and convenient method to monitor the drying process is necessary. In this study, a nondestructive low-field nuclear magnetic resonance (LF-NMR) and magnetic resonance imaging (MRI) method was introduced to monitor the drying process of G. elata. Three water states (bound, immobilized, and free) in G. elata samples were investigated through multiexponential fitting and inversion of the NMR data. The variation and distribution of the three water states during drying were monitored by LF-NMR, and the spatial distribution of water and internal structural changes were analyzed by MRI. Linear analysis of the moisture content, L* (lightness), b* (yellowness), and NMR parameters showed good correlations among them. Furthermore, partial least squares regression (PLSR) model analysis, which takes into account all NMR parameters, also showed good correlations among these parameters. All results showed that LF-NMR was feasible and convenient for monitoring moisture content. Therefore, LF-NMR and MRI could be used to monitor the moisture content nondestructively in the drying process of Chinese traditional herbs.
Keywords: Gastrodia elata Blume, drying, LF-NMR, MRI, water variation, chemometric analysis
1. Introduction
Drying is an indispensable step in Chinese herbal medicine processing and is important for ensuring the quality [1]. Drying causes water evaporation to achieve the required moisture content and inhibits the biochemical reactions and proliferation of microorganisms [2]. Therefore, the drying degree (or moisture content) directly affects herb quality. Traditional methods for measuring the moisture content of Chinese herbal medicines include the weight method, differential scanning calorimetry, and near-infrared spectroscopy [3,4]. However, most of these methods are tedious, time-consuming, and interrupt the drying process. To reduce the drying time and obtain Chinese herbal medicines of good quality, it is necessary to develop a rapid and nondestructive method for analyzing water variations during the drying process.
Low-field nuclear magnetic resonance (LF-NMR) is a powerful tool for analyzing water variation in food owing to its nondestructive characteristics, rapid analysis speed, and low cost [5,6]. By measuring the proton relaxation times, the state, distribution, activity, and mobility of water can be determined using LF-NMR [7,8,9,10]. Magnetic resonance imaging (MRI), the other type of NMR technology, has been used to detect the internal distribution of water and structural changes during processing [11]. In recent years, combining NMR with MRI has been widely used to analyze food processing. Geng et al. [12] and Zhang et al. [13] have used both NMR and MRI to study dried sea cucumber rehydration and monitor the natto fermentation process, respectively. LF-NMR and MRI are also sensitive methods for monitoring water variation during drying processes. Cheng et al. [14] and Xu et al. [15] studied the water variation in shrimp and broccoli during drying, successfully applying these measurements to ensure food quality. However, there is no suitable method for analyzing the drying process of Chinese herbal medicines. Therefore, the development of a rapid and nondestructive analytical method for the Chinese herbal medicine industry would be extremely significant.
Gastrodia elata Blume (G. elata) is a prominent traditional herb used in many Asian countries [16]. The dry tuber of G. elata is officially listed in the Chinese Pharmacopoeia and has a beneficial effect on headaches, paralysis, rheumatism, and other nervous disorders [17,18,19]. To process G. elata, it must first be steamed and then dried to obtain high-quality pieces [20]. Therefore, monitoring the drying process of G. elata is important to obtain high-quality products. In this study, a nondestructive NMR and MRI method was introduced to monitor the drying process of G. elata by investigating water variation and internal structural changes. The relationships between moisture content, NMR parameters, and color parameters were investigated through linear analysis. Partial least squares regression (PLSR) analysis, taking into account all NMR parameters, was also applied. This NMR and MRI method could also potentially be applied to other Chinese herbal medicines.
2. Results and discussion
2.1. Effects of Steaming on Water States and Distribution
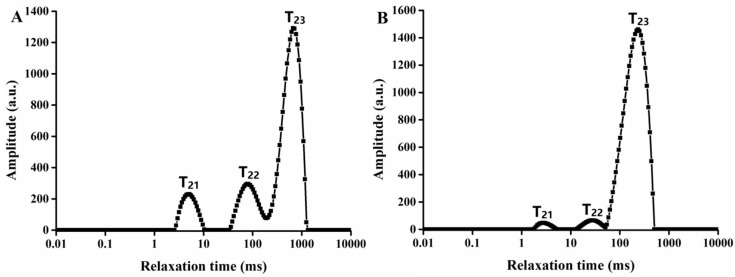
Steaming G. elata is beneficial for drying [21]. Figure 1 shows the transverse relaxation time (T2) curves of fresh G. elata and G. elata after steaming. T2 reflects the chemical environment of protons and degree of water freedom in the sample [22]. The G. elata relaxation time curves showed three peaks, namely, T21 (0.1–10 ms), T22 (10–200 ms), and T23 (200–1000 ms) from left to right. These peaks represent the three molecular environments in which water molecules existed, where T21 corresponds to water binding closely to the macromolecular particles, T22 corresponds to water binding in the cytoplasm, and T23 corresponds to free water in the vacuole and intercellular space with strong mobility [23]. The corresponding signal amplitudes were A21, A22, and A23, respectively, representing the relative moisture contents of the three states.
Figure 1.
LF-NMR T2 relaxation time distribution curves of G. elata (A) before steaming and (B) after steaming.
Table 1 shows changes in the relaxation time and peak area of G. elata before and after steaming. After steaming, A21, A22, and A23 had all changed significantly, and the free water content had increased from 70.88% to 95.45%. Meanwhile, the bound water content had decreased from 11.11% to 1.62% and the content of immobilized water had decreased from 18.01% to 2.93%. These results indicated that the structure of G. elata was damaged by steaming, with water diffusing to the outside owing to differences between the internal and external pressures, while the free water content clearly increased.
Table 1.
Changes in relaxation time and peak area of G. elata before and after steaming.
| A21 (%) | A22 (%) | A2 3 (%) | T21 (ms) | T22 (ms) | T23 (ms) | |
|---|---|---|---|---|---|---|
| Before steaming | 11.11 ± 0.3a | 18.01 ± 0.5a | 70.88 ± 0.4a | 5.18 ± 0.5a | 96.81 ± 0.4a | 584.94 ± 0.4a |
| After steaming | 1.62 ± 0.2b | 2.93 ± 0.6b | 95.45 ± 0.5b | 5.39 ± 0.3a | 89.59 ± 0.5b | 274.18 ± 0.6b |
a Values are means ± standard deviation (n = 3). b Different letters in the same column indicate a significant difference (p < 0.05).
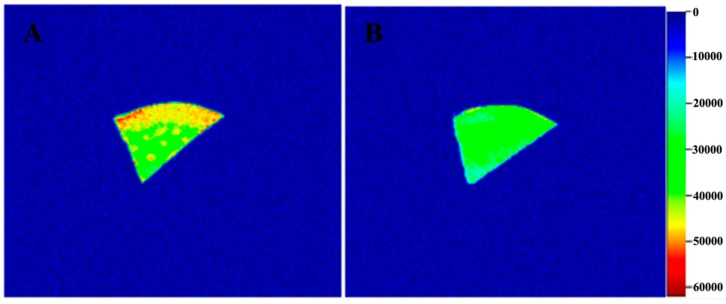
Figure 2 shows cross-sectional MRI images of G. elata before and after steaming, where different colors represent different water contents [24]. From the color strip, red represents the highest moisture content and blue represents the lowest moisture content [25]. The water distribution inside G. elata was uneven before steaming, with the moisture content increasing gradually from inside to outside. The tissue structure was damaged after steaming, which accelerated the space movement of internal moisture, and the moisture distribution became uniform. These results demonstrated that steaming accelerated the drying rate.
Figure 2.
Cross-sectional MRI images of G. elata (A) before steaming and (B) after steaming.
2.2. Transverse Relaxation Time Analysis of G. elata after Steaming at Different Drying Temperatures
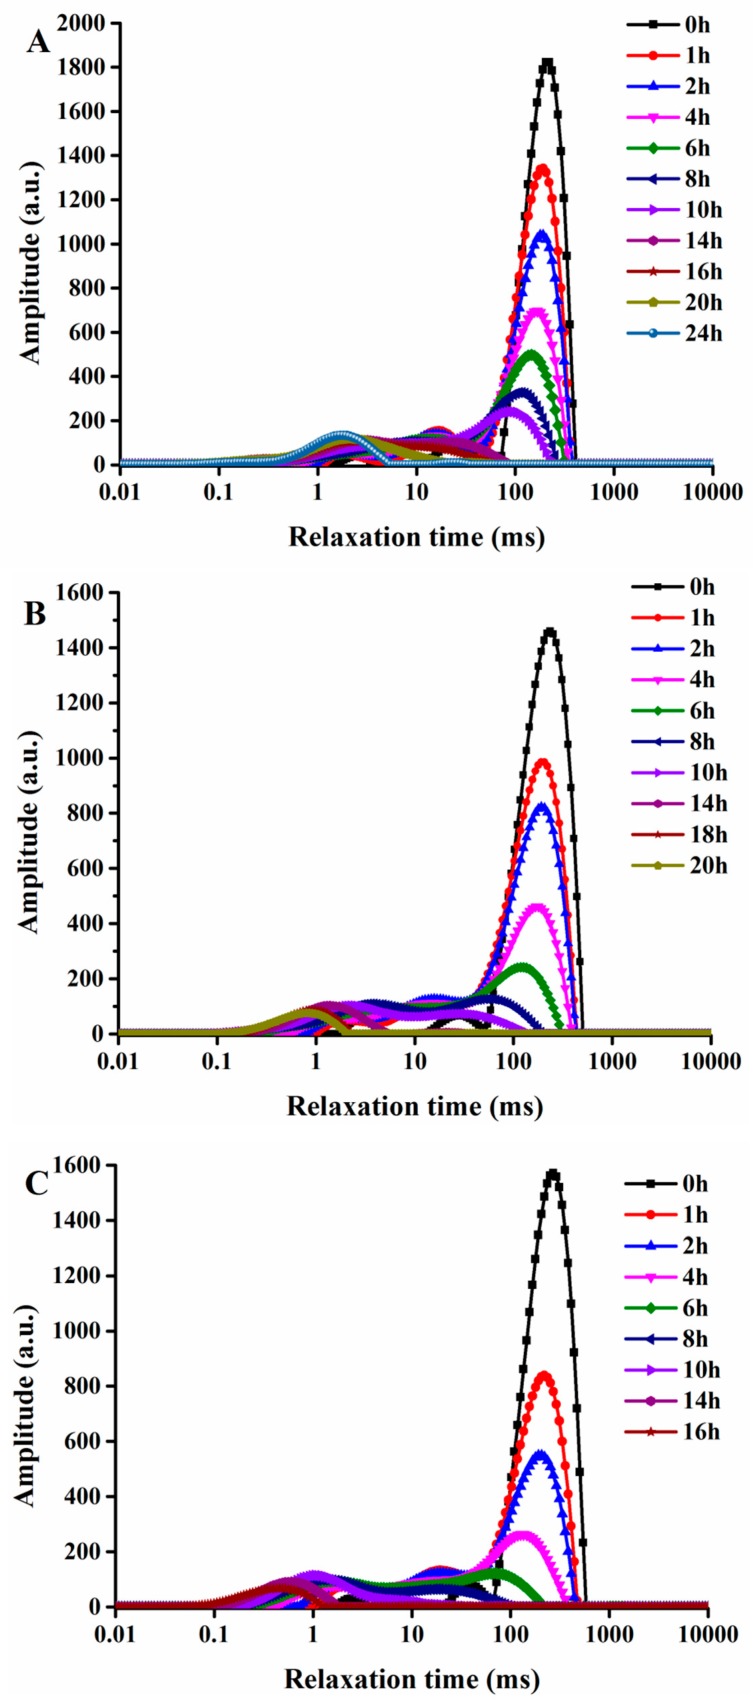
Figure 3 shows the transverse relaxation time curves of G. elata after steaming at different drying temperatures. The drying process changes the water content and states, and can also alter the water binding forces with macromolecules [26]. The peak area gradually decreased and the position of each peak gradually moved to the left. Meanwhile, the degree of water binding with non-water components became increasingly close, and the relaxation time gradually decreased.
Figure 3.
Transverse relaxation time curves of G. elata after steaming at different drying temperatures of (A) 40 °C, (B) 60 °C, and (C) 80 °C.
Changes in the relaxation time and peak area of G. elata (after steaming) dried at 40, 60, and 80 °C are shown in Table 2, Table 3 and Table 4, which explain the changes in water states on the microscale. During the drying process, T21 values showed little change in the ranges 0.53–5.03 ms at 40 °C, 0.69–4.69 ms at 60 °C, and 0.93–4.20 ms at 80 °C. This indicated that bound water was tightly combined with the macromolecular substances and not easily removed during drying. The T22 and T23 values showed a significant decreasing trend with drying, which might be due to destruction of the cell membrane during drying. Macromolecules, such as polysaccharides, in G. elata flow into the intercellular space and increase the solution concentration, which increases opportunities for the combination of macromolecules with water that has poor mobility [27].
Table 2.
Changes in relaxation time and peak area of G. elata dried at 40 °C after steaming.
| Drying Time (min) | T21 (ms) 1,2 | T22 (ms) 1,2 | T23 (ms) 1,2 | A21/g 1,2 | A22/g 1,2 | A23/g 1,2 | ATotal/g 1,2 |
|---|---|---|---|---|---|---|---|
| 2 | 5.03 ± 0.15a | 83.66 ± 4.66a | 248.94 ± 3.65a | 48.01 ± 1.91f | 86.75 ± 3.22e | 2210.86 ± 4.25a | 2345.62 ± 6.23a |
| 4 | 4.47 ± 0.19b | 75.14 ± 5.31b | 234.98 ± 4.60b | 55.03 ± 3.56f | 99.04 ± 2.45d | 2015.86 ± 14.60b | 2169.93 ± 4.26b |
| 6 | 3.99 ± 0.21c | 62.12 ± 4.57c | 215.61 ± 3.73c | 70.58 ± 4.04e | 110.32 ± 4.08c | 1878.33 ± 9.48c | 2059.23 ± 3.58c |
| 8 | 3.27 ± 0.20d | 53.42 ± 2.61d | 200.47 ± 4.26d | 86.37 ± 4.41d | 125.50 ± 3.97b | 1650.33 ± 13.51d | 1862.20 ± 3.22d |
| 10 | 2.82 ± 0.14e | 44.71 ± 3.07e | 186.46 ± 2.99e | 100.57 ± 4.08c | 142.13 ± 2.78a | 1433.37 ± 9.11e | 1676.08 ± 8.21e |
| 12 | 2.26 ± 0.26f | 36.79 ± 2.86f | 172.90 ± 6.29f | 118.61 ± 6.25b | 124.58 ± 4.20b | 1116.68 ± 10.21f | 1359.87 ± 6.58f |
| 14 | 1.63 ± 0.17g | 30.83 ± 1.33fg | 155.35 ± 5.23g | 135.29 ± 4.12a | 95.40 ± 4.06d | 882.68 ± 6.94g | 1113.37 ± 7.66g |
| 16 | 1.21 ± 0.22h | 25.23 ± 1.64gh | 136.09 ± 3.15h | 108.95 ± 4.15c | 104.71 ± 4.69f | 544.84 ± 9.52h | 758.50 ± 6.23h |
| 18 | 0.96 ± 0.08hi | 21.03 ± 1.55hi | 121.28 ± 1.56i | 73.95 ± 4.56e | 56.61 ± 3.17g | 212.35 ± 7.67i | 342.91 ± 5.02i |
| 20 | 0.76 ± 0.06ij | 18.05 ± 1.36i | - | 51.66 ± 2.63f | 32.85 ± 1.86h | - | 84.51 ± 2.18j |
| 22 | 0.53 ± 0.08j | - | - | 33.81 ± 3.33g | - | - | 33.81 ± 1.47k |
1 Values are means ± standard deviation (n = 3). 2 Different letters in the same column indicate a significant difference (p < 0.05).
Table 3.
Changes in relaxation time and peak area of G. elata dried at 60 °C after steaming.
| Drying Time (min) | T21 (ms) 1,2 | T22 (ms) 1,2 | T23 (ms) 1,2 | A21/g 1,2 | A22/g 1,2 | A23/g 1,2 | ATotal/g 1,2 |
|---|---|---|---|---|---|---|---|
| 2 | 4.69 ± 0.35a | 79.83 ± 5.47a | 243.61 ± 4.48a | 50.35 ± 4.09f | 89.75 ± 4.03d | 2129.84 ± 4.88a | 2269.94 ± 12.43a |
| 4 | 4.13 ± 0.60ab | 70.13 ± 6.28b | 226.65 ± 3.32b | 58.03 ± 3.91f | 102.37 ± 2.34c | 1734.84 ± 8.75b | 1895.25 ± 7.83b |
| 6 | 3.69 ± 0.48b | 59.77 ± 3.09c | 208.94 ± 2.63c | 75.253.40e | 115.4 ± 4.17b | 1417.91 ± 11.16c | 1608.55 ± 6.25c |
| 8 | 2.91 ± 0.16c | 50.00 ± 4.05d | 195.80 ± 6.31d | 93.37 ± 4.21d | 133.6 ± 5.11a | 1088.21 ± 4.19d | 1315.18 ± 7.56d |
| 10 | 2.48 ± 0.34cd | 41.83 ± 2.92e | 186.46 ± 2.99d | 105.25 ± 3.22c | 114.71 ± 3.42b | 829.41 ± 4.81e | 1049.37 ± 5.28e |
| 12 | 1.95 ± 0.13d | 33.57 ± 1.51f | 163.23 ± 7.05e | 127.61 ± 5.27a | 89.74 ± 2.40d | 635.05 ± 8.62f | 852.4 ± 4.33f |
| 14 | 1.23 ± 0.28e | 27.92 ± 0.97fg | 145.35 ± 6.31f | 115.29 ± 4.12b | 92.35 ± 2.11e | 415.83 ± 4.36g | 623.48 ± 5.25g |
| 16 | 1.07 ± 0.18e | 22.73 ± 1.38gh | 126.09 ± 3.15g | 96.06 ± 5.44d | 50.98 ± 1.17f | 291.71 ± 6.90h | 438.74 ± 3.28h |
| 18 | 0.86 ± 0.12e | 18.58 ± 2.15h | - | 70.61 ± 5.37e | 32.73 ± 4.25g | - | 103.35 ± 3.22i |
| 20 | 0.69 ± 0.05e | - | - | 40.99 ± 3.30g | - | - | 40.99 ± 2.13j |
1 Values are means ± standard deviation (n = 3). 2 Different letters in the same column indicate a significant difference (p < 0.05).
Table 4.
Changes in relaxation time and peak area of G. elata dried at 80 °C after steaming.
| Drying Time (min) | T21 (ms) 1,2 | T22 (ms) 1,2 | T23 (ms) 1,2 | A21/g 1,2 | A22/g 1,2 | A23/g 1,2 | ATotal/g 1,2 |
|---|---|---|---|---|---|---|---|
| 2 | 4.20 ± 0.14a | 73.84 ± 4.06a | 226.27 ± 5.32a | 57.68 ± 1.93d | 91.08 ± 4.04c | 2026.95 ± 6.34a | 2175.71 ± 9.82a |
| 4 | 3.70 ± 0.49a | 65.46 ± 3.67b | 209.65 ± 4.18b | 72.70 ± 4.75c | 114.61 ± 3.13b | 1546.24 ± 10.91b | 1733.55 ± 8.43b |
| 6 | 2.97 ± 0.22b | 55.10 ± 3.72c | 198.94 ± 5.81b | 90.58 ± 7.13b | 125.40 ± 3.99a | 1136.94 ± 11.04c | 1352.92 ± 7.26c |
| 8 | 2.47 ± 0.24bc | 46.34 ± 4.36d | 185.32 ± 4.90c | 113.37 ± 5.79a | 116.93 ± 4.75b | 774.60 ± 6.61d | 1004.9 ± 5.25d |
| 10 | 1.98 ± 0.18cd | 37.17 ± 1.93e | 166.81 ± 3.20d | 96.92 ± 4.59b | 88.04 ± 2.04c | 570.56 ± 5.58e | 755.52 ± 6.47e |
| 12 | 1.64 ± 0.24d | 28.57 ± 1.38f | 143.23 ± 7.05e | 79.28 ± 2.89c | 63.07 ± 2.58d | 269.21 ± 4.21f | 411.56 ± 5.23f |
| 14 | 1.03 ± 0.15e | 21.58 ± 3.70f | - | 55.96 ± 4.15d | 35.67 ± 3.69e | - | 91.62 ± 4.22g |
| 16 | 0.93 ± 0.22e | - | - | 35.39 ± 3.51e | - | - | 35.39 ± 3.21h |
1 Values are means ± standard deviation (n = 3). 2 Different letters in the same column indicate a significant difference (p < 0.05).
The signal amplitude of the T2 proton relaxation time was standardized against the sample mass, giving A21/g, A22/g, A23/g, and Atotal/g, which represent the signal amplitude per mass of bound water, immobilized water, free water, and total water, respectively [28].
As the area under the signal peak was proportional to the water content, it can be used to estimate the sample water content. The Atotal/g values continued to decline with increasing drying time, which indicated that water always moved in the direction of poor mobility. Furthermore, higher temperatures resulted in faster movement. The A23/g values decreased similarly to the Atotal/g values, which indicated that free water had the highest mobility and was removed first in the drying process. Changes in the A22/g values showed no obvious pattern, possibly owing to cell membrane damage caused by drying and the irregular movement of immobilized water. The A21/g values initially increased and then decreased in the drying process, which might be due to free water and immobilized water moving in the direction of poor mobility with increasing drying time, thus increasing the bound water content. After drying for 16 h, the contents of all three water states decreased, and only bound water remained at the end of drying.
2.3. MRI Analysis of G. Elata during Drying
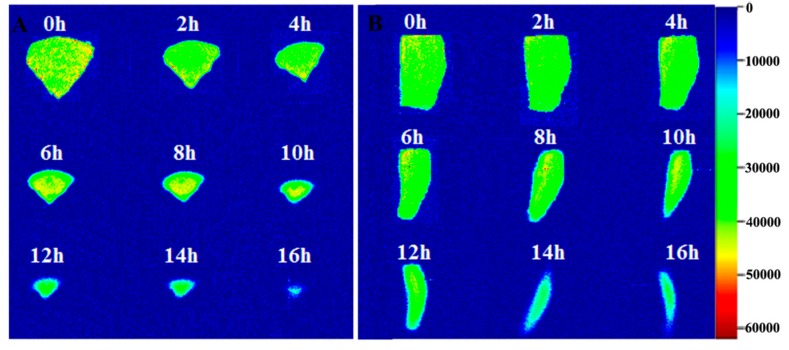
As a fast and nondestructive analytical technology, MRI can analyze the internal structure and water states of samples during the drying process. Figure 4 shows vertical-sectional and cross-sectional MRI images of G. elata during the drying process. The color strip shows that different colors represent different proton densities and indirectly reflect moisture content. As shown in Figure 4, the color of the image was consistent after steaming G. elata, indicating that the water distribution was uniform. As the drying time increased, the yellow area decreased and the green area increased, indicating that moisture was continuously lost during the drying process. The proton density decreased from the outside to the inside, as previously observed in dried eggplant [29]. After drying for 16 h, the MRI image became barely visible, demonstrating that most of the water had evaporated, leaving only bound water that was tightly linked to the macromolecules.
Figure 4.
Vertical-sectional (A) and cross-sectional (B) MRI images of G. elata during the drying process at 60 °C.
2.4. Change in the Color of G. elata at Different Drying Temperatures
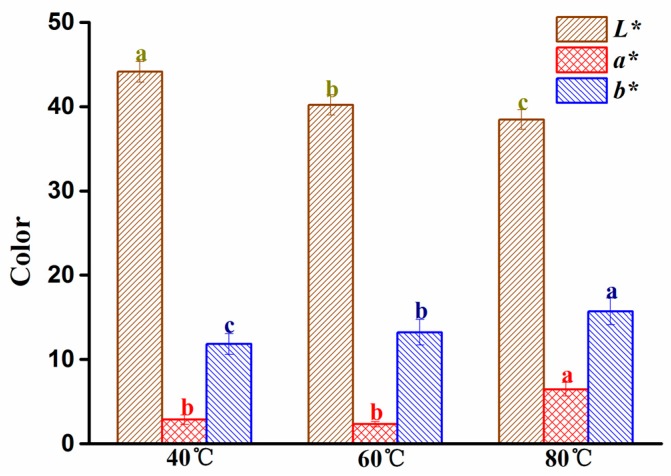
The color of dry G. elata is another important indicator for evaluating herb quality. The impact of temperature on the color parameters (L*, a*, b*) is shown in Figure 5 L* values (lightness) decreased as the drying temperature increased (40, 60, and 80 °C), while b* values (yellowness) increased gradually, and a* values (redness) were significantly higher at 80 °C. These results might be attributed to the occurrence of Maillard browning reactions [30]. Therefore, it is advisable to use lower temperatures during the drying processing to ensure the quality of dried G. elata appearance is maintained.
Figure 5.
Effect of temperature on color parameters L*, a*, and b*. Different letters in the same color column indicate significant difference at p < 0.05.
2.5. Correlation Analysis
As a fast and nondestructive analytical technique, NMR technology can replace some time-consuming methods if the relationships between NMR parameters and relative physicochemical parameters are determined. Relationships among moisture content (MC), LF-NMR parameters, and color parameters were investigated using linear analysis, with the corresponding correlation coefficients shown in Table 5. MC showed very significant correlations with T21, T22, A23/g, and ATotal/g, with coefficients of 0.982, 0.980, 0.990, and 0.996, respectively. Similarly, L* showed very significant correlations with A23/g and Atotal/g, while b* showed significant correlations with T22 and T23. No significant correlation was found between a* and the NMR parameters in the G. elata samples. These results showed that LF-NMR was not only able to measure the moisture content, but also reflected the color of the medicinal material, which can reflect its overall quality.
Table 5.
Correlation coefficients among moisture content (MC), LF-NMR parameters, and color parameters.
| T21 | T22 | T23 | A21/g | A22/g | A23/g | A Total/g | |
|---|---|---|---|---|---|---|---|
| MC | 0.982 * | 0.980 ** | 0.972 * | 0.233 | 0.131 | 0.991 ** | 0.996 ** |
| L* | −0.162 | −0.628 | −0.729 | 0.527 | 0.521 | 0.904 ** | 0.913 ** |
| a* | 0.017 | −0.219 | 0.228 | 0.509 | 0.432 | 0.613 | 0.722 |
| b* | 0.728 | 0.823 * | 0.845 * | 0.749 | 0.071 | 0.769 | 0.776 |
* p < 0.05, significant at the 0.05 level, ** p < 0.01, significant at the 0.01 level.
2.6. Establishment of the PLSR Model
A strong correlation was found between Atotal/g and MC. Therefore, the linear equations can predict the moisture content in G. elata. However, as reported by Li et al. [31], the NMR parameters of T2 curves were extremely collinear. Therefore, it is necessary to establish a more reliable prediction method.
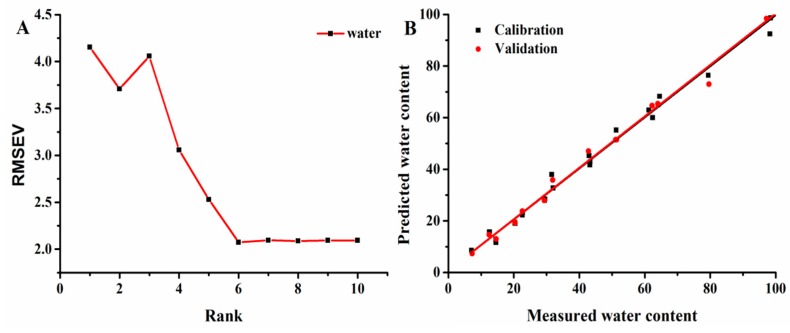
As a reliable and convenient multivariate regression method, PLSR is well-suited to solving multicollinearity problems [32]. Figure 6A shows the relationship between the RMSEV of calibration and rank values, which clearly showed that the best rank value was 6. From the best rank value, predicted values vs. measured values of MC were obtained using the PLSR model. R2c, R2cv, RMSEC, RMSEV, and RPD were used to evaluate the model. The PLSR model for MC gave R2c and R2cv values of 0.994 and 0.993, with RMSEC and RMSEV values of 2.07 and 2.16, while the RPD value was 12.7. These results indicated that PLSR analysis, which accounted for all NMR parameters, also showed good correlations among these parameters. All results demonstrated that LF-NMR was a feasible and convenient method for monitoring moisture content.
Figure 6.
RMSEV of calibration vs. (A) rank values and (B) the measured and predicted plots of the PLSR models for water in G. elata samples.
3. Experimental
3.1. Sample Preparation
Fresh G. elata (second class Gastrodia elata f. glauca) used in this study was purchased from the Xiaocaoba Gastrodia Planting Base in Shaotong City (Shaotong, Yunnan Province, China) and stored in a refrigerator at 4 °C before use. Before each experiment, G. elata was washed and steamed for 10 min in a steamer (Qiaojieer Electric Co. Ltd., Zibo, Shandong, China). After steaming, the G. elata tuber was cut into pieces approximately 4 cm in height and 1 cm in radius with 90° curvature. The weight of each G. elata tuber sample was approximately 10 ± 0.5 g.
3.2. Moisture Content Measurement
The initial moisture content (MC) was calculated using Equation (1):
| (1) |
where W0 (g) is the initial mass and W (g) is the constant mass after drying at 105 °C.
3.3. Drying Process
G. elata tuber samples were laid flat on a metal grid tray and placed in an infrared-forced circulation drying oven (Wujiang Huafei Electric Heating Equipment Co. Ltd., Suzhou, China). The samples were dried at 40, 60, or 80 °C with a constant air velocity of 1 m/s over the tray. The samples were weighed every 30 min for the first hour, and then every 1 h until the change in weight between measurements was less than 0.01 g. All experiments were performed in triplicate.
3.4. LF-1H NMR Measurements
LF-1H NMR measurements were performed using an NMR Analyzer (MesoMR23-060H-I, Niumag Corp., Shanghai, China) equipped with a 0.5 T permanent magnet corresponding to a proton resonance frequency of 20 MHz at 32 °C. The G. elata tuber samples were placed in an NMR tube with an outer diameter of 25 mm. The proton decay signals were collected using the Carr–Purcell–Meiboom–Gill pulse sequence (CPMG) with a τ-value (time between 90° pulse and 180° pulse) of 200 μs, and 90° and 180° pulses of 7.5 and 15 μs, respectively. The NMR measurement parameters were set as follows: Echo time (TE), 0.35 ms; waiting time (TW), 2000 ms; data from 18,000 echoes acquired using 8 repeated scans.
Relaxation time analysis and distributed exponential curve fitting were performed using MultiExp Inv Analysis software (Niumag Corp., Shanghai, China). Multiexponential fitting analysis was performed on the relaxation data using a modified inversion algorithm to obtain improved fitting. The relaxation time and its corresponding water population (area ratio) from this analysis were recorded.
3.5. MRI Detection
MRI was performed using an NMR Analyzer (MesoMR23-060H-I, Niumag Corp., Shanghai, China) equipped with a 25-mm radio frequency coil at 32 °C. The MRI measurement parameters were set as follows: Slice width, 3 mm; slice gap, 1 mm; TR (time repetition), 2000; TE (time echo), 25 ms; average, 4.
3.6. Color Analysis
The fracture surface color of G. elata was measured using an NH310 high-quality portable colorimeter (Shenzhen 3NH Technology Co. Ltd., Shenzhen, China). The color was described in terms of L*, a*, and b*, where L* is lightness (0 for black, 100 for white), a* is green to red, and b* is blue to yellow. All experiments were performed in triplicate.
3.7. Statistical Analysis
Data are reported as means ± standard deviation. The moisture content, transverse relaxation time, and signal amplitude were calculated using the Statistical Package for the Social Sciences version 17.0 (SPSS Inc., Chicago, IL, USA). One-way analysis of variance (ANOVA) was used to determine whether differences between the mean values were significant. Origin 9 (OriginLab Corp., Northampton, MA, USA) was used to produce the figures. PLSR analysis was performed using Unscrambler 9.7 (Camo Software AS, Oslo, Norway). The performance of the PLSR model can be evaluated using the determination coefficients of calibration (R2C) and cross-validation (R2CV), and the root mean square errors of calibration (RMSEC) and cross-validation (RMSECV). In general, a good model should have high R2C and R2CV values, and low RMSEC and RMSECV values.
4. Conclusions
This study indicates that the LF-NMR and MRI method is feasible for monitoring water variation in G. elata samples during the drying process. Three water states (bound, immobilized, and free) in G. elata samples were investigated using multiexponential fitting and inversion of the NMR data. LF-NMR reflected the variation in water states in G. elata samples during drying, while MRI reflected the spatial distribution of water and structural changes. Significant correlations were found among MC, L*, b*, and NMR parameters. PLSR analysis, taking into account all NMR parameters, also showed good correlations among these parameters. These results suggested that LF-NMR was a feasible and convenient method for monitoring moisture content. This demonstrates that LF-NMR and MRI can monitor the drying process of G. elata, and has great potential for application to other Chinese herbal medicines.
Acknowledgments
We thank Simon Partridge, from Liwen Bianji, for editing the English text of a draft of this manuscript.
Author Contributions
Y.C. conducted the experiment and wrote the paper; H.D. and J.L. conducted the experiment; L.G. and X.W. designed and guided the experiment.
Funding
This work was financially supported by Key project at central government level: The ability establishment of sustainable use for valuable Chinese medicine resources (2060302), the National Key Research and Development Program of China (NO. 2017YFC1700703), and the Key Research and Development Program of Shandong Province (NO. 2016GSF202014).
Conflicts of Interest
The authors declare no conflict and interest.
Footnotes
Sample Availability: Samples are available from the authors.
References
- 1.Xu W., Li J., Song F., Li Z., Zhang Z. Research Process of the Drying Technology of Chinese Herbal Medicine. Med. Plant. 2014;5:8–11. [Google Scholar]
- 2.Yan D., Yuan X., Xie D., Hu M., Li M., Liu Y., Wu C. Research status and thoughts on sterilization of Chinese herbal medicine pieces. Tradit. Herb. Drugs. 2016;47:1425–1428. [Google Scholar]
- 3.Segtnan V.H., Sasic S., Isaksson T., Ozaki Y. Studies on the Structure of Water Using Two-Dimensional Near-Infrared Correlation Spectroscopy and Principal Component Analysis. Anal. Chem. 2001;73:3153–3161. doi: 10.1021/ac010102n. [DOI] [PubMed] [Google Scholar]
- 4.Lee D.J. Measurement of Bound Water Content in Sludge: The Use of Differential Scanning Calorimetry (DSC) J. Chem. Technol. Biotechnol. 1995;62:359–365. doi: 10.1002/jctb.280620408. [DOI] [Google Scholar]
- 5.Zhang Q.Q., Li W., Li H.K., Chen X.H., Jiang M., Dong M.S. Low-field nuclear magnetic resonance for online determination of water content during sausage fermentation. J. Food Eng. 2017;212:291–297. doi: 10.1016/j.jfoodeng.2017.05.021. [DOI] [Google Scholar]
- 6.Li T., Tu C., Ru X., Gao Y., Li W., Wang K., Xiao Y., Dong M. Study of Water Dynamics in the Soaking, Steaming, and Solid-State Fermentation of Glutinous Rice by LF-NMR: A Novel Monitoring Approach. J. Agric. Food Chem. 2015;63:3261–3270. doi: 10.1021/acs.jafc.5b00769. [DOI] [PubMed] [Google Scholar]
- 7.Shao X., Li Y. Application of Low-Field NMR to Analyze Water Characteristics and Predict Unfrozen Water in Blanched Sweet Corn. Food Bioprocess Technol. 2013;6:1593–1599. doi: 10.1007/s11947-011-0727-z. [DOI] [Google Scholar]
- 8.Yang S., Liu X., Jin Y., Li X., Chen F., Zhang M., Lin S. Water Dynamics in Egg White Peptide, Asp-His-Thr-Lys-Glu, Powder Monitored by Dynamic Vapor Sorption and LF-NMR. J. Agric. Food Chem. 2016;64:2153–2161. doi: 10.1021/acs.jafc.6b00056. [DOI] [PubMed] [Google Scholar]
- 9.Rao W., Wang Z., Shen Q., Li G., Song X., Zhang D. LF NMR to explore water migration and water protein interaction of lamb meat being air dried at 35 °C. Drying Technol. 2018;36:366–373. doi: 10.1080/07373937.2017.1339084. [DOI] [Google Scholar]
- 10.Sánchez-Alonso I., Moreno P., Careche M. Low field nuclear magnetic resonance (LF-NMR) relaxometry in hake (Merluccius merluccius, L.) muscle after different freezing and storage conditions. Food Chem. 2014;153:250–257. doi: 10.1016/j.foodchem.2013.12.060. [DOI] [PubMed] [Google Scholar]
- 11.Ghosha P.K., Jayasa D.S., Gruwel M.L.H., White N.D.G. A magnetic resonance imaging study of wheat drying kinetics. Biosyst. Eng. 2007;97:189–199. doi: 10.1016/j.biosystemseng.2007.03.002. [DOI] [Google Scholar]
- 12.Geng S., Wang H., Wang X., Ma X., Xiao S., Wanga J., Tan M. A non-invasive NMR and MRI method to analyze the rehydration of dried sea cucumber. Anal. Methods. 2015;7:2413–2419. doi: 10.1039/C4AY03007A. [DOI] [Google Scholar]
- 13.Wu J., Li Y., Gao X. Monitoring a typical fermentation process of natto by low-field nuclear magnetic resonance (LF-NMR) and magnetic resonance imaging (MRI) techniques. Anal. Methods. 2016;8:7134–7140. doi: 10.1039/C6AY00814C. [DOI] [Google Scholar]
- 14.Cheng S., Tang Y., Zhang T., Song Y., Wang X., Wang H., Wang H., Tan M. Approach for monitoring the dynamic states of water in shrimp during drying process with LF-NMR and MRI. Drying Technol. 2018;36:841–848. doi: 10.1080/07373937.2017.1357569. [DOI] [Google Scholar]
- 15.Xu F., Jin X., Zhang L., Chen X.D. Investigation on water status and distribution in broccoli and the effects of drying on water status using NMR and MRI methods. Food Res. Int. 2017;96:191–197. doi: 10.1016/j.foodres.2017.03.041. [DOI] [PubMed] [Google Scholar]
- 16.Matias M., Silvestre S., Falcão A., Alves G. Gastrodia elata and epilepsy: Rationale and therapeutic-potential. Phytomedicine. 2016;26:1511–1526. doi: 10.1016/j.phymed.2016.09.001. [DOI] [PubMed] [Google Scholar]
- 17.Teo C.C., Tan S.N., Yong J.W.H., Hew C.S., Ong E.S. Evaluation of the extraction efficiency of thermally labile bioactive compounds in Gastrodia elata Blume by pressurized hot water extraction and microwave-assisted extraction. J. Chromatogr. A. 2008;1182:34–40. doi: 10.1016/j.chroma.2008.01.011. [DOI] [PubMed] [Google Scholar]
- 18.Chen W.C., Lai Y.S., Lin S.H., Lu K.H., Lin Y.E., Panyod S., Ho C.T., Sheen L.Y. Anti-depressant effects of Gastrodia elata Blume and its compounds gastrodin and 4-hydroxybenzyl alcohol, via the monoaminergic system and neuronal cytoskeletal remodeling. J. Ethnopharmacol. 2016;182:190–199. doi: 10.1016/j.jep.2016.02.001. [DOI] [PubMed] [Google Scholar]
- 19.Wong H.Y., Hu B., So P.K., Chan C.O., Mok D.K.W., Xin G.Z., Li P., Yao Z.P. Rapid authentication of Gastrodiae rhizoma by direct ionization mass spectrometry. Anal. Chim. Acta. 2016;938:90–97. doi: 10.1016/j.aca.2016.07.028. [DOI] [PubMed] [Google Scholar]
- 20.Shan M., Qian Y., Yu S., Zhang L., Ding A. Study on integrative technology of primary processing for Gastrodiae Rhizoma based on response surface methodology. Chin. Tradit. Herb. Drugs. 2016;47:420–424. [Google Scholar]
- 21.Tian Z., Wang J., Liu J., Dai K., Liu X., Yu X., Ma C., Liu D. Effects of Different Processsing Methods and Steamed Time on Quality of Zhaotong Gastrodiae rhizoma. Southwest Chin. J. Agric. Sci. 2016;29:1701–1706. [Google Scholar]
- 22.Raffo A., Gianferri R., Barbieri R., Brosio E. Ripening of banana fruit monitored by water relaxation and diffusion 1H-NMR measurements. Food Chem. 2005;89:149–158. doi: 10.1016/j.foodchem.2004.02.024. [DOI] [Google Scholar]
- 23.Chen L., Tian Y., Sun B., Wang J., Tong Q., Jin Z. Rapid, accurate, and simultaneous measurement of water and oil contents in the fried starchy system using low-field NMR. Food Chem. 2017;233:525–529. doi: 10.1016/j.foodchem.2017.04.147. [DOI] [PubMed] [Google Scholar]
- 24.Wang H.H., Wang R.Y., Song Y.K., Kamal T., Lv Y., Zhu B.W., Tao X.H., Tan M.Q. A fast and non-destructive LF-NMR and MRI method to discriminate adulterated shrimp. J. Food Meas. Charact. 2018;12:1340–1349. doi: 10.1007/s11694-018-9748-x. [DOI] [Google Scholar]
- 25.Tan M., Lin Z., Zu Y., Zhu B., Cheng S. Effect of multiple freeze-thaw cycles on the quality of instant sea cucumber: Emphatically on water status of by LF-NMR and MRI. Food Res. Int. 2018;109:65–71. doi: 10.1016/j.foodres.2018.04.029. [DOI] [PubMed] [Google Scholar]
- 26.Wei S., Tian B.Q., Jia H.F., Zhang H.Y., He F., Song Z. Investigation on water distribution and state in tobacco leaves with stalks during curing by LFNMR and MRI. Drying Technol. 2018;4:1–8. doi: 10.1080/07373937.2018.1445639. [DOI] [Google Scholar]
- 27.Mothibe K.J., Zhang M., Mujumdar A.S., Wang Y.C., Cheng X.F. Effects of Ultrasound and Microwave Pretreatments of Apple Before Spouted Bed Drying on Rate of Dehydration and Physical Properties. Drying Technol. 2014;32:1848–1856. doi: 10.1080/07373937.2014.952381. [DOI] [Google Scholar]
- 28.Li M., Wang H., Zhao G., Qiao M., Li M., Sun L., Gao X., Zhang J. Determining the drying degree and quality of chicken jerky by LF-NMR. J. Food Eng. 2014;139:43–49. doi: 10.1016/j.jfoodeng.2014.04.015. [DOI] [Google Scholar]
- 29.Adiletta G., Iannone G., Russo P., Patimo G., Pasquale S.D., Matteo M.D. Moisture migration by magnetic resonance imaging during eggplant drying: A preliminary study. Int. J. Food Sci. Technol. 2014;49:2602–2609. doi: 10.1111/ijfs.12591. [DOI] [Google Scholar]
- 30.Michalska A., Honke J., Łysiak G., Andlauer W. Effect of drying parameters on the formation of early and intermediate stage products of the Maillard reaction in different plum (Prunus domestica L.) cultivars. LWT Food Sci. Technol. 2016;65:932–938. doi: 10.1016/j.lwt.2015.09.015. [DOI] [Google Scholar]
- 31.Li L., Zhang M., Bhandari B., Zhou L. LF-NMR online detection of water dynamics in apple cubes during microwave vacuum drying. Drying Technol. 2018:1–10. doi: 10.1080/07373937.2018.1432643. [DOI] [Google Scholar]
- 32.Zheng H., Lu H. Use of kinetic, Weibull and PLSR models to predict the retention of ascorbic acid, total phenols and antioxidant activity during storage of pasteurized pineapple juice. LWT Food Sci. Technol. 2011;44:1273–1281. doi: 10.1016/j.lwt.2010.12.023. [DOI] [Google Scholar]


