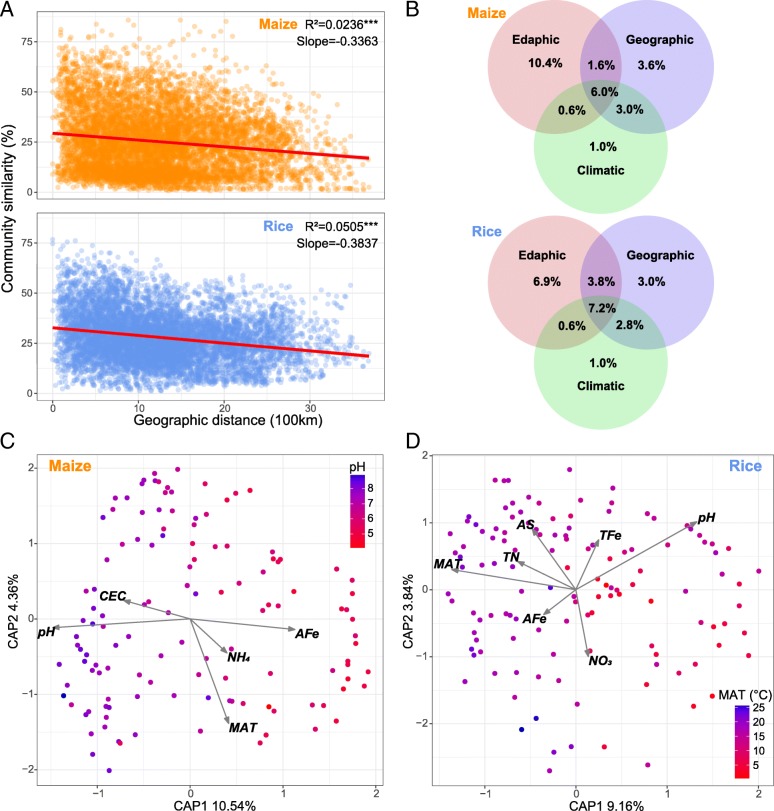
Fig. 2.
Drivers of archaeal β-diversity in maize and rice soil samples. a Distance–decay curves of similarity for soil archaeal communities. Red lines denote the ordinary least squares linear regression. Asterisks represent significance of correlation (***, p < 0.0001). b Variation partitioning analysis of the relative contributions of edaphic, geographic, and climatic variables to variation in soil archaeal β-diversity. c and d Constrained analysis of principal coordinates (CAP) showing edaphic and climatic factors that influenced archaeal assembly. Sample points are colored according to soil pH (left panel) and mean annual temperature (MAT; right panel). The color bar from red to blue represents values from small to large. CEC, cation exchange capacity; NH4, ammonium-nitrogen; NO3, nitrate-nitrogen; TN, total nitrogen; AFe, available iron; TFe, total iron; and AS, available sulfur

