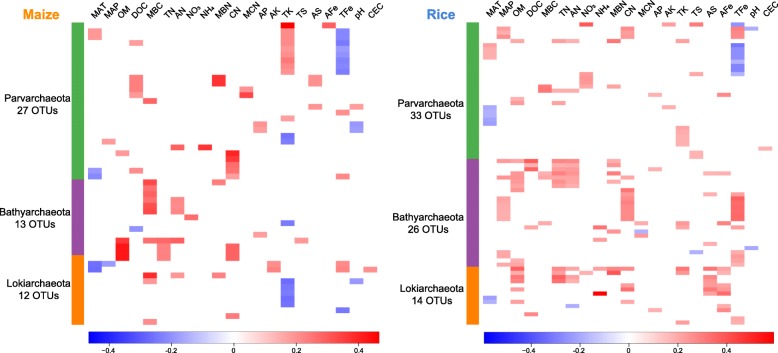
Fig. 5.
Spearman correlations between rare phyla and edaphic factors in maize and rice soils, displayed as heatmaps. Scale bars indicate correlation coefficients. Only significant correlations (p < 0.05) are shown. MAT, mean annual temperature; MAP, mean annual precipitation; OM, organic matter; DOC, dissolved organic carbon; MBC, microbial biomass carbon; TN, total nitrogen; AN, available nitrogen; NO3, nitrate-nitrogen; NH4, ammonium-nitrogen; MBN, microbial biomass nitrogen; CN, C:N ratio; MCN, microbial C:N ratio; AP, available phosphorus; AK, available potassium; TK, total potassium; TS, total sulfur; AS, available sulfur; AFe, available iron; TFe, total iron; and CEC, cation exchange capacity

