

SUMMARY
Upon stress, cytoplasmic mRNA is sequestered to insoluble ribonucleoprotein (RNP) granules such as the stress granule (SG). Partially due to the belief that translationally suppressed mRNAs are recruited to SGs in bulk, stress-induced dynamic redistribution of mRNA has not been thoroughly characterized. Here we report that endoplasmic reticulum (ER) stress targets only a small subset of translationally suppressed mRNAs into the insoluble RNP granule fraction (RG). This subset, characterized by extended length and AU-rich motifs, is highly enriched with genes critical for cell survival and proliferation. This pattern of RG targeting was conserved for two other stress types, heat shock and arsenite toxicity, which induce distinct responses in the total cytoplasmic transcriptome. Nevertheless, stress-specific RG-targeting motifs, such as GC-rich motifs in heat shock, were also identified. Previously underappreciated, transcriptome profiling in the RG may contribute to understanding human diseases associated with RNP dysfunction, such as cancer and neurodegeneration.
INTRODUCTION
Regulation of the mRNA transcriptome is a fundamental mechanism of gene regulation, occurring at several stages of the RNA life cycle: transcription, splicing, nuclear export, translation, and decay. These stages of mRNA metabolism take place in distinct subcellular compartments. Transcription occurs in the nucleus and regulates mRNA synthesis, but mature mRNA can also be redistributed in the cytoplasm for decay or storage under cellular stress. During these processes, RNA-protein (RNP) granules play important roles in RNA expression and metabolism.
There are two major types of RNP granules in the cytoplasm: processing (P-) bodies and stress granules (SGs) (Decker and Parker, 2012). P-bodies are present in normal conditions and specifically partake in mRNA decay. Under conditions of cell stress, SGs are more prominent, but their function is less well-defined. P-bodies and SGs exhibit some overlap with each other in terms of function and structural components. However, SGs contain mRNA-associated RNPs (mRNPs) stalled at translation initiation, and its proteomic substructures are dynamically modulated (Jain et al., 2016). This implies that translation of these mRNAs might be resumed through mRNP disassembly after stress recovery.
While the protein components of mRNP granules were recently characterized (Decker and Parker, 2012; Jain et al., 2016), the mRNA components have not been extensively explored. Although RNP granules have been reconstituted ex vivo to analyze associated transcripts (Han et al., 2012), isolating intact RNA-containing granules from live mammalian cells remained a major challenge due to their complicated and labile nature. In addition, cytoplasmic RNA sequestration was thought to be the simple consequence of global translation suppression upon stress (Decker and Parker, 2012); therefore, the study of particular transcripts has not been emphasized. Correspondingly, housekeeping transcripts such as beta-actin mRNA have been used as a standard for tracking the fate of mRNA in P-bodies and SGs. Nevertheless, the existence of sequence-specific RNA binding proteins, such as TIA-1, TIAR (Dember et al., 1996; Wang et al., 2010), FUS (Kapeli et al., 2016) and Pumilio (White et al., 2001) in SGs (Wolozin, 2012), suggests that SGs may recruit a specific family of transcripts having specific sequences upon stress. However, the identity of SG-targeted transcripts has been unclear, and the function of RNP granules targeting transcripts upon stress is unknown.
To address these questions, we developed a technique to characterize all mRNA species sequestered in the insoluble RNP granules of mammalian cells. By characterizing the insoluble RNP transcriptome in response to ER stress, heat shock and arsenite toxicity, we provide a transcriptome-level snapshot of how different stresses dynamically redistribute individual mRNA species between the soluble cytoplasm and insoluble RNP granules.
RESULTS
Preparation of the Insoluble RNP Granule Fraction (RG)
Differential centrifugation of cytoplasmic homogenates was formerly used to isolate insoluble RNP granules, such as P-bodies (Teixeira et al., 2005) and SGs (Jain et al., 2016). We modified these procedures by simplifying the centrifugation step to maximize preservation of the RNP granules (Figure 1A). By expressing a fluorescent SG marker RFP-G3BP (Liu-Yesucevitz et al., 2014) in HEK293 cells, we tested if this procedure could isolate SGs in its intact structure. In unstressed cells, RFP-G3BP was dispersed as numerous tiny dots, while thapsigargin (Tg)-induced ER stress provoked RFP-G3BP aggregation into large SG (Figure 1B, upper panel). Cycloheximide (CHX) abolished the Tg-induced SG formation (Figure 1B, upper panel), as formerly reported (Kedersha and Anderson, 2007). Smear preparation of the isolated RNP granule fraction (RG) revealed intact G3BP structures (Figure 1B, lower panel) whose sizes are comparable to what was observed for SGs in situ (Figure 1B, upper panel). However, tiny punctuated structures of RFP-G3BP was still detectable in the RG isolated from control or Tg/CHX-co-treated cells, which do not exhibit large SGs (Figure 1B, lower panel insets).
Figure 1. Preparation and validation of the insoluble RNP Granule fraction (RG).

(A) Schematics of RG preparation. Sup, supernatant; Nuc, nuclear fraction; Cyt, total cytoplasmic fraction; Sol, soluble cytoplasmic fraction.
(B) HEK293 cells expressing RFP-G3BP were treated with DMSO (Con), thapsigargin (Tg, 1 μM) or Tg+cycloheximide (CHX, 2 μg/ml) for 1.5 hrs. Fluorescence imaging of whole cells (upper panel) and the RG (lower panel) revealed intact stress granules (SGs). Boxed areas are magnified in insets. Bars, 10 μm.
(C-E) NIH3T3 cells were treated with DMSO, Tg, and Tg+CHX for 1.5 hrs and subjected to RG preparation. (C, D) Protein preparations were analyzed by immunoblotting. (E) Relative accumulation of indicated proteins in the RG was quantified and normalized by the Cyt level (mean±SEM; n=3; *, p<0.05; **, p<0.01; NS, non-significant in Student’s t-test).
See also Figure S1.
Using this procedure, we isolated RNP granules from control and Tg-treated mouse fibroblasts (NIH3T3 cells), which are non-transformed therefore could be more appropriate for examining physiological stress responses. Interestingly, known SG markers (Decker and Parker, 2012; Kedersha and Anderson, 2007), such as TIA-1, TIAR, eIF4E, YB1 and G3BP, were abundantly found in the RG (Figures 1C, 1D, S1A and S1B). P-body-specific markers (DCP1a, EDC4 and 4E-T) and ribosomal subunits (L4 and S3) were also detected in the RG, although their enrichment levels were highly variable between the markers (Figure 1D). However, markers for other subcellular components, such as the nucleoskeleton, endoplasmic reticulum (ER), and cytoskeleton (Lamin A, BiP, and Tubulin, respectively) were depleted in the RG (Figure 1C). In addition, more extensive analysis with three additional ER markers (SERCA2, PDI and Ero1-L) confirmed that the ER-derived microsomes are undetectable in the RG (Figure 1D). Interestingly, some of the nuclear proteins that are known to associate with SGs, such as HDAC1 and Pol II (Jain et al., 2016; Mahboubi et al., 2013), were found in both RG (Figure S1B) and SGs in situ (Figure S1C). These results show the specificity of RG preparation, consistent with the previous reports (Jain et al., 2016; Teixeira et al., 2005).
ER Stress Specifically Increases the Level of SG Markers in the RG
The levels of SG markers in the RG were prominently increased after Tg treatment (Figures 1C-1E and S1B), consistent with strong SG induction (Figures 1B and S1A). Cycloheximide (CHX), an inhibitor of SG formation (Figures 1B, S1D and S1E), prevented RG accumulation of SG markers in ER stress (Figures 1D and 1E), indicating that the ER stress-induced enrichment of SG markers in RG is indeed driven by the SG formation.
In contrast, P-bodies were not further induced by Tg treatment (Figure S1D), and P-body-specific markers were not further enriched in the RG after Tg treatment (Figures 1D and 1E). Interestingly, levels of ribosomal proteins in the RG decreased after stress treatment (Figures 1D and 1E), and in immunostaining, ribosomal proteins did not show strong co-localization with an SG marker TIA-1 after ER stress (Figure S1E).
Therefore, we found that SGs are prominently enriched in the RG after ER stress, but other RNP granules such as P-bodies and ribosome-associated RNPs are either unchanged or depleted from the RG.
Only a Small Subset of Transcripts Is Targeted to the RG upon ER Stress
RNA extraction from the RG revealed a substantial presence of RNA, around 13% of total cytoplasmic RNA (Cyt) in normal cells, based on UV spectrometry. This suggested that, through modern RNA-seq technology, the RG transcriptome could be successfully characterized. For this analysis, we developed a technique to specifically evaluate the effect of stresses on transcriptomic responses in the RG.
First, to precisely calculate the absolute amount of each transcript in the total cytoplasmic fraction (Cyt, including both soluble and RG fractions) and in the RG, we utilized the spike-in normalization technique (Figure 2A). Using the spike-in information, we calculated %RG, the absolute percent fraction of mRNA in the RG to the Cyt for each transcript species (Figure 2A). For this calculation, if %RG=100, then all transcripts are found in the insoluble RG; if %RG=0, then no mRNA is found in the RG, and therefore all are found in the soluble cytoplasm.
Figure 2. ER stress induces accumulation of specific mRNA species in the RG.

(A) Schematic overview of the RG RNA-seq method.
(B) RG RNA-seq was performed in a pair of control and stress conditions to calculate ΔCyt and ΔRG values.
(C) Transcriptome distribution of ΔCyt and ΔRG values from ER stress induction (1 μM Tg, 1.5hrs) in NIH3T3 cells.
(D-F) NIH3T3 cells were treated with DMSO (Con), Tg, Tg+CHX, Tg+emetine (EMT, 10 μg/ml), Tg+puromycin (PUR, 10 μg/ml) for 1.5 hrs. (D, E) Fractions of mRNA in RG over Cyt were quantified by qRT-PCR (mean±SEM; n≥3). *, p<0.05; **, p<0.01; ***, p<0.001; NS, non-significant in Student’s t-test. (F) Cells were stained with TIA-1 antibody. Bars, 10 μm.
See also Figure S2.
We performed the Cyt/RG RNA-Seq in control and Tg-treated cells (Figure 2B). The median %RG was 10–15% in untreated cells (Figure S2A), suggesting that a significant fraction of transcripts resides in the insoluble RNP granules under physiological conditions. Tg-induced ER stress decreased the median %RG to 5–10% (Figure S2A) without affecting the spike-in normalized total cytoplasmic mRNA level (Figure S2B). These results are consistent with the values obtained through UV spectrometry (Figures S2C and S2D), and indicate that, despite prominent SG formation during ER stress, actual RNA content in the RG was reduced.
To identify transcripts that are specifically targeted to the RG upon stresses, we formulated a parameter named ΔRG-ER, the change in %RG upon ER stress treatment (Figure 2B). The ΔRG-ER values for individual transcripts were consistent across three independent biological replicates (Figure S2E), demonstrating the high reproducibility of the RG RNA-Seq experiments. Since a larger fraction of the transcripts had negative ΔRG-ER values (Figures S2F and S2G), transcripts with positive ΔRG-ER values (23.7% of all transcripts) are expected to specifically represent the transcripts targeted to SGs. The transcripts with strong positive ΔRG-ER values (>1) include transcripts of genes that regulate cell growth and survival such as Xiap, Ago3, Creb1, Rictor and Brca1, as well as a small number of non-coding RNAs such as Norad (Figure 2C). The fold change of cytoplasmic mRNA (ΔCyt-ER) for these six genes were slightly negative (<0; Figure 2C), indicating RG targeting of these transcripts was specifically driven without an increase in abundance in cytoplasm. We focus our analyses on these six genes due to their high specificity in RG-targeting, identified through high ΔRG-ER values with no increases in ΔCyt-ER.
Indeed, DESeq2 analysis, which was independently conducted without utilizing the spike-in information, also indicated that these six transcripts specifically accumulate in the RG after ER stress while not being elevated in the total cytoplasm (Figure S3A and Table S1). Coverage depth graphs of genomic loci corresponding to these genes also showed that these mRNAs are specifically upregulated in the RG after stress, while neighboring genes, which have low to moderate ΔRG-ER values (between −1.5 and 0.14), do not show such regulation (Figures S3B-S3G). Interestingly, some of these ΔRG-ER-high transcripts, such as Xiap, Creb1 and Rictor are relatively scarce in the RG under normal conditions, while they show very strong stress-inducible RG targeting. These genes may represent the transcripts that are typically solubilized in the cytoplasm under normal, unstressed conditions but migrate to the RG under conditions of stress. Therefore, compared to the genes that are constitutively recruited to the RG, these stress-regulated genes are likely to have more biological importance for stress responses.
In contrast to these transcripts, beta-actin (Actb) and Gapdh transcripts, which encode representative housekeeping proteins, exhibited strong negative ΔRG-ER values (<−1; Figure 2C) and do not show RG enrichment after stress (Figures S3H and S3I). These findings, derived from the three RG RNA-seq replicates (Figure S2E), were also confirmed through independent spike-in-controlled quantitative RT-PCR analysis (qRT-PCR; Figures 2D, 2E and S3J). These results indicate that, even though ER stress induces SG formation, specificity exists in transcript targeting to the SG-containing RG.
The SG is Responsible for ER Stress-Induced RG Targeting.
Based on the ER stress-induced formation of SGs (Figures 1B, 2F and S1A) and enrichment of SG markers in the RG of stressed cells (Figures 1C-1E), the transcripts accumulating in the RG upon stresses may represent mRNA species specifically targeted to SGs. To further assess the validity of this, we treated the cells with known inhibitors of SG formation, such as CHX and emetine (EMT) (Kedersha and Anderson, 2007). CHX and EMT almost completely inhibited ER stress-induced SG formation (Figure 2F), as well as accumulation of Xiap, Ago3, Creb1, Rictor, Brca1 and Norad in the RG (Figure 2D). In contrast, puromycin (PUR), a translation inhibitor that does not disrupt SG formation (Figure 2F) (Kedersha and Anderson, 2007), had no effect on RG accumulation of these genes (Figure 2D). Other transcripts with high ΔRG-ER values also exhibited similar RG accumulation behavior (Figure S3J). In contrast, transcripts with low ΔRG-ER values, such as Actb and Gapdh transcripts, did not specifically accumulate in the RG in any of these conditions (Figures 2E and S3J). These results suggest that the stress-induced enrichment of transcripts in the RG represents SG targeting.
To further validate this in cells using an independent strategy, we performed single molecule RNA in situ hybridization to determine the subcellular localizations of the representative mRNAs. In agreement with our RNA-Seq and qRT-PCR results, Xiap, Ago3, Brca1 and Norad exhibited strong co-localization with the SG marker TIA-1 after ER stress (Figures 3A-3D, middle panels). In addition, the co-localization was not prominent in untreated cells or ER-stressed cells whose SG formation was blocked by CHX treatment (Figures 3A-3D, upper and lower panels). Furthermore, Actb and Gapdh transcripts, which do not specifically accumulate in the RG (Figures 2E, S3H and S3I), only partially overlapped with TIA-1, even in ER-stressed cells (Figures 3E and 3F). Quantification of these imaging results further confirm these observations (Figure 3G) and demonstrates that RNA-Seq of the RG can be used to identify transcripts that are specifically targeted to the SG upon stresses.
Figure 3. Stress-induced transcript accumulation in the RG signifies SG targeting.
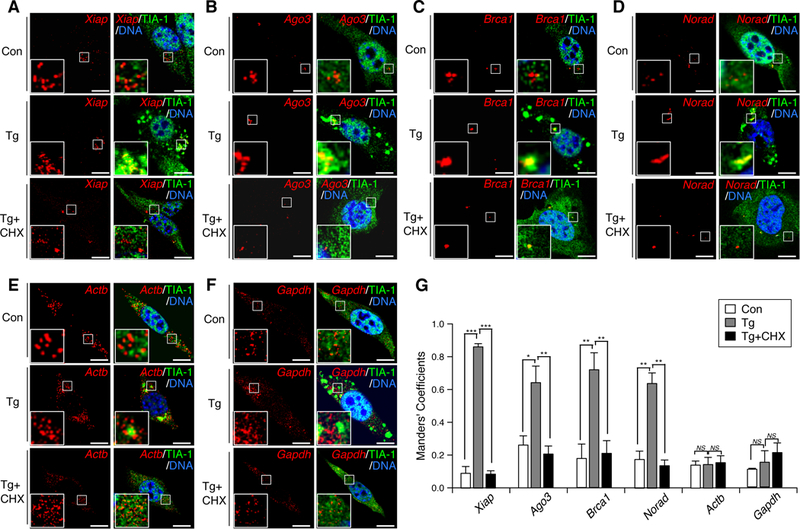
(A-G) NIH3T3 cells were treated with DMSO (Con), Tg or Tg+CHX for 1.5 hrs. Indicated mRNA species (red; A-F) were visualized through single molecule in situ hybridization. Xiap (A), Ago3 (B), Brca1 (C) and Norad (D), but not Actb (E) and Gapdh (F), are transcripts showing stress-induced RG accumulation. Boxed areas are magnified in insets. Bars, 10 μm. Co-localization between transcripts (red) and TIA-1 (green) was quantified using Manders’ coefficients and presented as a bar graph (G; mean±SEM; n=3) *, p<0.05; **p<0.01; ***, p<0.001; NS, non-significant in Student’s t-test.
We were curious to know if this pattern of RNA dynamics can be similarly observed in human cells. Using the same procedure for RG isolation (Figure 1A) and subsequent spike-in controlled qRT-PCR analyses, we found that human homologues of Xiap, Ago3, Creb1 and Brca1, but not Actb and Gapdh, were strongly accumulated in the RG after ER stress (Figure S3K) in HEK293 cells. MS2-tagged 3’UTR sequences of Xiap, Ago3 and Brca1 mRNAs were also recruited to the SG upon ER stress (Figure S3L). These results suggest that SG targeting of these transcripts is also conserved in human-derived HEK293 cells.
Translational Suppression is Not the Sole Determinant of ER Stress-induced RG Targeting
To discover the mRNA features that direct stress-induced RG targeting, we grouped mRNA by comparing their relative expression in the RG upon ER stress. Six clusters of mRNA transcripts were identified using k-means clustering (Figure 4A and Table S2), based on three RG RNA-Seq-derived parameters: %RG in untreated cells, fold change of cytoplasmic mRNA (ΔCyt-ER), and fold change of %RG (ΔRG-ER) (Figures 3A and 3B). Among the groups ordered by average ΔRG-ER, cluster 4 exhibited the highest ΔCyt-ER values and corresponds to the ER stress-inducible genes (Han et al., 2013) (Figures 4A, S4A and S4B). In contrast, cluster 1 is the only cluster whose median ΔRG-ER value is positive (Figure 4B), and therefore represents the transcripts that are RG-targeted upon ER stress. All cluster 1 transcripts have positive ΔRG-ER values, and all transcripts whose ΔRG-ER value is above 1.00 are present in cluster 1 (Figure 4C). Cluster 1 also substantially overlaps with the transcript group identified by the DESeq2 analysis, which were enriched in the RG after stresses (Figure 4C; Tables S1 and S2). Notably, cluster 1 has all six representative transcripts, Xiap, Ago3, Creb1, Rictor, Brca1 and Norad (Figure 4C), which we extensively analyzed.
Figure 4. ER stress targets only a small subset of translationally repressed mRNA species into the RG.

(A) Transcript clusters were generated using k-means algorithm (n=6) using %RG, ΔCyt-ER and ΔRG-ER.
(B) Box plot of ΔRG-ER in the 6 clusters defined in panel A.
(C) The area-proportional Venn diagram shows the relationship between simple ΔRG cutoff (circles with black outline), ΔRG cluster 1 (purple) and DESeq2 analyses (blue and green). The six representative transcripts used in this study (red) all exhibited ER stress-induced RG targeting in these different analyses. ΔRG analyses were conducted from transcripts whose raw read count values exceeded 50 in all experimental conditions (grey).
(D) Box plot of overall translation efficiency (TE), obtained from the Ribo-seq analysis of DMSO (Con) or Tg-treated NIH3T3 cells.
(E) Box plot of TE fold change during Tg treatment (ΔTE-ER) in the 6 clusters.
(F) ΔTE-ER values of indicated gene transcripts were presented in a bar graph (mean±SEM; n=2).
(G) Depletion of lncRNA in ER cluster 1. Bar graphs represent the distribution of all genes (white bars) or lncRNA (black bars) in the 6 clusters. The p-value is from Fisher’s exact test.
One of the known driving forces for SG formation and RNA sequestration is the stalling of translation during the initiation stage (Decker and Parker, 2012). To examine the relationship between protein translation and stress-induced RG targeting, we performed ribosomal profiling (Ribo-Seq) (Ingolia et al., 2009) on the same set of control and Tg-treated cells. The Ribo-Seq produced results consistent with our current knowledge of the ER stress response, such as translation of alternatively spliced Xbp1 mRNA (Figure S4C) and full-length Atf4 mRNA (Figure S4D). Also consistent with observations that ER stress universally reduces protein translation (Baird and Wek, 2012), translation efficiency (TE, percent fraction of Ribo-seq counts over total cytoplasmic RNA counts (Ingolia et al., 2009)) was strongly reduced after Tg treatment for most of the transcripts (Figure 4D). Overall, more than 99% of mRNA transcripts exhibited strong negative ΔTE-ER values (Figure S4E), indicating the universal suppression of protein translation. However, considering that only ~20% of mRNA transcripts exhibited positive ΔRG-ER values (Figure 4C), these results suggest that only a small subset of translationally repressed mRNA transcripts is recruited to the RG during stress.
We examined whether transcripts targeted to the RG upon ER stress undergo even stronger translational suppression. Cluster 1, the cluster of transcripts exhibiting stress-induced RG targeting, actually exhibited a ΔTE-ER value that is comparable to other clusters (Figure 4E). This result suggests that strong translational suppression does not guarantee stress-induced RG targeting of the transcript. Supporting this idea, TE of Actb, which did not show stress-inducible RG targeting or SG accumulation (Figures 2E, 3E and 3G), was sharply declined after ER stress (Figure 4F), and the reduction is even stronger than cluster 1 mRNA species such as Xiap, Ago3, Creb1, and Brca1 (Figure 4F). These results also imply that stress-induced RG targeting is not the major mechanism for translational arrest during ER stress.
RG RNA-Seq and total RNA-Seq also identified transcripts corresponding to long non-coding RNAs (lncRNAs). Consistent with their minimal involvement in ribosomal binding and translation, lncRNAs exhibited lower TE, when compared to the mRNA with coding sequences (Figure S4F). Although a small number of lncRNAs, such as Norad, were found to be targeted to the RG during stresses, the frequency of lncRNAs in cluster 1, the cluster exhibiting stress-induced RG targeting, was very low (Figure 4G), suggesting that translational regulation may still play some role in ER stress-induced RG targeting.
Longer mRNAs Are Preferentially Targeted to the RG upon ER Stress
We analyzed individual transcripts in cluster 1 to explore if there were features of mRNA that drive ER stress-induced RG targeting (Figures S5A-S5K). Among the various features, the one most prominently correlated with cluster 1 was transcript length (Figure S5A). When we compared the median mRNA length of the two clusters with the highest and lowest ΔRG-ER values (1 and 6, respectively), cluster 1 was 2.5-fold longer than cluster 6 (Figure S5A), and mRNA lengths exhibited a positive correlation with ΔRG-ER values (Figure 5A). This suggests that longer mRNA is preferentially recruited to the RG upon ER stress.
Figure 5. Length and AU-rich elements drive ER stress-induced RG targeting.
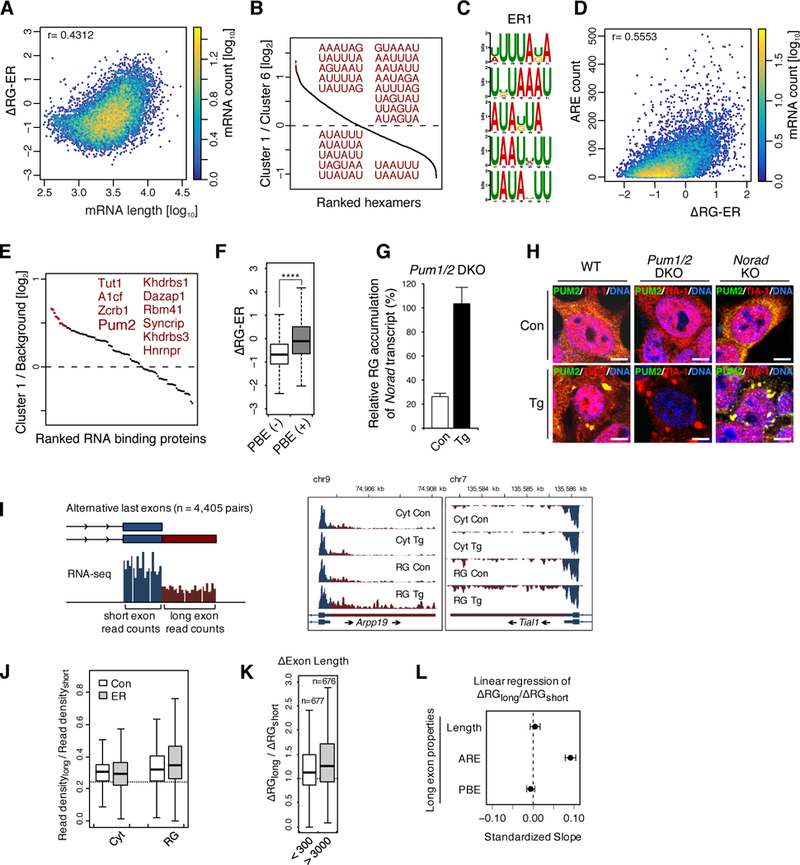
(A) Scatterplot depicting the correlation between mRNA length and ΔRG-ER
(B) Ratio of hexamer frequency between ER cluster 1 and 6. The top 20 sequence motifs are highlighted in red.
(C) Top 5 RNA motifs enriched in ER cluster 1, identified by DREME.
(D) Scatterplot depicting the correlation between the number of AU rich elements (AREs; defined by the top 30 DREME motifs in Figure S5M) and ΔRG-ER.
(E) Relative enrichments of CISBP-registered RBP motifs in ER cluster 1 over the background control are presented in a dot plot. The top 10 RBP motifs are highlighted in red.
(F) Box plot of ΔRG-ER in transcripts with (+) or without (−) Pumilio-binding elements (PBEs). ****p<2.2×10⁻¹⁶ in Student’s t-test.
(G, H) Pumilio and Norad are not required for recruitment of the other into the RG or SGs. (G) Norad is targeted to the RG in Pum1/2-double knockout HCT116 cells (mean±SEM; n=2). (H) Pum2 (green) co-localizes with TIA-1-positive SGs (red) after Tg treatment in WT and Norad-knockout HCT116 cells. Bars, 5 μm.
(I) Schematics for alternative last exon analysis (left panel). The coverage depth graphs of two representative isoform pairs (Arpp19 and Tial1) in RG RNA-seq were presented (right panel). Short exon counts (blue) correspond to the sequence common to both isoforms. Long exon counts (red) correspond to the sequence specific for the longer isoform.
(J) Box plot of the read density ratios between the long and short exon sequences.
(K) Box plot of the ΔRG ratio between the long and short exon sequences in transcript pairs whose length difference (ΔExon length) is smaller than 300 or larger than 3000.
(L) Multivariate linear regression analysis of the ΔRG ratio dependent on the lengths, ARE (AUUUA) counts and PBE (UGUANAUA) counts of the long exon. Standardized scores of the variants were used to assess the relative contribution of each variant to the ΔRG ratio between long and short isoforms.
See also Figure S5.
The association between mRNA length and stress-induced RG targeting could be a consequence of the physical property of RNA itself (Han et al., 2012; Jain and Vale, 2017). For instance, longer RNAs may form larger RNP complexes that can be more easily targeted to the RG. In addition, longer RNAs have higher chances of having a stable secondary structure, which may promote granulation and sedimentation processes (Han et al., 2012; Jain and Vale, 2017). However, the correlation between mRNA folding energy and stress-induced RG targeting was, although detectable, weaker (r=0.37; Figures S5L) than the correlation between mRNA length and stress-induced RG targeting (r=0.43; Figures 5A). Furthermore, GC% and frequencies of G-rich sequence motifs, which can promote structuring of mRNA, actually had a slightly negative correlation with stress-induced RG targeting (Figures S5G and S5I). The results from these analyses suggest that stress-induced RG targeting can involve mechanisms that are not simply dependent on stabilizing RNA structure.
AU-Rich Elements (AREs) Predict ER Stress-induced RG Targeting
It is also possible that longer mRNA has a higher probability of having critical sequence motifs for RNA binding proteins (RBP) that target transcripts to the RG upon stress. To identify these motifs, we first used two unbiased motif identification methods: ranked hexamer analysis (Figure 5B) and de novo motif discovery algorithm (DREME; Figures 5C and S5M) (Bailey, 2011). Both approaches congruently identified AU-rich elements (AREs) as the most distinctive motifs enriched in cluster 1 (Figures 5B, 5C and S5M). The top 30 DREME ARE motifs (Figure S5M) showed a positive correlation with ΔRG-ER values (Figure 5D), which is even stronger than the mRNA length effect (Figure 5A). Indeed, the correlation between the ARE motifs and ΔRG-ER was detectable even after ruling out the effect of physical length (Figure S5N). This is consistent with the association between SGs and ARE-binding proteins, such as TIA-1 and TIAR (Figure 1C and S1A) (Decker and Parker, 2012; Kedersha and Anderson, 2007), and their critical role in SG formation (Gilks et al., 2004).
ER Stress-induced RG Targeting of Pumilio and Norad Is Not Dependent on Each Other
We also asked if known RNA binding protein (RBP) motifs in an RBP database (CISBP-RNA) (Ray et al., 2013) were enriched in cluster 1 (Figure 5E). The consensus site for a Pumilio protein (Pum2), a known SG component that can promote ex vivo aggregation of mRNA-protein complexes (Han et al., 2012), was among the RBP motifs most frequently found in cluster 1 (Figures 5E and S5O). mRNA transcripts with the Pumilio-binding element (PBE) are highly enriched in cluster 1 (Figure S5P) and exhibit greater ΔRG-ER even after normalization of the transcript length effect (Figure 5F and S5Q). These results implicate Pumilio proteins in stress-induced RG transcript targeting.
One of the most prominent Pumilio target proteins is Norad (Lee et al., 2016), which is among the small number of exceptional lncRNA transcripts that show strong stress-induced RG targeting (Figures 2D and3D). However, Norad transcripts were still prominently accumulated in the RG after Tg treatment in a Pum1/2 double knockout cell line (Figure 5G) (Lee et al., 2016), indicating that Pumilio proteins are not required for stress-induced RG targeting of Norad. Because the Norad transcript has AREs in addition to PBEs, it is possible that SG-recruited ARE-binding proteins, such as TIA-1 or TIAR, are more essential for recruiting Norad to the RG during stresses. Conversely, knocking out Norad also did not affect SG localization of Pumilio proteins (Figure 5H), indicating that Pumilio and Norad are dispensable for recruitment of the other to the RG in response to stresses.
Transcript Length and AREs Drive ER Stress-Induced RG Targeting
We also utilized an independent approach to evaluate the effect of length on stress-induced RG targeting; we analyzed endogenous transcripts with isoform pairs of varying lengths. In order to specifically evaluate the impact of 3’ transcript lengthening, we identified transcripts that have alternative termination sites in the last exon. With this approach, we identified 4,405 pairs of transcripts (Figure 5I, left panel) and compared read counts of shorter and longer isoforms to determine if longer transcripts were more prevalent in the RG. As representative examples from this analysis, we focused on Arpp19 and Tial1, whose isoforms have substantial differences in length (2–4 kb). Generally, these transcripts do not exhibit ER stress-induced RG targeting, so they were originally grouped into clusters 3 and 2, respectively. However, intriguingly, the region specific to their longer isoform exhibited highly pronounced ER stress-induced RG targeting (Figure 5I, right panel), indicating that the 3’ transcript lengthening was indeed sufficient to drive RG targeting. We found the same pattern of length-dependent RG targeting across all 4,405 transcript pairs (Figure 5J). Furthermore, ER stress-induced RG targeting (ΔRG-ER) was more pronounced in the transcript pairs with greater length differences (Figure 5K).
Next, to compare the effects of different transcript characteristics on RG targeting, we performed a multivariate linear regression of RG enrichment of long exons (ΔRGlong/ΔRGshort) to the three different transcript characteristics that we identified to promote RG targeting: length, AREs and PBEs. Interestingly, the transcript length and number of PBEs did not produce significant proportional impact on ΔRG-ER; however, the presence of additional AREs produced a stronger effect and increased the levels of ΔRG-ER in a proportional manner, suggesting that AREs may be the most critical for driving ER stress-induced RG targeting (Figure 5L). Consistent with our analysis on the total transcriptome (Figures 5D and S5N), these results also indicate that AREs, independently of transcript length and PBEs, are a major driving factor for stress-induced RG targeting of specific transcripts.
Different Stresses Target a Similar Group of Transcripts into the RG
In addition to ER stress, heat-shock (HS) and arsenite stress (AS) are widely used to induce SG formation (Kedersha and Anderson, 2007). We analyzed the transcriptome under HS and AS conditions, using the same RG RNA-Seq approach. Compared to ER stress, the median %RG was increased in both HS and AS treatments (Figure S6A), indicating that RNA recruitment to SGs is stronger in HS and AS conditions. In addition, stress-induced changes in the total cytoplasmic mRNA level (ΔCyt) did not show any positive correlations between ER versus HS and ER versus AS experiments (Figures 6A and S6B-S6D), indicating that different stresses shape the total cytosolic transcriptome differently. The difference is most likely through stress-specific transcriptional regulation mechanisms (de Nadal et al., 2011).
Figure 6. Conservation of RG targeting across different stress types.

(A, B) 3D scatterplot depicting the correlation between ΔCyt (A) or ΔRG (B) values after three different stresses: ER (1 μM Tg, 1.5 hrs), HS (43 °C heat shock, 45 min) and AS (0.5 mM sodium arsenite; 1 hr). Correlation coefficients (r) between experiments are provided in the tables.
(C, D) Box plots of ΔRG values in four gene groups (quartiles) sorted by mRNA lengths (C) and ARE (defined by Figure S5M) numbers (D). Shortest/Smallest, 0–25th percentile (%); Shorter/Smaller, 25–50%; Longer/Larger, 50–75%; Longest/Largest, 75–100%. ****p<2.2×10⁻¹⁶ in Student’s t-test.
(E) Distribution of proto-oncogenes to the quartiles of the genes sorted by ΔRG in each stress condition. Lowest, 0–25%; Lower, 25–50%; Higher, 50–75%; Highest, 75–100%. The p-values are from Fisher’s exact test.
See also Figure S6.
Although ΔCyt values of individual transcripts were different according to the stress type (Figures 6A and S6B-S6D), ΔRG values of individual transcripts upon ER, HS and AS treatments exhibited very strong positive correlations (Figures 6B and S6E-S6G), suggesting a common stress-dependent mechanism for targeting a similar group of RNA species to SGs. In support of this, we also detected the dependency of ΔRG on transcript length (Figures 6C, S6H and S6I) and AU-rich motifs (Figures 6D, S6J and S6K) for both HS and AS stress, as seen in the ER stress data (Figures 5A-5D).
Proto-Oncogenes Are Preferentially Targeted to the RG in Response to Diverse Stresses
Gene enrichment analysis of ER cluster 1, the cluster with the highest ΔRG-ER values, showed that the cluster is highly enriched with transcription factors and protein kinases (Figures S6L-S6N) with genes playing pivotal roles in cell proliferation and survival (Figures S6O and S6P), such as proto-oncogenes (Figure S6Q). Additional analyses revealed that transcripts with high ΔRG upon ER, HS and AS are all highly enriched with proto-oncogenes (Figure 6E), demonstrating a functional conservation of RG targeting across different types of stress.
Clustering Analyses Revealed Stress-Specific Elements Required for RG Targeting
Despite the overall conservation of RG-targeted transcripts across stress conditions, we also identified stress-type specific subsets of transcripts through clustering analysis (Figures 7A-7D and Tables S3 and S4). For example, HS clusters 1 and 2 had the highest ΔRG-HS and can both be considered to exhibit stress-induced RG targeting (Figure 7A), yet ER cluster 1 is the only cluster which exhibited positive ΔRG-ER values (Figure 4A). mRNA from HS cluster 2 substantially overlaps with ER cluster 1 (Figure 7B). Like ER cluster 1 (Figures 5B-5E), HS cluster 2 is enriched with ARE and PBE motifs (Figures 7E, 7F and S7A-C). However, HS cluster 1 contains non-ARE sequence elements, such as GC-rich motifs or Rbm-family motifs, as the most representative RNA motifs (Figures 7G, 7H and S7D-F), suggesting that HS cluster 1 may be regulated through a different mechanism than ER cluster 1. Similarly, AS cluster 1, which has the highest ΔRG-AS, also does not significantly overlap with ER cluster 1, again suggesting the presence of stress-specific mechanisms for RG targeting (Figures 7C and 7D).
Figure 7. Stress type-specific RG targeting upon heat shock (HS) and arsenite toxicity (AS).
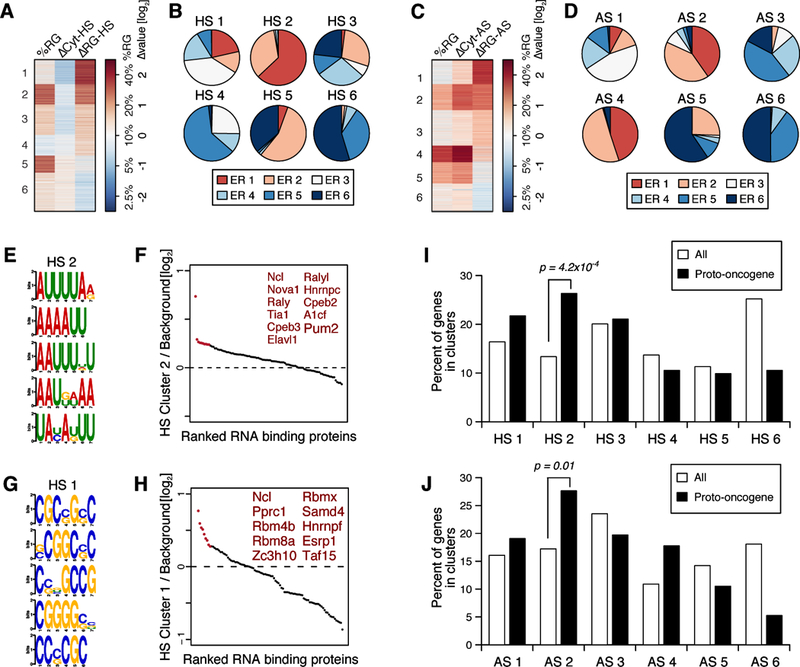
(A, C) Transcript clusters identified from the RG RNA-seq for HS (A) and AS (C) experiments.
(B, D) Composition of HS (B) and AS (D) cluster transcripts by their ER clusters. Note that ER cluster 1 is the cluster with the highest ΔRG-ER values (Figure 4A).
(E, G) The top 5 RNA motifs enriched in HS cluster 2 (E) and HS Cluster 1 (G), identified by DREME.
(F, H) Relative enrichments of CISBP-registered RBP motifs in HS cluster 2 (F) and HS cluster 1 (H) over the background control are presented in dot plots. The top 10–11 RBP motifs are highlighted in red.
(I, J) Enrichment of proto-oncogenes in HS cluster 2 and AS cluster 2. Bar graphs represent the distribution of all genes (white bars) or proto-oncogenes (black bars) for the clusters generated from the HS or AS experiments. The p-values are from Fisher’s exact test.
Interestingly, the overlapping clusters in the three stress types, ER cluster 1, HS cluster 2 and AS cluster 2, are significantly enriched with transcripts encoding proto-oncogenes and cell growth-accelerating proteins (Figures 7I, 7J, S6O-Q, S7G and S7H) and may link the functional correlation between mRNA targeting to the RG and the control of cell survival upon cell stress in general. The non-overlapping ΔRG-high clusters, such as HS cluster 1 and AS cluster 1, may influence stress type-specific responses. Consistent with these findings, the general correlation between ARE and stress-induced RG targeting is the strongest in the context of ER stress (Figure 5D) but is weaker in HS or AS contexts (Figures 6D, S6J and S6K), most likely due to the presence of alternative RG targeting mechanisms such as the one through GC-rich motifs for HS. Likewise, the correlation between PBE and RG targeting was only detectable in the context of ER stress (Figures 5F, S6R and S6S). Therefore, even though there is overall similarity between RG-targeted transcriptomes formed after ER, HS and AS stresses, each stress type induces unique mechanisms for RG targeting of specific transcripts.
DISCUSSION
The current study provided the first transcriptome-level snapshot of how different stresses regulate the dynamics of individual mRNA species between the soluble cytoplasm and insoluble RG. In contrast to the general belief that stress-induced RNA granulation is directed by the translational arrest of bulk mRNA species, our results show that only a specific subset of mRNA species is recruited into the RG during stresses and that translational suppression is not the major driving factor for selective mRNA sequestration into the insoluble RG. Instead, several features, such as extended physical length and the presence of AREs or other RNA sequence motifs, were identified to determine stress-induced mRNA recruitment to the RG. Specifically, ARE-containing 3’ sequences were able to drive stress-induced RG targeting in otherwise identical transcripts. The role of AREs in stress-induced RG targeting is consistent with the abundant presence of ARE-binding proteins, such as TIA-1 and TIAR, in SGs, the most prominent stress-induced RNP granule (Decker and Parker, 2012; Kedersha and Anderson, 2007).
AREs are considered a major sequence element that targets transcripts towards deadenylation and degradation (Khabar, 2017). Therefore, it is plausible that RNP granules such as SGs promote mRNA degradation during stress. Indeed, during HS stress, RG targeting (ΔRG) and total cytoplasmic mRNA change (ΔCyt) showed a strong negative correlation (Figure S7I). This suggests that RG targeting may coincide with cytoplasmic mRNA degradation. However, during ER and AS stress, this negative correlation did not exist (Figures S7J and S7K). RG targeting may even have some positive impact on protein expression because there is a slight positive correlation between translation efficiency (ΔTE) and RG targeting (ΔRG) during ER stress (Figure 4E). RG-targeted mRNAs may be protected from degradation during stress then released from the insoluble structure during favorable conditions and utilized for protein production. Therefore, it is possible that the impact of RG targeting on the expression of targeted transcripts is different between distinct stress contexts.
Another important finding from this study is that distinct stresses targeted a similar group of lengthy and ARE-rich mRNAs to the RG, suggesting that the SG across stress types has similar RNA component profiles. Importantly, the common group is highly enriched with proto-oncogenes, suggesting that stress-induced RG targeting may be important for limiting cell proliferation and growth during stress. Recent studies showed that SG formation is critical for oncogenic transformation and stress adaptation of cancer cells (Anderson et al., 2015). Considering that proto-oncogenic transcripts are rich in AREs and often subjected to post-transcriptional mRNA processing and degradation (Khabar, 2017), dynamic RG targeting may provide an additional layer of gene regulation that can either allow or prevent cancer cell survival and proliferation under stressful conditions.
While this work was under review, two other papers presented the transcriptomic profiling of LSM14A- and G3BP-interacting mRNAs that represent P-bodies and SGs, respectively (Hubstenberger et al., 2017; Khong et al., 2017). These studies, as well as several additional studies focusing on the other SG-localized proteins such as TIA-1, TIAR and FUS (Kapeli et al., 2016; Wang et al., 2010), significantly improved our understanding of how RNA granulation can be specific to a small subset of transcripts. These studies are complementary to the current work, as they performed more specific isolation of transcripts bound to a specific protein, yet they did not perform parallel analyses in unstressed and stressed cells. By focusing on dynamic changes induced by stresses, we were able to identify some interesting features (e.g. proto-oncogene regulation and stress-specific RG recruitment), which were not discovered by these other studies. It would certainly be an interesting future direction to identify molecular mechanisms of how different stresses produce different effects on RG targeting of specific transcripts.
We compared the index of P-body enrichment (Hubstenberger et al., 2017) with the stress-dependent RG enrichment score (ΔRG) of the current study. The comparison indicated that ΔRG-ER and the P-body index have an overall positive correlation (Figure S7L); however, interestingly, the scatterplot showed an interesting “Γ” shape, suggesting that ΔRG-ER may have more specificity than the P-body index. Further analysis revealed that only 20.5% of P-body-positive transcripts had positive values for ΔRG-ER (Figure S7L). This analysis suggests that, although P-bodies and SGs may share common RNA components, ER stress-induced transcript targeting into the RG could be more selective than constitutive P-body recruitment.
The recently published SG score was derived solely from AS-stressed U2OS cells without an unstressed control (Khong et al., 2017). Therefore, the SG score would be very closely related to the %RG-AS, the absolute RG fraction over Cyt in AS-stressed cells, of the current study. Indeed, the SG score and the %RG-AS produced a very strong positive correlation of r=0.69 (Figure S7M), despite the fact that the studies were performed in different cell types of different species (U2OS vs. NIH3T3). However, we also found a positive correlation between the SG score and %RG-Con score, the absolute RG fraction over Cyt in unstressed cells (r=0.37; Figure S7N). This is consistent with our findings that the G3BP-positive RG is substantially present in unstressed cells (Figures 1B-1E and S1B). As a result, when compared to %RG-AS, ΔRG-AS, the AS-dependent RG enrichment score, was less correlated with the SG score (r=0.53, compared to r=0.69; Figures S7M and S7O). In the future, it would be interesting to investigate the role and the significance of the G3BP-positive RG in unstressed cells, and how they function in SG formation during stresses.
Another recent study indicated that the ER-associated RNP complexes could be a significant source of RNP granules (Hermesh and Jansen, 2013; Reid and Nicchitta, 2012). However, our analyses showed that many ER markers were almost completely depleted in our RGs (Figures 1C and 1D). In addition, the ER association of mRNA (Reid and Nicchitta, 2012) did not have any correlation with the ΔRG-ER score (Figure S7P), indicating that the ER-associated RNP complexes did not significantly affect our analysis.
Ribosomes are another RNP found in the RG fraction (Figure 1D), and ribosomes decreased in the RG after ER stress (Figures 1D and 1E). RG isolation in the presence of EDTA, which disrupts the ribosome complex, decreased the total RNA content of the RG specifically in unstressed cells (Figure S2H, upper panel). As EDTA did not affect the total RNA content of the RG in ER stressed cells (Figure S2H, upper panel), the ribosome-associated transcripts may account for the negative ΔRG-ER values in many transcripts (Figure S2F). However, the majority of our study focused on the analysis of positive ΔRG-ER transcripts, which are not affected by ribosome-associated transcripts in the RG of unstressed cells. Furthermore, assembly and disassembly of ribosomes do not seem to have substantially affected our ΔRG-ER analysis because ribosome dissociation by EDTA (Figure S2H, lower panel) or puromycin (Figures 2D, 2E and S3J) did not alter the specificity of ER stress-induced RG targeting.
In summary, our results suggest that differential regulation of mRNA sequestration could be one of the major mechanisms for how cells regulate gene expression and shape the functional transcriptome landscape during stress. Defective regulation of subcellular RNA dynamics, such as excessive accumulation of SGs or similar RNP granules, has been implicated in many human diseases including cancer (Anderson et al., 2015) and neurodegenerative disease (Li et al., 2013). These types of cells are expected to be under constant levels of stress, therefore the relationship between RNA dynamics and stress may be key to understanding the pathogenetic mechanisms underlying the diseases. The results from this work provide a foundation for investigating these pathologies, and our isolation and analysis techniques can be employed to identify specific transcripts that are sequestered from the soluble cytoplasm to insoluble RNP granules in various pathological conditions.
STAR METHODS
CONTACT FOR REAGENT AND RESOURCE SHARING
Further information and requests for resources and reagents should be directed to and will be fulfilled by the Lead Contact, Jun Hee Lee (leeju@umich.edu).
EXPERIMENTAL MODEL AND SUBJECT DETAILS
NIH3T3 (CRL-1658 from ATCC), HEK293 (293A; R70507 from Invitrogen), HCT116 (CCL-247 from ATCC), Norad-KO HCT116 and Pum1/2-KO HCT116 (Lee et al., 2016) cell lines were maintained in Dulbecco’s modified Eagle’s medium (DMEM, Thermo Fisher, 11965–092) supplemented with 10% fetal bovine serum (FBS, Sigma, F4135) and 1% penicillin/streptomycin (Thermo Fisher, 15140–122) at 37 °C and 5% CO2 (unless stated otherwise). Upon receipt, each cell line was subcultured for less than 6 months prior to initiation of the described experiments. All cell lines were tested negative for Mycoplasma contamination by PCR-based analysis, using the following primers: F: 5’-GTGGGGAGCAAA(C/T)AGGATTAGA-3’, R: 5’-GGCATGATGATTTGACGTC(A/G)T-3’.
METHOD DETAILS
Stress treatments
For ER stress, cells were treated with 1 μM thapsigargin (Tg; Sigma, T9033; 1 mM stock in DMSO was used) for 1.5 hrs. To confirm SG-specific effects, 2 μg/ml of cycloheximide (CHX; Sigma, C7698), 10 μg/ml of emetine (EMT; Sigma, E2375) or 10 μg/ml of puromycin (PUR; Sigma, P8833) was co-treated with thapsigargin. DMSO (1:1000)-treated cells were used as a control for the ER experiment. For heat-shock (HS) stress, water (1:1000)-treated cells were incubated at 43 °C/5% CO2 for 45 min. For arsenite (AS) stress, cells were treated with 0.5 mM NaAsO2 (Sigma, S7400; 0.5 M stock in water was used) for 1 hr. For both HS and AS experiments, water (1:1000)-treated cells incubated at 37 °C/5% CO2 were used as a control.
Preparation of RNA samples for RG RNA-Seq
After appropriate treatments, cells were placed on ice and washed twice with 10 ml ice-cold PBS. This washing step was done quickly, within 10 seconds. After washing, the cells were harvested in 1.5 ml of ice-cold buffer L (50 mM Tris pH 7.6, 50 mM NaCl, 5 mM MgCl2, 0.1% NP-40, 1 mM β-mercaptoethanol, 1x EDTA-free protease inhibitor cocktail (Roche, 05 892 791 001), 0.4 U/μL RNase inhibitor (Thermo Scientific, AM2696)) on ice. All subsequent steps were conducted on ice or at 4 °C. Cell suspensions were given 30 strokes (1 mL, in 30 seconds) in a Dounce homogenizer, followed by centrifugation at 2,000 g for 2 min. The supernatant (Cyt, cytosolic fraction) was collected without disrupting nuclei pellet (Nuc). 10 μl of Cyt was taken for protein quantitation by Bradford assay. 125 μl of Cyt was mixed with 375 μl of Trizol LS (Thermo Fisher, 10296010) for Cyt RNA extraction (Cyt-Trizol). 1 ml of Cyt was centrifuged at 10,000 g for 10 min to separate the soluble fraction (Sol) from the insoluble pellet fraction (RG). The RG was resuspended in 500 μl of Trizol (Thermo Fisher, 15596018) for RG RNA extraction (RG-Trizol).
Then, the same amount of spike-in RNA control, determined proportionally to the Cyt protein concentration (measured from the 10 μl aliquot as described above), was added to Cyt-Trizol and RG-Trizol. For example, when Cyt protein concentration was measured as 1 mg/ml, 10 μl of 1x spike-in control RNA mix (see below about how it was prepared) was used for RNA-seq experiments, and 0.5 μg of Drosophila total RNA was used for quantitative RT-PCR experiments. After Trizol extraction, performed according to the manufacturer’s instructions (Thermo Fisher, 15596018), RNA was precipitated in isopropanol and used for subsequent applications.
Performing the initial cell washing step at 37°C or on ice did not significantly alter basal RG content of ER cluster 1 transcripts, including Xiap, Ago3, Creb1 and Norad, as well as a ER cluster 4 transcript BiP (Figure S2I). Replacing 5 mM MgCl2 in buffer L with 30 mM EDTA did not significantly change the stress-induced RG targeting of specific transcripts, such as Xiap, Ago3, Creb1, Rictor, Brca1 and Norad (Figure S2H, lower panel). Non-targeted transcripts, such as Actb, Gapdh, BiP and Rpl7, did not show stress-induced RG targeting in both MgCl2 and EDTA conditions (Figure S2H, lower panel).
Ex-vivo microscopic analysis of the RG
The pRFP-G3BP vector was a kind gift from Drs. B.L. Wolozin (Boston University) and N. Kedersha (Harvard) (Liu-Yesucevitz et al., 2014). HEK293 cells transfected with pRFP-G3BP were subjected to RG preparation as described above in the “Preparation of RNA samples for RG RNA-Seq” section. Isolated RG was resuspended in mounting media (H-1000, Vector laboratories) and spread on microscope slides. For whole cell imaging, cells were grown on coverslips, briefly fixed with 4% formaldehyde (Polysciences Inc., 18814), stained with DAPI, and mounted in Vectashield anti-fade mounting media (H-1000, Vector laboratories). Both whole cell and RG images were obtained under a Leica SP5X confocal microscope.
Preparation of spike-in RNA controls
Drosophila total RNA, used as a spike-in RNA control for quantitative RT-PCR experiments, was prepared from w1118 adult flies using the Trizol method (Thermo Fisher, 15596018). Spike-in control RNA mix, used for RNA-seq experiments, is a mixture of three in vitro transcribed Drosophila genes (dRpS7 30 pg/μl, dGapdh1 3 pg/μl, dAct5C 0.3 pg/μl). To prepare the spike-in control RNA mix, Drosophila cDNA was prepared from Drosophila total RNA using MMLV-reverse transcriptase (Thermo Fisher, 28025013) and random hexamers (Thermo Fisher, N8080127). For in vitro transcription, ~500 bp of dRpS7, dGapdh1 and dAct5C cDNA sequences, attached to a T7 minimal promoter sequence (5’-TAATACGACTCACTATAGGGAGA-3’), were amplified from the Drosophila cDNA using the primers listed in Table S5.
In vitro transcription reactions were conducted using the amplified DNA and the T7 MAXIscript kit (Thermo Scientific, AM1312). The transcription product was treated with DNase I (Thermo Fisher, 18068015) then subjected to phenol-chloroform extraction and isopropanol precipitation. After quantification, RNA products were diluted in DEPC-treated water and mixed to constitute the spike-in control RNA mix.
Preparation of RNA-seq library
1 μg of DNase I-treated total RNA purified from Cyt and RG was subjected to rRNA depletion by Ribo-Zero rRNA removal Kit (Illumina, MRZH1116). rRNA-depleted RNA was precipitated in 100% ethanol and reconstituted in DEPC-treated water. The RNA-seq library was constructed using the NEXTflex™ Rapid Directional qRNA-seq™ Kit (Bioo scientific, 5130–01D), according to the manufacturer’s instructions. RNA-seq was performed at the University of Michigan DNA Sequencing Core Facility with Illumina HiSeq2000. For analyses of sequencing results, see the QUANTIFICATION AND STATISTICAL ANALYSIS section.
Quantitative RT-PCR
0.5 μg of DNase I-treated total RNA purified from Cyt and RG was reverse transcribed using MMLV reverse transcriptase (Thermo Fisher, 28025013) and random hexamers (Thermo Fisher, N8080127). The cDNA products were diluted 10-fold with nuclease-free water, and 1 μl of the diluted cDNA was used for real-time quantitative PCR. iQ SYBR Green Supermix (Bio-rad, 1708884). List of primers used in quantitative RT-PCR is provided in Table S5. Quantitative PCR was performed using the StepOnePlus Real Time PCR system (Applied Biosystems). The averages of dRpL32 and dGapdh1 measurements were used as a spike-in control to calculate relative gene expression.
Ribosome profiling and analysis
The ribosome footprint strategy was designed according to a previous study (Ingolia et al., 2012). The method was partially modified for the generation of a matching RNA-seq library. In brief, NIH3T3 cells were cultured in DMEM with 10% (v/v) fetal bovine serum (FBS) in a humidified 5% CO2 atmosphere at 37°C. 7 × 10⁵ cells were seeded in a 10-cm dish, followed by DMSO or thapsigargin (1 μM for 1.5 hr) treatment after 48 h. Cultured cells were washed twice with ice-cold 1x PBS and lysed in lysis buffer (20 mM Tris-Cl (pH7.4), 150 mM NaCl, 5 mM MgCl2, 1 mM DTT, 100 μg/ml cycloheximide, 1% (v/v) Triton X-100, 25 U/ml Turbo DNase I) by triturating the cells ten times through a 26-gauge needle. After centrifuging the cell lysate at 20,000g in 4°C for 10 min, the supernatant was divided into two groups for generating the ribosome profiling library and mRNA expression profiling library.
For the ribosome profiling library, lysates were treated with RNase I (100 U/μl) and incubated at room temperature for 45 min. After nuclease digestion, ribosome footprinted RNAs were purified by sedimentation through a 1 M sucrose cushion and excising the urea gel between 26–34 nucleotides. The 3’ end was dephosphorylated by adding PNK and ligated by adding 40 pmol of an RA3 adaptor. The 5’ end was phosphorylated by adding PNK and ATP and ligated by adding 30 pmol of an RA5 adaptor and 50 pmol of RTP primer. After reverse transcription using Superscript II reverse transcriptase (Invitrogen), rRNA products were depleted by hybridization to biotinylated sense-strand oligonucleotides, followed by removal of the duplexes through streptavidin bead affinity. Finally, through PCR and gel extraction, the library was generated using the size range 150–160 bp.
For the mRNA-seq library, poly(A) RNA was isolated using Dynabeads® mRNA purification kit (Ambion), according to the manufacturer’s protocol. After RNA fragmentation with 1 N NaOH at 37°C for 3 min, the final library ranging from 150 to 200 bp was generated, followed by the same process for producing the ribosome profiling library from the step of 3’ dephosphorylation, excluding rRNA depletion.
Translation efficiency (TE) was defined as the amount of ribosomal footprint normalized to underlying mRNA abundance and expressed in a log10 scale. For TE calculations, transcripts with raw read counts less than 50 in any of the sequencing reads were removed from the analysis. The TE values were normalized to have the same median values across replicates of the same experiment. ΔTE-ER was defined as the ER stress-induced change in TE, expressed in a log2 scale.
Immunoblotting
Whole cell lysates were prepared in cell lysis buffer (Tris pH 7.5, 150 mM NaCl, 1% NP-40, 1 mM NaF, 0.1 mM NaVO3, 1x EDTA-free protease inhibitor cocktail (Roche, 05 892 791 001)). Nuc, Cyt, RG and Sol fractions were prepared through the same method as described above in the “Preparation of RNA samples for RG RNA-Seq” section. Nuclear fraction (Nuc) and the RG were reconstituted in 8 M Urea buffer (8 M urea, 50 mM Tris pH 8.0, 300 mM NaCl, 0.5% NP-40, 50 mM Na2HPO4). After normalizing protein concentration by the Bradford assay, protein samples were boiled in SDS sample buffer for 5 min, resolved by SDS-PAGE, transferred to PVDF membrane filters, probed with primary antibodies (1:200 for Santa Cruz antibodies, and 1:1000 for all other antibodies), then probed with horseradish peroxidase-coupled secondary antibodies (1:5000; anti-goat (sc-2020) antibody was from Santa Cruz Biotechnology, and anti-rabbit (1706515) and anti-mouse (1706516) antibodies were from Bio-rad). Chemiluminescence images were acquired using LAS4000 (GE) system.
GFP-MS2 labeling
The pGFP-MS2 vector was a kind gift from Dr. J. L. Goodier (Johns Hopkins) (Goodier et al., 2010). The pSL-MS2(6x) vector was obtained from Addgene (27118, originated from Dr. Robert Singer). The MS2(6x) binding sequence was subcloned into a lentiviral expression vector (pLU-CMV) to create a pLU-CMV-MS2(6x) vector. Mouse cDNA was prepared from NIH3T3 total RNA using MMLV-reverse transcriptase (Thermo Fisher, 28025013) and random hexamers (Thermo Fisher, N8080127). 3’-UTR sequences of Brca1, Ago3 and Xiap were amplified from the mouse cDNA using the following primers; Brca1 3’UTR F: 5’-TTTAAGAAATGGTCTTCCATG-3’, Brca1 3’UTR R: 5’-GTCAAAATGTTTGCTATTTAGTTTAT-3’, Ago3 3’UTR F: 5’-CAAGTCCAAGTTTATTCTCCGTG-3’, Ago3 3’UTR R: 5’-CAGGGGGTTGGCAAAGTC-3’, Xiap 3’UTR F: 5’-TGGGGCACCACATGTTAT-3’, Xiap 3’UTR R: 5’-AACATTTTAAAGAATAGTGCTTTATTG-3’. HEK293 cells were transiently co-transfected with both pGFP-MS2 and pLU-CMV-3’UTR-MS2(6x) using polyethylenimine (Polysciences Inc., 23966).
Immunostaining
NIH3T3 cells or GFP-MS2-transfected HEK293 cells were grown on coverslips for 48 hrs. After DMSO or Tg treatment, cells were fixed with 4% formaldehyde (Polysciences Inc., 18814) and permeabilized with 0.2% Triton X-100. Cells were incubated with 3% bovine serum albumin (Sigma, A8806) in PBS then with primary antibodies (1:1000 for P-body markers and 1:200 for all others) in PBS for 2 hrs. After washing, cells were incubated with Alexa fluor-conjugated secondary antibodies (1:1000; anti-goat (A11055, A11058), anti-mouse (A21202) and anti-rabbit (A21207) antibodies from Thermo Fisher) for 1 hr, washed with PBS, counterstained with DAPI, and mounted in Vectashield anti-fade mounting media (H-1000, Vector laboratories).
RNA in situ hybridization
For detection of single molecule RNA in cells, the Stellaris® RNA fluorescence in situ hybridization (FISH) method was used. In brief, each mRNA in cells was stained with 30 different Quasar-570 labelled FISH probes. The FISH probes used for in situ detection of Brca1, Ago3, Xiap, Norad and Actb genes are listed in Table S5. For probing the Gapdh gene, the ShipReady probe set (SMF-3002–1) was used. All these probes were designed and produced by LGC Bioresearch Technologies, Inc. (Petaluma, CA).
The cells were processed as described above in the “Immunostaining” section. After the secondary antibody incubation and the PBS washing step, cells were fixed again with 4% formaldehyde (Polysciences Inc., 18814) and incubated with wash buffer A (10% formamide, 2x SSC) for 5 min. Cells were then incubated with the probes (0.25 μM for Actb, 1 μM for the others) in Hybridization buffer (1% dextran sulfate, 10% formamide, 2x SSC) at 37 °C for 12 hrs, incubated with wash buffer A, containing DAPI for 30 min, washed twice with PBS, and mounted in an anti-fade mounting buffer (100 mM Tris pH 8.0, 0.4% glucose, 2x SSC, 90% glycerol, 0.29 mg/ml catalase (Sigma, C3515), 0.04 mg/ml glucose oxidase (Sigma, G2133)). Images were captured under a Leica SP5X confocal microscope. For colocalization analysis between RNA and protein, Manders’ coefficients using threshold values were calculated from the images as described previously (Bolte and Cordelieres, 2006) (n=3).
QUANTIFICATION AND STATISTICAL ANALYSIS
Overview of RG RNA-seq analysis
A single RG RNA-seq experiment produces two different RNA-seq datasets from the cytosolic fraction (Cyt) and the RG. RG RNA-seq was performed on five different experimental conditions: Con1, DMSO-treated control (control for ER); Con2, water-treated control (control for HS and AS); ER, Tg-induced ER stress; HS, heat shock stress; AS, arsenite stress. Detailed experimental procedures for stress treatment and RNA-seq are described above in the METHOD DETAILS section. The RG RNA-seq experiments were triplicated for Con1 and ER experiments and duplicated for Con2, HS and AS experiments. Therefore, the first and the second replicates (Rep1 and Rep2) were done with all five experimental conditions, while the third replicate (Rep3) was done with only Con1 and ER experiments. The raw RNA-seq data from these experiments and replicates were processed as described below to produce %RG, ΔCyt and ΔRG values, which were used for subsequent analyses such as gene clustering and sequence motif analyses. Con1 and Con2 produced almost identical RG RNA-seq profiles (Figure S6T). The overall procedure is summarized in Figures S2J and S2K.
Processing RNA-seq data to read counts
The sequence data was first processed by extracting the Unique Molecular Identifiers (UMI) at the first 8 bases of the sequence reads and tagging each reads with its UMI. UMI tagged reads were mapped to the mm9 reference genome using TopHat with default mapping parameters (Trapnell et al., 2009). Duplicate reads mapped to the same genomic position with identical UMI were collapsed to a single read. We generated the read count per transcript table based on the RefSeq gene annotation (refFlat) using the bedtools coverage option (Quinlan and Hall, 2010). For transcripts with multiple isoforms, the isoform initially retrieved from the database was used as the reference. The count tables were used for the initial identification of up and down-regulated genes in the RG that are not associated with Cyt (total cytoplasmic) fluctuation, which was done using DESeq2 Interaction analysis in the R bioconductor package (Love et al., 2014). The resulting 1534 transcripts were presented in a heatmap (Figure S3A) and listed in Table S1. Among these, 850 transcripts accumulate in the RG in response to ER stress, while the other 684 transcripts are expelled from the RG.
Normalization of the RNA-seq read counts
In brief, the read counts were normalized to the spike-in read counts, followed by the fraction calculation of RG over Cyt read counts (%RG). Then %RG values were linearly normalized so that they have the same median values across replicates of the same experimental condition. This normalization scheme is described in detail below (also see Figures S2J and S2K). First, unaligned RNA-seq reads were mapped to the spike-in template sequences from Drosophila mRNA (dAct5c, dGapdh1, dRpS7) using Bowtie to count spike-in control reads (Langmead, 2010). We then normalized the read counts to the relative spike-in read counts. In detail, we calculated the relative dAct5c, dGapdh1, and dRpS7 spike-in reads in each sample by dividing their counts by the average of the dAct5c, dGapdh1, and dRpS7 read counts between different experiments within the same replicate (RG and Cyt read counts of Con1, ER, Con2, HS and AS for Rep1 and 2; RG and Cyt read counts of Con1 and ER for Rep3; first SI table in Figure S2K). Then we calculated the mean of the relative dAct5C, dGapdh1, and dRpS7 reads for each individual sample (second SI table in Figure S2K). We used this mean value for each sample as the normalization factor for the spike-in read counts and divided all read counts by this spike-in normalization factor (Read count table in Figure S2K).
αi,j : spike-in normalization factors for sample i, replicate j.
Next, we calculated the fraction between spike-in normalized RG and Cyt read counts (%RG). Transcripts with raw read counts less than 50 in any of the conditions were removed from the analysis. Although the %RG reflects the absolute amount of RNA in each fraction through spike-in normalization, there could be systematic errors introduced by the variation of spike-in addition to each sample. To adjust for such variations, we calculated the median of the %RG in each condition (Con1, ER, Con2, HS and AS; %RG table in Figure S2K), and obtained the average of the medians of the same conditions between the replicates (Rep1, 2, and 3 for Con1 and ER; Rep 1 and 2 for Con2, HS and AS; Median %RG for all reps in Figure S2K). Then, the fraction normalization factor was defined as the average of the medians divided by the median of the RG fractions in the sample (Normalization factors for %RG in Figure S2K).
fri,j,k : RG fraction of sample i, replicate j, transcript k.
βi,j : fraction normalization factors for sample i, replicate j.
Similarly, the fold change between control (Con1 and Con2) and stress conditions (ER, HS and AS) were normalized by the median fold changes (Normalization factors for ΔCyt in Figure S2K).
fci,j,k : Fold change of sample i, replicate j, transcript k.
γi,j : fold change normalization factors for sample i, replicate j.
Sequence motif analysis
Transcript sequences were extracted from the mm9 reference sequence and the refSeq annotations to fasta format files. For the random hexamer analysis, we counted the occurrences of all possible 46 combinations of sequence motifs from AAAAAA to UUUUUU. For each cluster, we either compared the count distributions to the other clusters, or to a length controlled background set that was randomly selected from the other clusters to have similar transcript length distribution and the same number of transcripts.
Discriminative Regular Expression Motif Elicitation (DREME) analysis was performed using a locally installed command line version of the MEME suite (Bailey, 2011). Top motifs were extracted using default parameters using the clusters with increased ΔRG and the length-matched background set (see below for how this set was prepared).
Sequence motifs for known mouse RNA binding protein (RBP) were acquired from the CISBP-RNA database (Ray et al., 2013). We counted for the occurrences of consensus sequences and in each transcript for the ER and HS cluster transcripts and calculated their enrichments relative to the length controlled background set. To generate background sets having samples with matched transcript lengths to the test set, we first divided the transcripts by log10 of the transcript length. Intervals of 0.1 were used to split the transcripts into subgroups. Then within each subgroup, we randomly sampled matched pairs of transcripts from the test set and from the remainder of the test set until we sampled all from either the test set or from the remainder. We repeated this sampling from all the subgroups divided by transcript lengths, and generated length-matched test and the background set.
Gene ontology and pathway analyses
Functional enrichment analyses were used to identify whether certain biological functions and pathways were significantly over-represented in specific gene clusters. Gene functions were defined by the Gene Ontology (GO) database, and molecular pathways were defined by Kyoto Encyclopedia of Genes and Genomes (KEGG) and Protein Analysis through Evolutionary Relationships (PANTHER) databases (Kanehisa and Goto, 2000; Thomas et al., 2003). Web-based tools provided by the Database for Annotation, Visualization and Integrated Discovery (DAVID) and the PANTHER pathway databases were used to construct tables provided in Figure S6L-S6N. EASE scores of 0.01 and p-values of 0.05 were used as a cutoff for significance (Huang da et al., 2009; Thomas et al., 2003).
To examine the enrichment of “ER stress-inducible genes” in specific clusters, a list of 770 ER stress-inducible genes, identified by a recent RNA-seq experiment (Han et al., 2013), was used. To examine the enrichment of genes involved in “Positive regulation of cell proliferation” or in “Negative regulation of apoptosis”, gene lists corresponding to such categories were obtained from the Gene Ontology Consortium database (Gene Ontology, 2015). The gene list used for “Proto-oncogenes” was obtained from the UniprotKB keywords database (UniProt, 2015). The “lncRNA” list was generated using the data from the NCBI Reference Sequence Database. Transcripts longer than 500 bp that do not contain annotated coding regions were classified as “lncRNA”. Transcript isoforms of the coding RNA that do not contain coding sequence were removed due to possible interferences from their coding isoforms.
In these analyses, statistical significance (p-value) was calculated using Fisher’s Exact test.
Comparison with other datasets
P-body enrichment index (fold change=sorted P-bodies/pre-sorted fraction) was retrieved from Table S2 of a recently published paper (Hubstenberger et al., 2017). SG enrichment index (fold change) was from Data S1 of another recent paper (Khong et al., 2017). ER association index (mRNA %ER) was from Table S2 of a paper profiling ER-enriched transcripts (Reid and Nicchitta, 2012).
Area-proportional Venn Diagram
Area-proportional Venn Diagram was generated using BioVenn (Hulsen et al., 2008).
Analysis of RNA physical properties
For the RNA secondary structure analysis, we calculated the RNA folding energy prediction using the ViennaRNA Package (Lorenz et al., 2011). RNA sequences were retrieved from the refseq annotations and the mm9 genome. The RNA folding energy was calculated by the RNALfold command using the default parameters. The positions and the folding energies of local secondary structures were considered in this analysis. G/C contents (GC%) and GGGG frequencies were also calculated from the RNA sequences.
Alternative last exon analysis.
From the last exons of all ensemble gene isoforms, we chose short and long last exon isoform pairs that share the same exon start sites but have different 3´ ends (n=30,638 pairs). We generated RNA-seq read counts from the cytoplasm (Cyt) and the RNA granule (RG) fractions that map to these alternative last exons. Short exon counts correspond to the sequence common to both isoforms (Figure 5I, left panel). Long exon counts correspond to the sequence specific for the longer isoform (Figure 5I, left panel). We selected alternatively expressed last exon pairs that contain greater than 10 read counts in both the short and the long exon counts. We also selected pairs whose long exon read densities (read count/exon length) are between 5% and 50% of the corresponding short exon read densities in the control Cyt samples. As a result, total 4,405 pairs of alternatively terminated transcripts were used for following analyses. Read density ratios (long/short) were then calculated for the Cyt and RG fractions in control (DMSO, Con) and ER stress (Tg) conditions. We also calculated %RG (RG RNA/Cyt RNA) and ΔRG (%RGTg/%RGCon) for the long and short exon pairs (ΔRGlong, ΔRGshort). ΔRGlong/short ratios between the long and short exon counts were used as the indicators of longer isoform enrichments in the RG under ER stress. For the linear regression analysis, the lengths of the long exon (bp) and counts of traditional AU-rich element (ARE; AUUUA) and Pumilio-binding element (PBE; UGUANAUA) in the long exon were converted to log z-scores. A multivariate linear regression between log2 ΔRGlong/short ratios and the log z-scores of the long exon properties was performed using the R statistical package.
Supplementary Material
Table S1. List of transcripts identified from the differential expression analysis (DESeq2) in control and ER stress-treated cells, shown in Figure S3A, related to Figure 3. Column A (id), gene name; column B (delRNA*_in_Cyt), unnormalized ΔCyt*; column C (delRNA*_in_RG), unnormalized ΔRG*; column D (delRNA*_difference), column C - column B.
Table S2. List of transcripts identified from the spike-in normalization and k-means clustering analysis in control and ER stress-treated cells, shown in Figure 4A, related to Figure 4. Column A, gene name; column B (del_Cyt-ER), ΔCyt-ER; column C (%RG), %RG; column D (del_RG-ER), ΔRG-ER; column E (Cluster(ER)), cluster identity assigned by k-means clustering.
Table S3. List of transcripts identified from the spike-in normalization and k-means clustering analysis in control and heat shock (HS)-treated cells, shown in Figure 7A, related to Figure 7. Column A, gene name; column B (del_Cyt-HS), ΔCyt-HS; column C (%RG), %RG; column D (del_RG-HS), ΔRG-HS; column E (Cluster(HS)), cluster identity assigned by k-means clustering.
Table S4. List of transcripts identified from the spike-in normalization and k-means clustering analysis in control and arsenic stress (AS)-treated cells, shown in Figure 7C, related to Figure 7. Column A, gene name; column B (del_Cyt-AS), ΔCyt-AS; column C (%RG), %RG; column D (del_RG-AS), ΔRG-AS; column E (Cluster(AS)), cluster identity assigned by k-means clustering.
Table S5. List of oligonucleotides used in the current work, related to STAR Methods.
ACKNOWLEDGEMENTS
We thank Dr. J. Mendell (UT Southwestern) for the Pum1/2- and Norad-knockout cells, Dr. J.L. Goodier (Johns Hopkins) for GFP-MS2, Drs. B.L. Wolozin (Boston University) and N. Kedersha (Harvard) for RFP-G3BP, H. Sunwoo (Harvard) for the RNA in situ methodology, Santa Cruz Biotechnology for antibodies, and J.T. Lis (Cornell) for insightful comments. We also thank Dr. H.M. Kang (Univ. of Michigan) for promoting collaboration between the authors. This work was supported by grants from the NIH (R01DK102850 to J.H.L., T32GM008322 and T32AG000114 to A.H., P30AG024824, P30DK034933, P30DK089503 and P30CA046592).
Footnotes
REFERENCES
- Anderson P, Kedersha N, and Ivanov P (2015). Stress granules, P-bodies and cancer. Biochim Biophys Acta 1849, 861–870. [DOI] [PMC free article] [PubMed] [Google Scholar]
- Bailey TL (2011). DREME: motif discovery in transcription factor ChIP-seq data. Bioinformatics 27, 1653–1659. [DOI] [PMC free article] [PubMed] [Google Scholar]
- Baird TD, and Wek RC (2012). Eukaryotic initiation factor 2 phosphorylation and translational control in metabolism. Adv Nutr 3, 307–321. [DOI] [PMC free article] [PubMed] [Google Scholar]
- Bolte S, and Cordelieres FP (2006). A guided tour into subcellular colocalization analysis in light microscopy. Journal of microscopy 224, 213–232. [DOI] [PubMed] [Google Scholar]
- de Nadal E, Ammerer G, and Posas F (2011). Controlling gene expression in response to stress. Nat Rev Genet 12, 833–845. [DOI] [PubMed] [Google Scholar]
- Decker CJ, and Parker R (2012). P-bodies and stress granules: possible roles in the control of translation and mRNA degradation. Cold Spring Harb Perspect Biol 4, a012286. [DOI] [PMC free article] [PubMed] [Google Scholar]
- Dember LM, Kim ND, Liu KQ, and Anderson P (1996). Individual RNA recognition motifs of TIA-1 and TIAR have different RNA binding specificities. J Biol Chem 271, 2783–2788. [DOI] [PubMed] [Google Scholar]
- Gene Ontology C (2015). Gene Ontology Consortium: going forward. Nucleic Acids Res 43, D1049–1056. [DOI] [PMC free article] [PubMed] [Google Scholar]
- Gilks N, Kedersha N, Ayodele M, Shen L, Stoecklin G, Dember LM, and Anderson P (2004). Stress granule assembly is mediated by prion-like aggregation of TIA-1. Mol Biol Cell 15, 5383–5398. [DOI] [PMC free article] [PubMed] [Google Scholar]
- Goodier JL, Mandal PK, Zhang L, and Kazazian HH Jr. (2010). Discrete subcellular partitioning of human retrotransposon RNAs despite a common mechanism of genome insertion. Hum Mol Genet 19, 1712–1725. [DOI] [PMC free article] [PubMed] [Google Scholar]
- Han J, Back SH, Hur J, Lin YH, Gildersleeve R, Shan J, Yuan CL, Krokowski D, Wang S, Hatzoglou M, et al. (2013). ER-stress-induced transcriptional regulation increases protein synthesis leading to cell death. Nat Cell Biol 15, 481–490. [DOI] [PMC free article] [PubMed] [Google Scholar]
- Han TW, Kato M, Xie S, Wu LC, Mirzaei H, Pei J, Chen M, Xie Y, Allen J, Xiao G, et al. (2012). Cell-free formation of RNA granules: bound RNAs identify features and components of cellular assemblies. Cell 149, 768–779. [DOI] [PubMed] [Google Scholar]
- Hermesh O, and Jansen RP (2013). Take the (RN)A-train: localization of mRNA to the endoplasmic reticulum. Biochim Biophys Acta 1833, 2519–2525. [DOI] [PubMed] [Google Scholar]
- Huang da W, Sherman BT, and Lempicki RA (2009). Systematic and integrative analysis of large gene lists using DAVID bioinformatics resources. Nat Protoc 4, 44–57. [DOI] [PubMed] [Google Scholar]
- Hubstenberger A, Courel M, Benard M, Souquere S, Ernoult-Lange M, Chouaib R, Yi Z, Morlot JB, Munier A, Fradet M, et al. (2017). P-Body Purification Reveals the Condensation of Repressed mRNA Regulons. Mol Cell 68, 144–157 e145. [DOI] [PubMed] [Google Scholar]
- Hulsen T, de Vlieg J, and Alkema W (2008). BioVenn - a web application for the comparison and visualization of biological lists using area-proportional Venn diagrams. BMC Genomics 9, 488. [DOI] [PMC free article] [PubMed] [Google Scholar]
- Ingolia NT, Brar GA, Rouskin S, McGeachy AM, and Weissman JS (2012). The ribosome profiling strategy for monitoring translation in vivo by deep sequencing of ribosome-protected mRNA fragments. Nat Protoc 7, 1534–1550. [DOI] [PMC free article] [PubMed] [Google Scholar]
- Ingolia NT, Ghaemmaghami S, Newman JR, and Weissman JS (2009). Genome-wide analysis in vivo of translation with nucleotide resolution using ribosome profiling. Science 324, 218–223. [DOI] [PMC free article] [PubMed] [Google Scholar]
- Jain A, and Vale RD (2017). RNA phase transitions in repeat expansion disorders. Nature 546, 243–247. [DOI] [PMC free article] [PubMed] [Google Scholar]
- Jain S, Wheeler JR, Walters RW, Agrawal A, Barsic A, and Parker R (2016). ATPase-Modulated Stress Granules Contain a Diverse Proteome and Substructure. Cell 164, 487–498. [DOI] [PMC free article] [PubMed] [Google Scholar]
- Kanehisa M, and Goto S (2000). KEGG: kyoto encyclopedia of genes and genomes. Nucleic Acids Res 28, 27–30. [DOI] [PMC free article] [PubMed] [Google Scholar]
- Kapeli K, Pratt GA, Vu AQ, Hutt KR, Martinez FJ, Sundararaman B, Batra R, Freese P, Lambert NJ, Huelga SC, et al. (2016). Distinct and shared functions of ALS-associated proteins TDP-43, FUS and TAF15 revealed by multisystem analyses. Nat Commun 7, 12143. [DOI] [PMC free article] [PubMed] [Google Scholar]
- Kedersha N, and Anderson P (2007). Mammalian stress granules and processing bodies. Methods Enzymol 431, 61–81. [DOI] [PubMed] [Google Scholar]
- Khabar KS (2017). Hallmarks of cancer and AU-rich elements. Wiley interdisciplinary reviews RNA 8. [DOI] [PMC free article] [PubMed] [Google Scholar]
- Khong A, Matheny T, Jain S, Mitchell SF, Wheeler JR, and Parker R (2017). The Stress Granule Transcriptome Reveals Principles of mRNA Accumulation in Stress Granules. Mol Cell 68, 808–820 e805. [DOI] [PMC free article] [PubMed] [Google Scholar]
- Langmead B (2010). Aligning short sequencing reads with Bowtie. Curr Protoc Bioinformatics Chapter 11, Unit 11 17. [DOI] [PMC free article] [PubMed] [Google Scholar]
- Lee S, Kopp F, Chang TC, Sataluri A, Chen B, Sivakumar S, Yu H, Xie Y, and Mendell JT (2016). Noncoding RNA NORAD Regulates Genomic Stability by Sequestering PUMILIO Proteins. Cell 164, 69–80. [DOI] [PMC free article] [PubMed] [Google Scholar]
- Li YR, King OD, Shorter J, and Gitler AD (2013). Stress granules as crucibles of ALS pathogenesis. J Cell Biol 201, 361–372. [DOI] [PMC free article] [PubMed] [Google Scholar]
- Liu-Yesucevitz L, Lin AY, Ebata A, Boon JY, Reid W, Xu YF, Kobrin K, Murphy GJ, Petrucelli L, and Wolozin B (2014). ALS-linked mutations enlarge TDP-43-enriched neuronal RNA granules in the dendritic arbor. J Neurosci 34, 4167–4174. [DOI] [PMC free article] [PubMed] [Google Scholar]
- Lorenz R, Bernhart SH, Honer Zu Siederdissen C, Tafer H, Flamm C, Stadler PF, and Hofacker IL (2011). ViennaRNA Package 2.0. Algorithms for molecular biology : AMB 6, 26. [DOI] [PMC free article] [PubMed] [Google Scholar]
- Love MI, Huber W, and Anders S (2014). Moderated estimation of fold change and dispersion for RNA-seq data with DESeq2. Genome Biol 15, 550. [DOI] [PMC free article] [PubMed] [Google Scholar]
- Mahboubi H, Seganathy E, Kong D, and Stochaj U (2013). Identification of Novel Stress Granule Components That Are Involved in Nuclear Transport. PLoS One 8, e68356. [DOI] [PMC free article] [PubMed] [Google Scholar]
- Quinlan AR, and Hall IM (2010). BEDTools: a flexible suite of utilities for comparing genomic features. Bioinformatics 26, 841–842. [DOI] [PMC free article] [PubMed] [Google Scholar]
- Ray D, Kazan H, Cook KB, Weirauch MT, Najafabadi HS, Li X, Gueroussov S, Albu M, Zheng H, Yang A, et al. (2013). A compendium of RNA-binding motifs for decoding gene regulation. Nature 499, 172–177. [DOI] [PMC free article] [PubMed] [Google Scholar]
- Reid DW, and Nicchitta CV (2012). Primary role for endoplasmic reticulum-bound ribosomes in cellular translation identified by ribosome profiling. J Biol Chem 287, 5518–5527. [DOI] [PMC free article] [PubMed] [Google Scholar]
- Teixeira D, Sheth U, Valencia-Sanchez MA, Brengues M, and Parker R (2005). Processing bodies require RNA for assembly and contain nontranslating mRNAs. RNA 11, 371–382. [DOI] [PMC free article] [PubMed] [Google Scholar]
- Thomas PD, Campbell MJ, Kejariwal A, Mi H, Karlak B, Daverman R, Diemer K, Muruganujan A, and Narechania A (2003). PANTHER: a library of protein families and subfamilies indexed by function. Genome Res 13, 2129–2141. [DOI] [PMC free article] [PubMed] [Google Scholar]
- Trapnell C, Pachter L, and Salzberg SL (2009). TopHat: discovering splice junctions with RNA-Seq. Bioinformatics 25, 1105–1111. [DOI] [PMC free article] [PubMed] [Google Scholar]
- UniProt C (2015). UniProt: a hub for protein information. Nucleic Acids Res 43, D204–212. [DOI] [PMC free article] [PubMed] [Google Scholar]
- Wang Z, Kayikci M, Briese M, Zarnack K, Luscombe NM, Rot G, Zupan B, Curk T, and Ule J (2010). iCLIP predicts the dual splicing effects of TIA-RNA interactions. PLoS Biol 8, e1000530. [DOI] [PMC free article] [PubMed] [Google Scholar]
- White EK, Moore-Jarrett T, and Ruley HE (2001). PUM2, a novel murine puf protein, and its consensus RNA-binding site. Rna 7, 1855–1866. [PMC free article] [PubMed] [Google Scholar]
- Wolozin B (2012). Regulated protein aggregation: stress granules and neurodegeneration. Molecular neurodegeneration 7, 56. [DOI] [PMC free article] [PubMed] [Google Scholar]
Associated Data
This section collects any data citations, data availability statements, or supplementary materials included in this article.
Supplementary Materials
Table S1. List of transcripts identified from the differential expression analysis (DESeq2) in control and ER stress-treated cells, shown in Figure S3A, related to Figure 3. Column A (id), gene name; column B (delRNA*_in_Cyt), unnormalized ΔCyt*; column C (delRNA*_in_RG), unnormalized ΔRG*; column D (delRNA*_difference), column C - column B.
Table S2. List of transcripts identified from the spike-in normalization and k-means clustering analysis in control and ER stress-treated cells, shown in Figure 4A, related to Figure 4. Column A, gene name; column B (del_Cyt-ER), ΔCyt-ER; column C (%RG), %RG; column D (del_RG-ER), ΔRG-ER; column E (Cluster(ER)), cluster identity assigned by k-means clustering.
Table S3. List of transcripts identified from the spike-in normalization and k-means clustering analysis in control and heat shock (HS)-treated cells, shown in Figure 7A, related to Figure 7. Column A, gene name; column B (del_Cyt-HS), ΔCyt-HS; column C (%RG), %RG; column D (del_RG-HS), ΔRG-HS; column E (Cluster(HS)), cluster identity assigned by k-means clustering.
Table S4. List of transcripts identified from the spike-in normalization and k-means clustering analysis in control and arsenic stress (AS)-treated cells, shown in Figure 7C, related to Figure 7. Column A, gene name; column B (del_Cyt-AS), ΔCyt-AS; column C (%RG), %RG; column D (del_RG-AS), ΔRG-AS; column E (Cluster(AS)), cluster identity assigned by k-means clustering.
Table S5. List of oligonucleotides used in the current work, related to STAR Methods.