

Abstract
Recently, there have been emerging interests in the area of microvesicles and exosome (MV/E) released from brain cells in relation to neurodegenerative diseases. However, only limited studies focused on MV/E released post-traumatic brain injury (TBI) as they highlight on the mechanistic roles of released proteins. This study sought to examine if CSF samples from severe TBI patients contain MV/E with unique protein contents. First, nanoparticle tracking analysis determined MV/E from TBI have a mode of 74-98 nm in diameter, while control CSF MV/E have a mode of 99-104 nm. Also, there are more MV/E were isolated from TBI CSF (27.8 - 33.6 × 10⁸/mL) than from control CSF (13.1 - 18.5 × 10⁸ /mL). Transmission electron microscopy (TEM) visualization also confirmed characteristic MV/E morphology. Using targeted immunoblotting approach, we observed the presence of several known TBI biomarkers such as αII-spectrin breakdown products (BDPs), GFAP and its BDPs and UCH-L1 in higher concentrations in MV/E from TBI CSF than their counterparts from control CSF. Furthermore, we found presynaptic terminal protein synaptophysin and known exosome marker Alix enriched in MV/E from human TBI CSF. In parallel, we conducted nRPLC-tandem mass spectrometry-based proteomic analysis of two control and two TBI CSF samples. 91 proteins were identified with high confidence in MV/E from control CSF, whereas 466 proteins were identified in the counterpart from TBI CSF. MV/E isolated from human CSF contain cytoskeletal proteins, neurite-outgrowth related proteins and synaptic proteins, extracellular matrix proteins and complement protein C1q subcomponent subunit B. Taken together, following severe TBI, the injured human brain released increased number of extracellular microvesicles/exosomes (MV/E) into CSF. These TBI MV/E contain several known TBI biomarkers and previously undescribed brain protein markers. It is also possible that such TBI-specific MV/E might contain cell to cell communication factors related to both cell death signaling a well as neurodegeneration pathways.
Keywords: traumatic brain injury, biomarkers, neuronal injury, glial injury, systems biology, exosome, microvesicles
Introduction
Traumatic Brain injury (TBI) is defined as brain damage due to mechanical force applied to the head. According to the Center of Disease Control and Prevention (CDC), TBI is a leading cause of death and lifelong disability claiming more than 50,000 deaths each year and responsible for about 2.5 million Emergency department visits, hospitalizations or deaths in 2010 in the United States, alone or in conjunction with other injuries [1]. TBI injury mechanism can be divided into two phases. Primary injury is the immediate mechanical impact to the brain tissue that causes loss of cerebral vascular autoregulation, the imbalance in cerebral blood flow and cerebral metabolism. The lack of cerebral oxygen and other ischemia like events post the primary impact leads to mitochondrial dysfunction, accumulation of lactate, intra-mitochondrial Ca2+ and lower ATP production in the cell leading to the failure of maintenance of ATP-dependent ion pumps and slow uptake of glutamate [2]. The main contributor of primary and secondary injury associated TBI-related cell death is the excessive release of excitatory amino acid glutamate into in the synapses post the primary injury [3]. Glutamate over activate the postsynaptic ionotropic glutamate receptors via a calcium overload [4]. One of the immediate effects of increase in intracellular Ca2+ is the activation of cysteine proteases calpain, which can breakdown cytoskeletal proteins such as αII-, βII-spectrin, neurofilament proteins and microtubule associated protein 2 (MAP-2), and glial fibrillary acidic protein (GFAP) [5–8]. Calpain is highly activated in necrotic cell death process but also to a lesser extent activated in apoptosis [8,9]. Apoptosis also was found in post-TBI. It involves the activation of another cysteine caspase that can cause neuronal and oligodendroglia cell death. Interestingly, caspase also attacks various cytoskeletal proteins that are also calpain substrates (αII-, βII-spectrin, GFAP) [6–8].
Currently, TBI is diagnosed using neurological approach - Glasgow Coma scale (GCS) and neuroimaging methods such as CT (computed tomography) scans and MRI (magnetic resonance imaging). These techniques have several limitations. Physicians use pre-hospital GCS score for reference as sedation given to patients during the first 24 hours interferes with accurate GCS measurement. GCS measurement is also impaired by inability to respond to due injury other than TBI and the change in neurological symptoms over time due to evolving property of brain lesions. CT scans have low sensitivity and MRI cannot be used in cases of military injuries where metal fragment injuries could be common in patients. Mild TBI (mTBI) that constitutes of more than 90% of TBI injuries is misleading to gauge using GCS [10]. It is also difficult to assess diffused axonal injury, high neurotransmitter levels and other physiological parameters of mTBI using neuroimaging techniques [11]. Thus, there has been increased effort to study pathophysiological mechanism to develop therapeutics and diagnostics. A number of proteins have been identified as candidate TBI biomarkers such as 8100β, NSE, Spectrin breakdown product, GFAP and its fragment and UCH-L1 [7].
Glial fibrillary acidic protein (GFAP) is a monomeric 50 kDa intermediate filament protein expressed almost exclusively in the astrocytes of the CNS. Glial cells undergo activation and proliferation (gliosis) in response to neuronal injury that activates the release of GFAP upon damage of the astrocyte cytoskeleton. GFAP is highly vulnerable to calpain modification in vivo and in vitro and will likely exist as 42 or 38 kDa GFAP breakdown product (GFAP BDP) [7,12]. GFAP and GFAP BDP were elevated in the CSF and serum of patients with moderate and severe TBI [13,14]. UCH-L1 was identified as a neuronal cell body
αII-spectrin is major cortical cytoskeletal protein present predominantly in the neurons and abundantly in the axons and presynaptic terminals. It is a major substrate for caspase-3 and calpain mediating apoptosis and necrosis death post TBI. Calpain cleaves αII-spectrin giving rise to αII-Spectrin breakdown products (SBDPs) of 150 kDa and 145 kDa while caspase-3 cleavage gives rise to SBDP’s of 150 kDa and 120 kDa [8]. Studies in human CSF showed higher level of SBDPs in TBI patients and indicated higher involvement of calpain-mediated necrosis as compared to caspase-3 mediated apoptosis. The concentration of SBDP145 in the CSF collected within the first 24 h after injury of TBI patients, correlated with GCS score while there was no such correlation for SBDP120 indicating the potential of SBDP to determine injury intensity and caspase/calpain mechanism in the critical period. Temporal profile of SBDPs can be used to ascertain these diffuse injury patterns that are not detected accurately in CT [15,16].
In addition to freely soluble proteins in circulating biofluids (e.g. CSF, blood) that could serve as disease biomarkers, recently there is emerging interests of microvesicles (MV) that are released from cells. These vesicles may be of endocytic origin called exosomes or directly bud from the plasma membrane called microvesicles. These MV potentially can contain protein and miRNA as possible as a source of biomarkers. In fact, the release of vesicles by healthy cells into the extracellular environment has now been considered to be a method of cell-to-cell communication. Exosomes are formed by the invagination of the limiting membrane of the late endosome into the lumen and released by the fusing of the multivesicular endosomes with the plasma membrane [17]. Exosomes and microvesicles have been found to be involved in horizontal transfer of mRNA’s, miRNA’s, cytosolic and membrane proteins, selectively in some cases, affecting expression patterns of the target cell. They have also been proven to play a role in the pathogenic state such as inflammation, tumor progression and metastasis. Most studies refer only to exosomes due to ease of identification based on the protein content. Current isolation protocols make it difficult to distinguish between the two but many cell types are capable of releasing both exosomes and microvesicles at the same time [18].
Exosomes have also been implicated to many neurodegenerative diseases such as Parkinson’s, prion and Alzheimer’s disease and shown to carry protein aggregates of alpha synuclein, Prion protein, Amyloid precursor protein and phosphorylated tau respectively. Scrapie form of Prion protein is capable of causing infection when released from the exosome. Studies have also indicated the role of exosomes/MV in neuron glial communication and increase in release of exosomes/microvesicles in response to increase in Ca2+ [19]. Recently, we published a study showing that pro-apoptotic and pro-necrotic challenges to mouse neuroblastoma N2a cells and rat primary cerebrocortical mixture cultures induced increased release of microvesicles/exosomes (MV/E) [20]. We further showed that such MV/E contain unique neural/glial proteins in their intact and proteolytically modified forms [20].
There are only limited studies on exosomes and microvesicles release in TBI that largely focus on role of the miRNA in response to injury and its use in the diagnosis of TBI [21,22]. The goal of this study is to more systemically characterize the potential release of microvesicles and exosomes (MV/E) into CSF during the acute phase of severe TBI. We also seek to examine the protein content of MV/E by targeted biomarker protein analysis and proteomic methods.
Methods
Human CSF collection
The control CSF samples (n=6 in 1 ml aliquots) (collected by lumbar puncture) were purchased from Bioreclamation (Westbury, NY, USA). CSF samples form TBI patients were archived samples form Baylor College [23]. Patients with severe blunt head trauma (TBI) with Glasgow coma scale <8, present at the Emergency Department of Ben Taub General Hospital, Baylor College of Medicine, (Houston, Texas) were asked for consent and CSF was collected. Samples were collected for up to ten days or until an intraventriculostomy (IVC) was no longer required clinically. CSF was sampled from the buretrol of the CSF drainage system with a total collection time not exceeding 1 hour were diverted to 15-mL conical polypropylene centrifuge tubes (BD Falcon, San Jose, CA, USA). 12 h post-injury CSF samples from the first 18 subjects with 12 h CSF samples collected (with no EPO treatment) were used for this analysis. To remove loose cells and debris, the CSF samples were centrifuged using a tabletop centrifuge (4000 x g) for 5-7 minutes at room temperature. One mL aliquots of the debris free CSF (supernatant) were pipetted into 2 mL cryogenic tubes, snap frozen and stored at −80°C. The study protocol was approved by the Baylor College of Medicine IRB and the procedures were carried out according to the standard operating procedure of the hospital by a qualified and trained hospital employee. For this study, timed CSF samples (1 mL) collected at 12 h from injury were used. This was followed by isolation of Micro vesicles/Exosomes from CSF samples. Demographics of TBI patient and control subjects are shown in Supplementary Table 1.
Isolation of MV/Exosomes
Our MV/exosome preparation is modified from previously published methods [20]. 1 ml of human CSF from normal controls (n=6) and from TBI subjects at 12 h (n=18) was collected in separate tubes and centrifuged at 4000 x g at 4 °C for 5 min to remove debris (pellet1) and the supernatant (Sp1) was transferred to ultracentrifuge tubes (Beckman Coulter, Pasadena, CA, USA) and ultracentrifuged (SW 55 Ti rotor) at 100,000 x g for 70min. Supernatant (Sp2) was carefully collected after first Ultracentrifugation and concentrated using Amicon Ultra centrifugal filters (Millipore, Billerica, MA, USA). The resultant Pellet (pellet2) is the crude exosome fraction, which was re-suspended and washed with 3 ml dilute phosphate buffered saline (PBS) and then ultracentrifuged again at 100,000 x g for 70min. The supernatant was discarded and the pellet portion (pellet4) is the MV/exosome-enriched fraction, which was first re-suspended and dissolved using100 μl (or minimum) PBS and further diluted with PBS (to 1 mL). The samples were then sonicated (for 30 seconds 3 times), filtered through syringe filter (with a pore size of 0.45 μm) and the filtrate concentrated to 100 μl using Amicon Ultra centrifugal filters (Millipore, Billerica, MA, USA). This concentrated filtrate is the final MV/exosome preparation used for the stated MV/exosome characterization studies and analysis (Figure 1).
Figure 1.

Human CSF microvesicles/exosome (MV/E) isolation protocol.
Nanoparticle Tracking Analysis
Nanosight NS300 (Malvern Instruments, Worcestershire, UK) (at University of Florida ICBR) utilizes Nanoparticle Tracking Analysis (NTA) method to characterize nanoparticles from 10 nm −2000 nm in solution. Each particle is individually analyzed by direct observation and measurement of diffusion events. This particle-by-particle methodology produces high resolution results for particle size distribution and concentration. Both particle size distribution and concentration are measured, for microvesicles and exosomes for this study.
Electron Microscopy
The isolated microvesicles and exosomes were added using 4% paraformaldehyde (1:1) to allow fixing in a 2% paraformaldehyde suspension. The formvar-carbon coated grids are dipped in the sample suspension for 20 minutes at room temperature followed by a PBS wash and fixing in 1% glutaraldehyde. After the water washes, the formvar-coated grids were stained in aqueous uranyl oxalate (pH 7) for 5 minutes and embedded in uranyl acetate: methylcellulose (1: 9) on ice for 10 minutes. The grids were removed one at time with a stainless-steel loop and excess fluid was blotted out using Whatman number 1 paper. The grids were air dried and viewed under an electron microscope.
Immunoblotting Analysis
For normalization, we have added equal MV/E (3 ×10⁸ MV/E particles / well) in each lane immunblotting analysis. Since MV/E from different conditions (TBI vs. control) can have very different components and have different amount of house-keeping proteins (e.g. beta-actin) released into MV/E, thus these blots are not normalized by beta-actin. Briefly Twenty-one (21) μl of concentrated MV/exosome in PBS was mixed with 3 μl of 2x Laemmli sample buffer containing 65.8 mM Tris (pH 6.8), 0.1 mM DTT, 2% SDS, 0.01% bromophenol blue and 10% glycerol in distilled water. Proteins were resolved by SDS-PAGE at 200 V for 60 minutes at room temperature, using 4-20% or 10-20% 1mm Tris-glycine gels (Invitrogen Life Technologies, Carlsbad, CA, USA). The fractionated proteins were then transferred to polyvinylidene fluoride (PVDF) membranes using iBlot Gel transfer device at V for 12 minutes (Invitrogen, Carlsbad, CA, USA). The membrane containing proteins was blocked in 5% non-fat dry milk in 20 mM Tris-HCl, 150 mM NaCl and 0.003% Tween-20, pH 7.5 (TBST) for 60 minutes. After blocking, the membrane was incubated with primary antibody in 5% TBST overnight at 4 °C. The antibodies used were monoclonal anti-mouse α-II spectrin (Enzo Life Sciences Farmingdale, NY, USA), monoclonal anti-mouse GFAP (Pharmingen, San Diego, CA, USA), monoclonal anti-mouse β-III Tubulin (Promega, Madison, WI USA), polyclonal anti-rabbit synaptophysin (Zymed, San Francisco, CA, USA) at 1:1000 dilution, monoclonal anti-AIP1 (BD Transduction San Jose CA, USA) and monoclonal anti- mouse UCHL-1 (EMD Millipore, Billerica, MA, USA) at 1: 700 dilution. The membranes were washed thrice with TBST for 5 minutes each time. This was followed by 1 hour incubation with secondary antibody in 5% non-fat milk in TBST followed by washing. Immunoreactive bands were detected by developing with 5-bromo-4-chloro-3-indolylphosphate (BCIP)/nitroblue tetrazolium phosphatase substrate (Kirkegaard & Perry Laboratories, Gaithersburg, MD, USA). Quantitative evaluation of protein levels was performed via computer-assisted densitometric scanning (NIH ImageJ, version 1.6 software) similar[24] to our previously published method. All the immunoblots (4 control samples and 19 TBI samples) are quantitatively evaluated using densitometric scanning using NIH image J (version 1.6). The values on graph are mean ± SEM values. Statistical significance was determined using student t-test test, with a significance level of p <0.01 (**).
CSF MV/E sample In-gel digestion using trypsin for mass spectrometry proteomics
The SDS-PAGE gel with resolved MV/E proteins was stained using Coomassie blue (Biorad) till all the bands are clearly visible and it was scanned using Epson 36 Expression 8836XL high-resolution flatbed scanner (Epson). Each sample lane was cut from top to bottom while taking a note of the corresponding molecular weight and transferred to low retention Eppendorf tubes. The gel pieces were washed in 100-μl LC-MS grade water two times and then in 100 mM ammonium bicarbonate and acetonitrile (1:1) till the gel bands turned colorless. This was followed by dehydration with 20 μl of LC-MS grade 100% acetonitrile and drying using a speedvac (Labcoco). Samples were then reduced by addition of 50 μl of 10 mM dithiothreitol, DTT (Thermo) in 50 mM ammonium bicarbonate and incubated for 30 min at 56 °C subsequently replacing it with 50 μl of 55 mM iodoacetamide (Amersham Biosciences) in 50 mM ammonium bicarbonate and transferred for 30 min in the dark at room temperature for alkylation. Gel pieces are then washed with 50 mM ammonium bicarbonate thrice, dehydrated with 100% acetonitrile and dried using the speedvac. Protein digestion was carried by the addition of 12.5-ng/μL of trypsin solution (Promega gold) for 30 min at 4°C and addition of 20 μL of 50 mM of ammonium carbonate before incubating overnight at 37 °C. This was centrifuged at 1500 x g for 15 min and the supernatant was transferred to fresh tubes. Further peptide extraction was carried out by the addition of acetonitrile and water with 0.1% formic acid (1:1), shaking the tubes for 20-30 minutes and centrifuging at 1500 x g for 15 minutes. The supernatant is transferred in to fresh tubes and this process is repeated two times. Acetonitrile in 0.1% formic acid is added to the gel pieces, the third time to take all the soluble peptides. The collected supernatant was dried using the Speedvac, resuspended in water in 0.1 % formic acid, sonicated for 15 minutes, centrifuged and carefully transferred without touching the bottom. Trypsinized band extracts were analyzed by reversed-phase liquid chromatography and nanospray tandem mass spectrometry as described previously.
Reversed-Phase Liquid Chromatography Tandem Mass Spectrometry (RPLC-MS/MS)
Nano-reversed-phase liquid chromatography tandem mass spectrometry was employed for protein separation and identification, based on established method [24]. Nanoflow was performed on a NanoAcquity UPLC (Waters, Milford, MA, USA); the autosampler was used to load 2 μL onto a nanoACQUITY UPLC symmetry C18 trap column, 100 Å, 5 μm, 180 μm × 20 mm at 4 μL/min for 10 min. Then, the sample plug was loaded onto a 1.7 μM particle size BEH130 C18 100 μm × 100 mm analytical column at 300 nL/min. The mobile phase consisted of solvent A (water with 0.1% formic acid) and solvent B (acetonitrile with 0.1% formic acid). Separation was achieved within a run time of 115 min at a flow rate of 300 nL/min. The first linear gradient was from 1% to 40% B over 90 min; the second linear gradient was from 40% to 100% B over 5 min and held for 5 min before returning to initial mobile-phase composition (1%B). Tandem mass spectra were collected on LTQ-XL (Thermo, San Jose, CA, USA) using a Data Dependent Acquisition (DDA) method in Xcalibur 2.0.7 (Thermo), in which data dependent scanning was specified as a criterion to select the top 10 most abundant ions using 11 separate scan events at a given chromatographic time point (115 min) for subsequent analysis. The mass spectrometer was set to perform a full-scan and subsequently MS/MS scans on the ten most intense ions in the full-scan spectrum MS (scan event 1) with dynamic exclusion enabled. Dynamic exclusion temporarily puts a mass into an exclusion list after its MS/MS spectrum is acquired, providing the opportunity to collect MS/MS information on the second most intense ion from the full-scan spectrum MS (scan event 1). All MS/MS spectra were analyzed using Proteome Discoverer 1.3 (Thermo). SEQUEST (version: 1.3.0.339) and X! Tandem (version: CYCLONE (2010.12.01.1)). Database search engines were set up to search a trypsin-indexed uniprot-Homo+sapiens.fasta . The search was achieved using the average mass for matching the precursor with a fragment ion mass tolerance of 0.8 Da and a parent ion tolerance of 2.00 Da. Carbamidomethylation of cysteine was selected as a static modification, while the oxidation of methionine was selected as a dynamic modification. Using the output from SEQUEST and X! Tandem, Scaffold (version: Scaffold_3.3.3, Proteome Software) was used to validate, organize, and interpret mass spectrometry data. Peptide identifications were accepted if they could be established at greater than 95.0% probability as specified by the Peptide Prophet algorithm [25]. Protein identifications were accepted if they could be established at greater than 99.9% probability and contained at least 2 identified unique peptides.
Biological Pathways, Systems Biology Analysis and Statistical Testing
The Elsevier’s Pathway Studio version 10.0 (Ariadne Genomics/Elsevier) was used to analyze relationships and functional correlations among differentially expressed proteomics protein candidates using the Ariadne ResNet database. Data sets containing protein identifiers (Gene ID) and corresponding expression values (Log2 as Fold change) were uploaded.
Each protein identifier was mapped to its corresponding protein object in the Pathway studio Resnet database. Pathway Studio utilizes a built-in resource ResNet database, which extracts molecular interactions based on natural language processing of scientific abstracts in PubMed. For pathways data extraction, the data analysis was performed using two approaches; a global analysis assessing global approach describing altered pathways implicated in the TBI-CSF MV/E. Similarly, a targeted approach was utilized to evaluate differential protein-based molecular functions and biological processes uniquely present in the MV/E from TBI CSF using the "Subnetwork Enrichment Analysis" (SNEA) algorithm. SNEA was selected to extract statistically significant altered biological and functional pathways pertaining to each set of protein hits present in the TBI CSF-MV/E which were compared to their control counterpart. SNEAutilizes Fisher's statistical test used to determine if there are nonrandom associations between two categorical variables organized by specific relationship. For the comparative analysis of the altered targeted molecular functions and biological processes “InteractiVenn” software: a web-based tool for the analysis of comlex data sets. See Tables 1, 2 and 3 as supplementary data for the listed differential pathways.
Western Blotting statistical analysis
Densitometric values represent the mean ± SEM. Statistical significance was determined using unpaired t-test and the protein markers with a significance level of p<0.01 as compared to the controls are marked with ** and p<0.05 as compared to the controls are marked with *.
RESULTS
Human TBI and control Cerebrospinal fluid (CSF)-Derived MV/Exosome Characterization and Analysis
Human CSF samples (N=19) were collected at 12 h post-injury from severe blunt trauma patients with emergency room Glasgow coma scale (GCS) ≤ 12 at the Emergency Department of Ben Taub General Hospital, Baylor College of Medicine, (Houston, Texas). Control CSF samples were purchased from Bioreclamation Inc. (n=6). Supplementary Table 1 shows subject demographics and TBI clinical assessment. The age of TBI subjects (ave. 32.8 yr) and control subjects (ave. 31.7 yr) are not significantly different.
Microvesicles/Exosomes (MV/E) were isolated from these human CSF samples or Dynamic Light Scattering and mass spectrometry analysis, 3 mL of pooled samples (pooled evenly from three control or TBI subjects) were used. For Western blot analysis, individual non-pooled CSF MV/E samples were analyzed. Our MV/E isolation protocol for human CSF samples is based on (i) clearance of heavy particles by regular high speed centrifugation (4,000 x g for 5 min), (ii) ultracentrifugation to collect the pelleted crude MV/E enriched fraction and (iii) subsequent microfiltration with syringe filter (0.45 μm). The final filtrate containing the MV/E are concentrated by centrifuged based ultrafiltration for analysis (Figure 1). We found that this method produces reproducible and size-consistent MV/E preparations.
Nanoparticle Tracking Analysis (NTA)
Nanoparticle Tracking Analysis was performed to analyze the size distribution and concentration of microvesicles and exosome preparations in human CSF from healthy controls and TBI patients (n=2 each). NTA allows direct real time visualization of freshly isolated microvesicles and exosomes and the average sizing of these particles is determined based on its Brownian motion in suspension. A high-resolution camera is used to take video and each particle in the frame is tracked by the software and size distribution and concentration data are generated. An example of TBI MV/E sample is shown in Figure 2A. MV/E from both TBI have a mode of 74-98 nm in diameter, while control CSF MV/E have a mode of 99-104 nm. Also, there are more MV/E released from TBI (27.8 - 33.6 × 10⁸) than from control CSF (13.1 - 18.5 × 10⁸) (Figure 2B).
Figure 2.
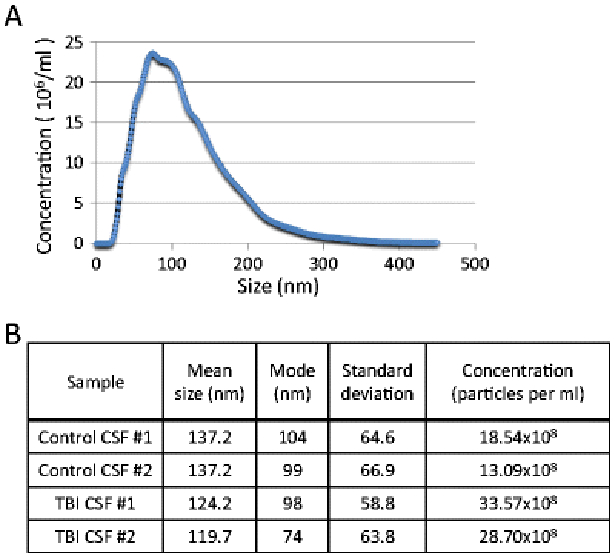
Microvesicles/exosome sizing analysis with dynamic light scattering (DLS). (A) representative size distribution of a MV/E sample from TBI CSF. (B) Summary of size and concentration results of MV/E from 2 control and 2 TBI CSF samples.
Transmission electron microscopy (TEM)
TEM was performed using uranyl acetate as the negative stain. PBS was used as the negative control shown in Figure 3. Spherical or cup-shaped structures with the majority of particles less than 200 nm in diameter were observed in the MV/exosomes isolated from the CSF of healthy controls and TBI patients. (Figure 3).
Figure 3.

Electron micrograph (EM) images showing microvesicles/exosomes isolated from either control CSF or from human TBI CSF. PBS buffer only was included as negative control. Scale bar was as indicated (500 nm), while yellow arrows indicate MV/E.
Characterization of protein biomarker content in CSF-derived MV/E post-TBI as compared to control
The presence of selected candidate TBI diagnostic protein biomarkers from neuronal cells such as αII-Spectrin BDP, UCH-L1, synaptic marker synaptophysin, glial cell protein GFAP and exosome maker Alix were studied in the microvesicles and exosomes fractions by immunoblotting of lysed MV/E fractions (5 control samples and 19 TBI samples).
We first examined if MV/E isolated from CSF samples, especially those from human TBI patients within first 6-18 hours, contain signature proteolytic markers - neuronal/axonal injury markers (αII-Spectrin and its breakdown products (SBDP) and glial marker glial fibrillary acidic protein (GFAP) and its major BDP (38 kDa). Immunoblots for αII-Spectrin (and its breakdown products (SBDPs) showed negligible levels in MV/E fraction from control CSF but the presence of intact αII-Spectrin band and intense bands of SBDP of 145-150 kDa and lesser intense breakdown to SBDP of 120 kDa (Figure 4A). SBDP150-145 are known to be generated by calpain digestion during mainly necrotic neuronal cell injury. On the other hand, SBDP120 is known to be a product of caspase-3 proteolysis during neuronal apoptosis [8]. Densitometric quantification shows that αII-Spectrin, SBDP150/145 and SBDP120 were all significantly higher in the MV/E fractions from TBI CSF over their control CSF counterpart (Figure 4A).
Figure 4.
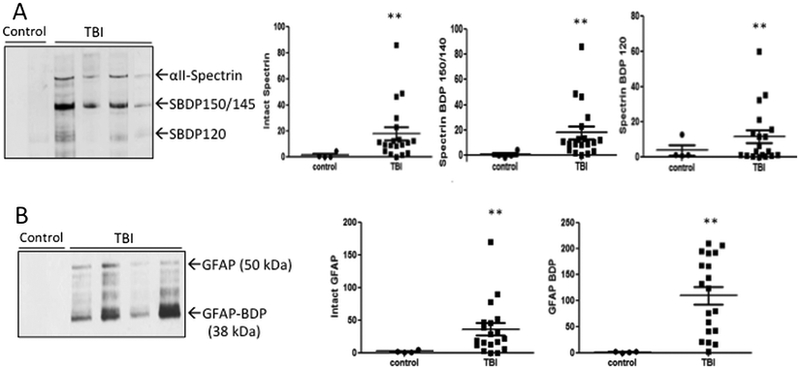
Presence of neuronal and glial proteolytic biomarkers αII-Spectrin and its breakdown products (SBDPs) and GFAP and its BDP in MV/E samples isolated from control and TBI CSF. (A) Immunoblots images showing the presence of these markers in TBI CSF isolated MV/E. (B) quantification of levels of these protein markers in MV/E preparations isolated from TBI vs. control CSF. **p < 0.01 (statistical significant). For standardization, each lane was loaded with protein from 3 ×10⁸ MV/E particles. Sample size: control n=4, TB, n= 19.
Immunoblotting with anti-GFAP antibody indicated the minimal presence of GFAP in MV/E from Control CSF samples but robustly stronger bands of intact GFAP (50 kDa) and even more intense breakdown product (GFAP-BDP, 38 kDa) in MV/E fraction from CSF of TBI patients (Figure 4B). Densitometric quantification shows that levels of both intact GFAP and GFAP-BDP were significantly higher in the MV/E fractions from TBI CSF over their control CSF counterpart (Figure 4B).
Next, we examined if neuronal cell body biomarker ubiquitin C-terminal hydrolase-L1 (UCH-L1) and pre-synaptic marker Synaptophysin are detectable in these MV/E preparations. In fact, we detected the presence of intact UCH-L1 (24 kDa) without breakdown products in MV/E isolated from human TBI CSF, but minimal detection in MV/E from control CSF. In addition, our study also includes a synaptic marker - synaptophysin, a synaptic vesicle glycoprotein that contributes to effective endocytosis of the synaptic vesicles. Synaptophysin immunoblots showed minimal levels of this protein in MV/E from control CSF but intense band signals (38 kDa) without breakdown in MV/E preparations from acute CSF of TBI patients (Figure 5A).
Figure 5.
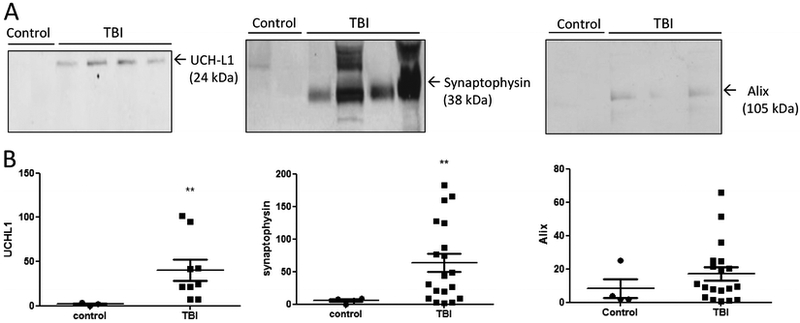
Presence of neural marker UCH-L1, synaptic marker synaptophysin and exosome maker Alix in MV/E samples isolated from control and TBI CSF. (A) Immunoblots images showing the presence of these markers in TBI and control CSF isolated MV/E. (B) Quantification of levels of these protein markers in MV/E preparations isolated from TBI vs. control CSF. ** p < 0.01 (statistical significant). For standardization, each lane was loaded with protein from 3 ×10⁸ MV/E particles. Sample size: control n=4, TB, n= 19.
In addition, we examined if the microvesicles isolated from human CSF also include secreted exosomes as a subset. We probed the MV/E preparations by immunoblot using antibody to Alix, an exosomal marker. We could in fact detect the presence of Alix protein in MV/E from TBI CSF and to a lesser extent, MV/E from control CSF. This confirms that our human CSF MV/E preparations include exosomes (Figure 5A). Quantifications of all markers further show statistically significant increases of the above-stated proteins in MV/E from human TBI CSF versus those from control CSF, with the exception of Alix (Figure 5B).
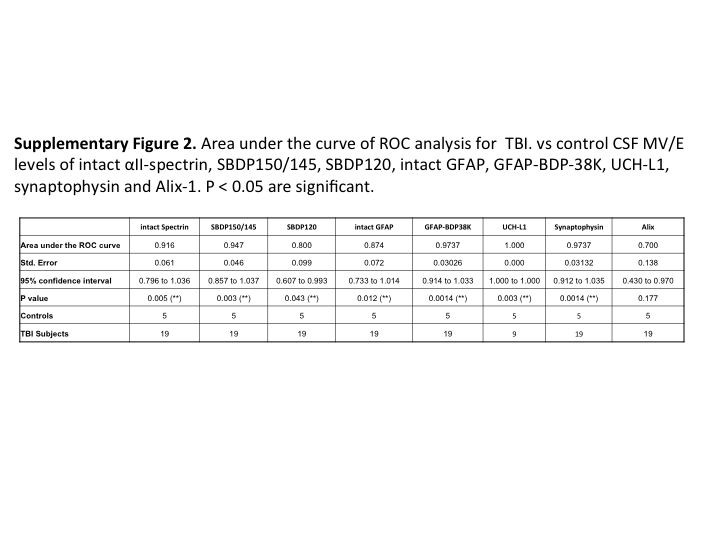
To assess the TBI-diagnostic properties of the human CSF MV/E levels of intact αII-spectrin, SBDP150/145, SBDP120, intact GFAP, GFAP-BDP-38K, UCH-L1, synaptophysin and Alix-1, receive operating characteristic (ROC) curves were generated (Suppl. Figure 1). The area-under-the-curve (AUC) for each plot was also calculated and p value determined. We found that with the exception of Alix, all other CSF MVE markers achieved statistical significant (p ≤ 0.05) in distinguishing TBI from controls (Suppl. Figure 2).
Mass spectrometry-based proteomic analysis of TBI-release MV/E
In an attempt to identify additional proteins that might be presence in MV/E isolated form control and TBI CSF samples, we turned to Mass spectrometry-based proteomic identification of proteins for its sensitivity and unbiased approach. Two pooled control and three pooled TBI MV/E samples were concentrated and loaded onto a 4-20% SDS-PAGE gel to resolve proteins by molecular weight (run alongside molecular weight markers). After staining with Coomassie blue staining, the protein bands were cut from each lane from top to bottom (high to low M.W.) as the following segments (> 225 kDa, 225-195 kDa, 195-120 kDa, 120-93 kDa, 93-70 kDa, 70-50 kDa, 50-38 kDa, 38-32 kDa, 32-28 kDa, 23-18 kDa, 18-15 kDa and 15-5 kDa).
Based on the criteria of having a minimum of 2 unique peptides per protein identified by MS/MS, 91 proteins were identified in MV/E from control CSF, whereas 466 proteins were identified in the counterpart from TBI CSF (Table 1, 2). The full list of proteins identified in control and TBI CSF were listed in Supplementary Table 2 and Table 3.
Table 1.
Selected proteins identified by MS/MS in MV/E isolated from human control CSF samples (from total of 92 proteins)
| Accession | Description | MW [kDa] |
# Unique Peptides |
Score | Coverage | # Proteins |
# Peptides |
# PSMs | # AAs | calc. pI |
|---|---|---|---|---|---|---|---|---|---|---|
| > 225kDa | ||||||||||
| Q9Y6V0-5 | Isoform 5 of Protein Piccolo | 560.4 | 4 | 0 | 3.77% | 4 | 32 | 51 | 5142 | 6.47 |
| Q8WZ42-12 | Isoform 12 of Titin | 3992.1 | 4 | 0 | 5.06% | 18 | 181 | 445 | 35991 | 6.39 |
| Q8WZ42-2 | Isoform 2 of Titin | 3803.3 | 2 | 0 | 5.05% | 24 | 186 | 427 | 34258 | 6.34 |
| Q8WXX0 | Dynein heavy chain 7, axonemal | 460.9 | 2 | 0 | 2.76% | 1 | 22 | 41 | 4024 | 6 |
| Q8NF91-2 | Isoform 2 of Nesprin-1 | 380.1 | 2 | 1.69 | 3.46% | 1 | 14 | 22 | 3321 | 5.22 |
| P13611-5 | Isoform Vint of Versican core protein | 369.5 | 2 | 0 | 2.40% | 5 | 10 | 58 | 3370 | 4.5 |
| O75923-9 | Isoform 9 of Dysferlin | 235.8 | 2 | 0 | 5.32% | 15 | 15 | 20 | 2067 | 5.82 |
| Q96JI7-3 | Isoform 3 of Spatacsin | 266.5 | 2 | 3.12 | 2.06% | 3 | 7 | 9 | 2330 | 6.01 |
| 225-195 kDa | ||||||||||
| O00533 | Neural cell adhesion molecule L1-like protein | 135 | 4 | 7.2 | 8.44% | 2 | 13 | 27 | 1208 | 5.76 |
| 195-120 kDa | ||||||||||
| Q92954-6 | Isoform F of Proteoglycan 4 | 146.4 | 2 | 0 | 5.29% | 6 | 9 | 18 | 1361 | 9.47 |
| Q9NZV1 | Cysteine-rich motor neuron 1 protein | 113.7 | 2 | 1.74 | 1.74% | 1 | 3 | 3 | 1036 | 5.21 |
| 120-93 kDa | ||||||||||
| O75326-2 | Isoform 2 of Semaphorin-7A | 73.3 | 2 | 0 | 5.52% | 2 | 5 | 8 | 652 | 7.42 |
| 93-70 kDa | ||||||||||
| P23142-4 | Isoform C of Fibulin-1 | 74.4 | 3 | 2.44 | 4.10% | 4 | 3 | 3 | 683 | 5.24 |
| A0FGR8-2 | Isoform 2 of synaptotagmin-2 | 98.8 | 2 | 0 | 6.83% | 1 | 6 | 47 | 893 | 8.68 |
| 70-50 kDa | ||||||||||
| P10909-4 | Isoform 4 of Clusterin | 48.8 | 5 | 8.58 | 13.94% | 5 | 7 | 7 | 416 | 6.71 |
| Q96JE9 | Microtubule-associated protein 6 | 86.5 | 3 | 0 | 5.90% | 1 | 4 | 4 | 813 | 9.16 |
| P10809 | 60 kDa heat shock protein, mitochondrial | 61 | 2 | 8.77 | 9.42% | 1 | 7 | 21 | 573 | 5.87 |
| 50-38 kDa | ||||||||||
| P02649 | Apolipoprotein E | 36.1 | 3 | 8.52 | 14.51% | 1 | 5 | 6 | 317 | 5.73 |
| 38-32 kDa | ||||||||||
| Q96DB2-2 | Isoform 2 of Histone deacetylase 11 | 33.1 | 2 | 0 | 11.49% | 2 | 2 | 2 | 296 | 7.61 |
| 32-5 kDa | ||||||||||
| P02747 | Complement C1q subcomponent subunit C | 25.8 | 2 | 0 | 13.48% | 1 | 4 | 9 | 267 | 5.76 |
PSM = total number of identified peptide spectra matched for the protein.
Table 2.
Selected proteins identified by MS/MS in MV/E isolated from human TBI CSF samples (from a total of 466 proteins).
| Accession | Description | MW [kDa] |
# Unique Peptides |
Score | Coverage | # Proteins |
# Peptides |
# PSMs |
# AAs | calc. pI |
|---|---|---|---|---|---|---|---|---|---|---|
| >225 kDa | ||||||||||
| Q8WZ42-12 | Isoform 12 of Titin | 3992.1 | 15 | 0 | 4.80% | 12 | 177 | 471 | 35991 | 6.39 |
| Q9UPN3 | Microtubule-actin cross-linking factor 1, isoforms 1/2/3/5 | 837.8 | 7 | 1.89 | 3.53% | 7 | 40 | 76 | 7388 | 5.39 |
| Q00975-2 | Isoform Alpha-1B-2 of Voltage-dependent N-type calcium channel subunit alpha-1B | 251.6 | 4 | 0 | 4.16% | 5 | 18 | 82 | 2237 | 8.48 |
| Q8TE73 | Dynein heavy chain 5, axonemal | 528.7 | 4 | 0 | 3.14% | 1 | 18 | 41 | 4624 | 6.1 |
| Q8WXH0-2 | Isoform 2 of Nesprin-2 | 798.4 | 4 | 0 | 2.64% | 3 | 26 | 34 | 6907 | 5.36 |
| Q9NR99 | Matrix-remodeling-associated protein 5 | 312 | 4 | 0 | 4.31% | 1 | 17 | 25 | 2828 | 8.32 |
| Q01668-2 | Voltage-dependent L-type calcium channel subunit alpha-1D | 247.4 | 3 | 1.61 | 4.36% | 4 | 15 | 19 | 2181 | 6.98 |
| Q14204 | Cytoplasmic dynein 1 heavy chain 1 | 532.1 | 3 | 0 | 3.55% | 1 | 22 | 69 | 4646 | 6.4 |
| Q5T5U3 | Rho GTPase-activating protein 21 | 217.2 | 3 | 1.99 | 3.17% | 2 | 10 | 14 | 1957 | 7.8 |
| Q8NF91 | Nesprin-1 | 1010.5 | 3 | 3.02 | 3.66% | 3 | 41 | 65 | 8797 | 5.53 |
| O00555-7 | Isoform 7 of Voltage-dependent P/Q-type calcium channel subunit alpha-1A | 254.2 | 2 | 0 | 5.80% | 8 | 13 | 13 | 2240 | 8.35 |
| Q03164-2 | Isoform 2 of Histone-lysine N-methyltransferase 2A | 427.5 | 2 | 0 | 5.95% | 3 | 34 | 63 | 3931 | 9.14 |
| Q8NEV8-2 | Isoform 2 of Exophilin-5 | 221.6 | 2 | 0 | 5.50% | 2 | 17 | 19 | 1982 | 7.87 |
| Q8WXX0 | Dynein heavy chain 7, axonemal | 460.9 | 2 | 1.88 | 3.31% | 1 | 22 | 30 | 4024 | 6 |
| Q8WZ42-6 | Isoform 6 of Titin | 631.2 | 2 | 0 | 4.10% | 1 | 30 | 40 | 5604 | 5.73 |
| Q92614-3 | Isoform 3 of Unconventional myosin-XVIIIa | 226.5 | 2 | 0 | 4.10% | 5 | 10 | 33 | 2002 | 6.2 |
| Q92736 | Ryanodine receptor 2 | 564.2 | 2 | 3.4 | 3.72% | 2 | 27 | 62 | 4967 | 6.07 |
| Q96JI7-3 | Isoform 3 of Spatacsin | 266.5 | 2 | 3.91 | 2.75% | 3 | 6 | 6 | 2330 | 6.01 |
| Q9NYC9-2 | Isoform 2 of Dynein heavy chain 9, axonemal | 503 | 2 | 1.63 | 1.86% | 2 | 14 | 77 | 4410 | 5.91 |
| Q9NZR2 | Low-density lipoprotein receptor-related protein 1B | 515.2 | 2 | 1.81 | 2.52% | 1 | 19 | 28 | 4599 | 5.3 |
| Q9UKL3 | CASP8-associated protein 2 | 222.5 | 2 | 0 | 4.19% | 1 | 14 | 17 | 1982 | 6.58 |
| Q9ULT8 | E3 ubiquitin-protein ligase HECTD1 | 289.2 | 2 | 1.71 | 3.56% | 1 | 16 | 43 | 2610 | 5.35 |
| Q9Y6V0-5 | Isoform 5 of Protein piccolo | 560.4 | 2 | 0 | 4.94% | 3 | 30 | 57 | 5142 | 6.47 |
| 225-195 kDa | ||||||||||
| Q92736 | Ryanodine receptor 2 | 564.2 | 6 | 0 | 2.70% | 4 | 19 | 56 | 4967 | 6.07 |
| P11137-3 | Isoform 3 of Microtubule-associated protein 2 | 199 | 3 | 0 | 8.12% | 4 | 21 | 36 | 1823 | 4.91 |
| Q01082 | Spectrin beta chain, non-erythrocytic 1 | 274.4 | 3 | 0 | 3.89% | 3 | 9 | 12 | 2364 | 5.57 |
| Q7Z5J4-2 | Isoform 2 of Retinoic acid-induced protein 1 | 198.3 | 3 | 0 | 6.12% | 3 | 16 | 37 | 1862 | 8.9 |
| P53804 | E3 ubiquitin-protein ligase TTC3 | 229.7 | 2 | 1.78 | 4.64% | 12 | 13 | 16 | 2025 | 7.52 |
| Q9P2D3-3 | Isoform 3 of HEAT repeat-containing protein 5B (HEATR5B) | 214.9 | 2 | 0 | 5.40% | 2 | 10 | 14 | 1982 | 7.42 |
| 195-120 kDa | ||||||||||
| P33527 | Multidrug resistance-associated protein 1 | 171.5 | 3 | 0 | 7.38% | 3 | 14 | 23 | 1531 | 7.11 |
| Q16478 | Glutamate receptor ionotropic, kainate 5 | 109.2 | 3 | 0 | 7.24% | 1 | 7 | 12 | 980 | 8.21 |
| Q70CQ4 | Ubiquitin carboxyl-terminal hydrolase 31 | 146.6 | 3 | 0 | 11.17% | 2 | 17 | 17 | 1352 | 9.22 |
| Q9UQ35-2 | Isoform 2 of Serine/arginine repetitive matrix protein 2 | 256.5 | 3 | 0 | 8.87% | 2 | 29 | 88 | 2334 | 12.02 |
| P26358 | DNA (cytosine-5)-methyltransferase 1 | 183 | 2 | 0 | 8.04% | 3 | 18 | 63 | 1616 | 7.75 |
| Q8NFA0 | Ubiquitin carboxyl-terminal hydrolase 32 | 181.5 | 2 | 0 | 8.29% | 1 | 14 | 42 | 1604 | 6.44 |
| Q92954-2 | Isoform B of Proteoglycan 4 | 146.4 | 2 | 0 | 9.68% | 5 | 10 | 16 | 1363 | 9.61 |
| Q96QU1 | Protocadherin-15 | 215.9 | 2 | 1.7 | 3.38% | 5 | 8 | 8 | 1955 | 5.07 |
| Q9UBN7 | Histone deacetylase 6 | 131.3 | 2 | 1.78 | 1.98% | 2 | 6 | 10 | 1215 | 5.3 |
| 120-93 kDa | ||||||||||
| 000533-2 | Isoform 2 of Neural cell adhesion molecule L1-like protein | 136.6 | 3 | 1.88 | 10.95% | 2 | 17 | 27 | 1224 | 5.8 |
| P08473 | Neprilysin | 85.5 | 3 | 0 | 6.67% | 1 | 6 | 6 | 750 | 5.73 |
| Q9UDY2 | Tight junction protein ZO-2 | 133.9 | 3 | 0 | 6.72% | 4 | 11 | 17 | 1190 | 7.4 |
| O14594 | Neurocan core protein | 143 | 2 | 0 | 3.48% | 1 | 8 | 10 | 1321 | 5.38 |
| P36776 | Lon protease homolog, mitochondrial | 106.4 | 2 | 2.46 | 6.15% | 1 | 7 | 9 | 959 | 6.39 |
| P86839 | Nestin | 143.3 | 2 | 0 | 3.48% | 1 | 5 | 5 | 1265 | 4.48 |
| Q5VTR2 | E3 ubiquitin-protein ligase BRE1A | 113.6 | 2 | 2.03 | 13.33% | 1 | 14 | 16 | 975 | 5.94 |
| Q8NFZ4 | Neuroligin-2 | 90.8 | 2 | 0 | 7.90% | 2 | 6 | 8 | 835 | 6.18 |
| 93-70 kDa | ||||||||||
| P07196 | Neurofilament light polypeptide | 61.5 | 5 | 11.47 | 12.71% | 2 | 11 | 19 | 543 | 4.65 |
| P18206-2 | Isoform 1 of Vinculin | 116.6 | 4 | 0 | 9.10% | 2 | 10 | 17 | 1066 | 6.09 |
| P61764 | Syntaxin-binding protein 1 | 67.5 | 4 | 1.69 | 11.78% | 2 | 8 | 12 | 594 | 6.96 |
| Q12860-2 | Isoform 2 of Contactin-1 | 111.8 | 3 | 0 | 5.06% | 3 | 7 | 12 | 1007 | 5.77 |
| Q16352 | Alpha-internexin | 55.4 | 3 | 5.74 | 9.82% | 2 | 7 | 10 | 499 | 5.4 |
| Q9UHP3 | Ubiquitin carboxyl-terminal hydrolase 25 | 122.1 | 3 | 0 | 3.13% | 4 | 4 | 5 | 1055 | 5.34 |
| O95155-3 | Isoform 3 of Ubiquitin conjugation factor E4 B | 121.7 | 2 | 1.62 | 7.82% | 4 | 10 | 27 | 1061 | 6.2 |
| P07197 | Neurofilament medium polypeptide | 102.4 | 2 | 1.71 | 19.43% | 4 | 16 | 31 | 916 | 4.91 |
| P28290-2 | Isoform 2 of Sperm-specific antigen 2 / Kiras-induced actin-interacting protein | 121.4 | 2 | 1.73 | 7.41% | 3 | 7 | 8 | 1106 | 5.31 |
| P41219 | Peripherin | 53.6 | 2 | 1.71 | 7.23% | 2 | 3 | 3 | 470 | 5.47 |
| P43681 | Neuronal acetylcholine receptor subunit alpha-4 | 69.9 | 2 | 1.63 | 4.63% | 1 | 3 | 4 | 627 | 7.21 |
| Q8JFV8 | Synaptic vesicle membrane protein VAT-1 homolog | 53.5 | 2 | 1.96 | 12.40% | 1 | 9 | 9 | 484 | 6.83 |
| Q9NPF5 | DNA methyltransferase 1-associated protein 1 | 53 | 2 | 0 | 12.85% | 1 | 8 | 18 | 467 | 9.5 |
| Q9NS56 | E3 ubiquitin-protein ligase Topors | 119.1 | 2 | 2.14 | 9.19% | 2 | 12 | 26 | 1045 | 9.51 |
| Q9UH65 | Switch-associated protein 70 | 69 | 2 | 3.79 | 6.32% | 1 | 6 | 11 | 585 | 5.87 |
| Q9UKP5-2 | Isoform 2 of A disintegrin and metalloproteinase with thrombospondin motifs 6 | 97.1 | 2 | 0 | 5.35% | 2 | 5 | 5 | 860 | 7.23 |
| Q9UQM7 | Calcium/calmodulin-dependent protein kinase type II subunit alpha | 54.1 | 2 | 2.16 | 4.39% | 4 | 3 | 3 | 478 | 7.08 |
| 70-50 kDa | ||||||||||
| Q71U36-2 | Isoform 2 of Tubulin alpha-1A chain | 46.3 | 6 | 8.86 | 19.47% | 7 | 6 | 6 | 416 | 5.08 |
| P07900 | Heat shock protein HSP 90-alpha | 84.6 | 5 | 1.78 | 12.02% | 5 | 9 | 9 | 732 | 5.02 |
| P00734 | Prothrombin | 70 | 3 | 1.79 | 5.95% | 1 | 4 | 4 | 622 | 5.9 |
| P08473 | Neprilysin | 85.5 | 2 | 0 | 10.67% | 1 | 8 | 9 | 750 | 5.73 |
| P10809 | 60 kDa heat shock protein, mitochondrial | 61 | 2 | 1.67 | 15.01% | 1 | 9 | 14 | 573 | 5.87 |
| P10909-4 | Isoform 4 of Clusterin | 48.8 | 2 | 5.09 | 10.34% | 5 | 6 | 6 | 416 | 6.71 |
| P13497-6 | Isoform BMP1-7 of Bone morphogenetic protein 1 | 92.6 | 2 | 0 | 9.48% | 6 | 9 | 12 | 823 | 8.09 |
| P14136 | Glial fibrillary acidic protein | 49.8 | 2 | 2.01 | 14.35% | 3 | 6 | 7 | 432 | 5.52 |
| Q6UWE0-2 | Isoform 2 of E3 ubiquitin-protein ligase LRSAM1 | 80.4 | 2 | 0 | 5.75% | 2 | 4 | 4 | 696 | 6 |
| Q8WUA2 | Peptidyl-prolyl cis-trans isomerase-like 4 | 57.2 | 2 | 0 | 10.37% | 1 | 7 | 10 | 492 | 5.92 |
| Q99985 | Semaphorin-3C | 85.2 | 2 | 0 | 12.38% | 1 | 10 | 50 | 751 | 8.69 |
| 50-38 kDa | ||||||||||
| P08670 | Vimentin | 53.6 | 4 | 6.93 | 9.23% | 2 | 5 | 6 | 466 | 5.12 |
| P14136 | Glial fibrillary acidic protein | 49.8 | 4 | 13.57 | 22.22% | 5 | 8 | 13 | 432 | 5.52 |
| P80723 | Brain acid soluble protein 1 | 22.7 | 2 | 0 | 15.86% | 5 | 5 | 28 | 227 | 4.63 |
| Q9NPH0 | Lysophosphatidic acid phosphatase type 6 | 48.8 | 2 | 0 | 6.07% | 1 | 4 | 6 | 428 | 6.47 |
| P07195 | L-lactate dehydrogenase B chain | 36.6 | 3 | 4.15 | 10.78% | 1 | 4 | 8 | 334 | 6.05 |
| P68371 | Tubulin beta-4B chain | 49.8 | 3 | 2 | 20.22% | 3 | 6 | 6 | 445 | 4.89 |
| P07355-2 | Isoform 2 of Annexin A2 | 40.4 | 2 | 2.88 | 16.25% | 2 | 9 | 15 | 357 | 8.37 |
| P10909-4 | Isoform 4 of Clusterin | 48.8 | 2 | 3.32 | 11.06% | 5 | 5 | 5 | 416 | 6.71 |
| P14136 | Glial fibrillary acidic protein | 49.8 | 2 | 1.84 | 15.51% | 3 | 6 | 8 | 432 | 5.52 |
| P17081 | Rho-related GTP-binding protein RhoQ | 22.6 | 2 | 2.55 | 13.66% | 1 | 3 | 3 | 205 | 6.32 |
| Q13425-2 | Isoform 2 of Beta-2-syntrophin | 27.7 | 2 | 2.03 | 14.23% | 1 | 4 | 4 | 267 | 9.86 |
| Q9NPE2 | Neugrin | 32.4 | 2 | 0 | 8.25% | 1 | 2 | 2 | 291 | 9.1 |
| Q9UQM7 | Calcium/calmodulin-dependent protein kinase type II subunit alpha | 54.1 | 2 | 2.32 | 12.97% | 28 | 6 | 6 | 478 | 7.08 |
| 32-28 kDa | ||||||||||
| P07437 | Tubulin b eta chain | 49.6 | 3 | 4.19 | 14.19% | 7 | 6 | 7 | 444 | 4.89 |
| P02746 | Complement C1q subcomponent subunit B | 26.7 | 2 | 3.18 | 16.21% | 1 | 4 | 45 | 253 | 8.63 |
| P02747 | Complement C1q subcomponent subunit C | 25.8 | 2 | 2.34 | 8.98% | 1 | 3 | 3 | 245 | 8.41 |
| 28-23 kDa | ||||||||||
| P02747 | Complement C1q subcomponent subunit C | 25.8 | 2 | 5.87 | 11.02% | 1 | 2 | 2 | 245 | 8.41 |
| P0CG47 | Polyubiquitin-B | 25.7 | 2 | 2.65 | 38.86% | 4 | 4 | 5 | 229 | 7.43 |
| P30626-2 | Isoform 2 of Sorcin | 20.3 | 2 | 2.19 | 20.77% | 2 | 4 | 4 | 183 | 5.34 |
| Q16625-5 | Isoform 5 of Occludin | 23.3 | 2 | 2.38 | 13.50% | 6 | 6 | 28 | 200 | 6.06 |
| 23-18 kDa | ||||||||||
| P02649 | Apolipoprotein E | 36.1 | 3 | 7.21 | 19.24% | 1 | 5 | 5 | 317 | 5.73 |
| Q2TAZ0-4 | Isoform 3 of Autophagy-related protein 2 homolog A | 35.2 | 2 | 0 | 16.31% | 1 | 7 | 7 | 331 | 10.77 |
| 18-15 kDa | ||||||||||
| O95050-2 | Isoform 2 of Indolethylamine N-methyltransferase | 28.8 | 2 | 0 | 13.36% | 2 | 3 | 40 | 262 | 5.27 |
| 15-5 kDa | ||||||||||
| A5A6J5 | Mortality factor 4-like protein 2 (MORF4L2) | 32.3 | 2 | 0 | 17.01% | 1 | 6 | 7 | 288 | 9.72 |
| P60880-2 | Isoform 2 of Synaptosomal-associated protein 25 | 23.3 | 2 | 0 | 12.62% | 1 | 3 | 8 | 206 | 4.86 |
| Q96S79 | Ras-like protein family member 10B | 23.2 | 2 | 1.85 | 10.84% | 1 | 3 | 18 | 203 | 9.39 |
| P04792 | Heat shock protein beta-1 | 22.8 | 2 | 4.25 | 12.68% | 1 | 3 | 3 | 205 | 6.4 |
| Q1RM09 | Brain acid soluble protein 1 homolog (BASP1)/NAP22 | 20 | 2 | 2.21 | 23.86% | 7 | 5 | 16 | 197 | 4.93 |
PSM = total number of identified peptide spectra matched for the protein.
From control CSF MV/E, we found high/low molecular weight structural proteins such as piccolo (560 kDa), titin isoforms (3992 kDa), nesprin (380 kDa), spatacsin (266 kDa), neural cell adhesion molecule L1 (135 kDa), as proteoglycan 4 (146 kDa), and neurite outgrowth-linked semiaphorin-7A (73 kDa), clusterin 4 (49 kDa), microtubule-associated protein-6 (86 kDa), Apo-E (36 kDa), histone deacetylase 11 (33 kDa) and complement C1q subunit C (26 kDa) (Table 1).
From TBI CSF MV/E we found an additional number of distinct proteins not found in control CSF MV/E (Table 2). For example, they include various cytoskeletal proteins such as microtubule-actin cross-linking factor 1 (838 kDa), Matrix-remodeling-associated protein 5 (312 kDa), and Microtubule-associated protein 2 (MAP2; 199 kDa); HEAT repeat-containing protein 5B (HEATR5B) (215 kDa), Serine/arginine repetitive matrix protein 2 (256 kDa), nestin (143 kDa), Syntaxin-binding protein 1 (68 kDa), Alpha-internexin (55 kDa), contactin-1 (112 kDa) Tubulin beta-4B chain (50 kDa) and Tubulin alpha-1A chain (46 kDa), Vimentin (54 kDa) and Occludin 5 (22 kDa).
We also found additional neurite-outgrowth related proteins such as Semaphorin-3C (85 kDa), Rho-related GTP-binding protein RhoQ (23 kDa), as well as additional synaptic proteins are found such as Synaptic vesicle membrane protein VAT-1 homolog Synaptosomal-associated protein 25 and post-synaptic density protein Calcium/calmodulin-dependent protein kinase type II alpha. Extraceular matrix protein Proteoglycan 4 and proteoglycan-related protein and Neurocan core protein (143 kDa) were also detected. We also found an additional complement protein C1q subcomponent subunit B.
Other cell homeostasis or cell signaling regulators include Voltage-dependent P/Q-type calcium channel subunit alpha-1A (254 kDa), 221 kDa Ryanodine receptor 2 (564 kDa) Brain acid soluble protein 1 homolog (BASP1), Multidrug resistance-associated protein 1 (171 kDa), Histone deacetylase 6 (131 kDa), Heat shock protein HSP 90-alpha (85 kDa), mitochondrial 60 kDa heat shock protein (61 kDa), Heat shock protein beta-1 (23 kDa).
Interestingly we also found a number of cell-death or proteolysis-linked proteins such as CASP8-associated protein 2 (222 kDa), Ubiquitin carboxyl-terminal hydrolase 31 (146 kDa), Ubiquitin carboxyl-terminal hydrolase 32 (181 kDa), E3 ubiquitin-protein ligase TTC3 (230 kDa), Lon protease homolog, mitochondrial (106 kDa), E3 ubiquitin-protein ligase BRE1A (113 kDa), Ubiquitin carboxyl-terminal hydrolase 25, Isoform 2 of E3 ubiquitin-protein ligase LRSAM1 (80 kDa); Autophagy-related protein 2 homolog A (35 kDa); Mortality factor 4-like protein 2 (MORF4L2) (32 kDa) and Polyubiquitin-B (26 kDa).
Lastly as expected, consistent with our above biomarker results, we found a number of TBI injury biomarkers including GFAP (50 kDa) itself at both 70-50 kDa and 50-38 kDa band segment, neurofilament protein-M (102 kDa) and neurofilament protein-L (68 kDa) and non-erythrocytic Spectrin beta chain 1 (274 kDa) and Isoform 3 of Microtubule-associated protein 2 (MAP2) (Table 2).
Systems Biology and Pathway analysis
We also performed systems biology and pathway analysis on mass spectrometry identified proteins in MV/E isolated from human TBI CSF vs. control CSF. There are 67 pathways unique to TBI group and 67 pathways unique to control group, while 33 pathways are common to both groups (Figure 6). We further identified a number of altered targeted molecular functions and biological processes based only proteins uniquely present in MV/E from TBI CSF. Targeted pathways identified include neuronal death, oxidative stress, axonal injury, proteolysis and microtubule cytoskeletal assembly (Figure 7). Lastly, Figure 8 Depicts the global enriched pathways implicated in the TBI CSF MV/E proteome. Shown are the altered pathways involving: complement activation, cell communication, synaptic endocytosis & exocytosis, cytoskeletal changes, and microtubule cytoskeletal assembly.
Figure 6.
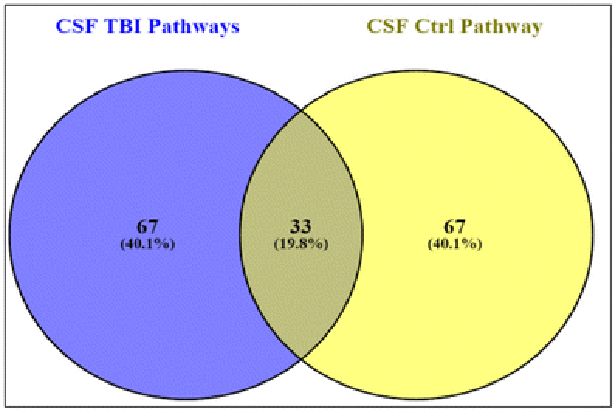
Two-set Venn diagram of the differential unique and combined pathways for protein identified in MV/E from human TB and control CSF.
Figure 7.
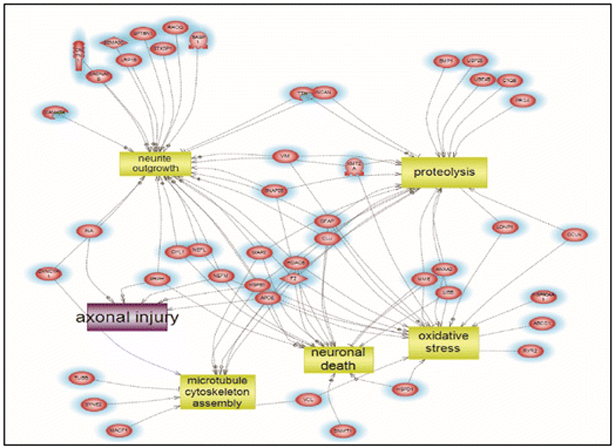
Altered targeted molecular functions and biological processes that are unique to the protein present in MV/E from TBI CSF. Shown are the altered pathways involving: neuronal death, oxidative stress, axonal injury, proteolysis and microtubule cytoskeletal assembly implicated in the altered proteins in the TBI CSF-specific proteins. (See Suppl. Table 4 for entity relation, relationship and references involved).
Figure 8.
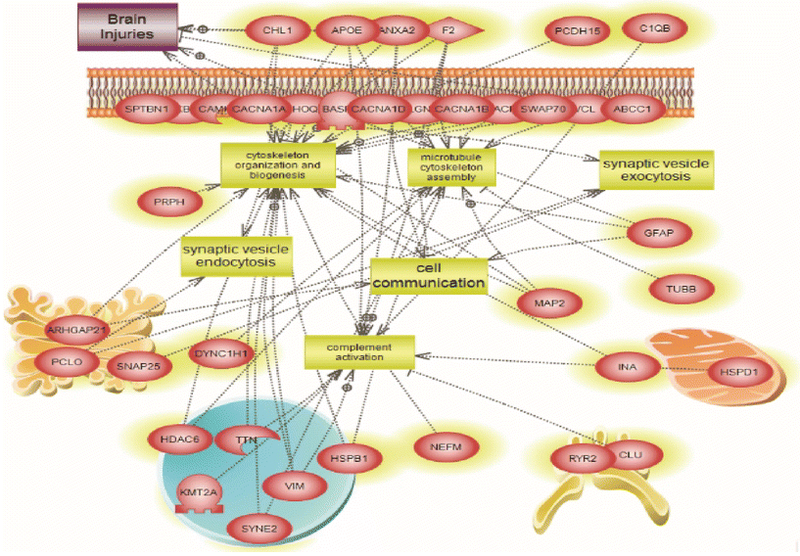
Global Enriched pathways implicated in the TBI CSF MV/E proteome. Shown are the altered pathways involving: complement activation, cell communication, synaptic endocytosis & exocytosis, cytoskeletal changes, and microtubule cytoskeletal assembly implicated in the altered proteins in the TBI CSF MV/E-specific proteins. (See Suppl. Table 5 for entity relation, relationship and references involved).
Discussion
Extensive literature is available on the CSF biomarkers for traumatic brain injury. These biomarkers are useful in assessing the severity and extent of the injury, cognitive performance and clinical outcome in TBI. Various biomarkers can be detected in the CSF and serum depending on the blood brain barrier (BBB) integrity after TBI. The biomarkers for astroglial injury in the brain are S100B and GFAP [26]. These two markers are found to be elevated in the CSF and serum after TBI and have a good predictive power for prognosis. For example, in a study found that low serum levels of S100B (below 0.10 μg/L) had a negative predictive value of 90% to 100% for a normal CT scan in patients with minor head injuries indicates the potential use of S100B to act as a biomarker for clinical decision making and reducing the number of CTs routinely taken after any TBI [27]. Biomarkers of acute neuronal injury are γ-enolase (NSE), α-II spectrin and UCH-L1 [28]. The elevated spectrin breakdown products and UCH-L1 are correlated with the severity of the injury and are used in the prognosis calculation of the patients after severe TBI. In acute axonal injury, tau proteins and neurofilament light (NFL) peptides act as biomarkers [29]. Both tau protein and NFL levels are elevated in the ventricular CSF in severe traumatic brain injury and they correlate with their levels correlate with the lesion size, severity and prognosis. Here, NFL measured in the CSF is considered as the most sensitive biomarker for axonal injury [30]. TBI induces inflammation in the central nervous system and can be detected by measuring the inflammatory protein markers such as IL-6, IL-8, and IL-10 in CSF [31]. The levels of these markers in the ventricular CSF have been correlated with the prognosis in TBI.
Exosomes from the CSF of patients with traumatic brain injury and spinal cord injury carry nucleotide-binding and oligomerization domain (NOD)-like receptor protein-1 (NLRP-1) inflammasome proteins and IL-1β [32]. These proteins in the exosomes can reach other cells, lead to an inflammatory reaction and further damage. In another study, short-interfering RNA (siRNA) is loaded into the exosomes and administered to the spinal-cord injured animals. Exosomes crossed the blood brain barrier and silenced the activity of caspase recruitment domain (ASC) leading to significant decrease in caspase 1 activation and processing of IL-1β after spinal cord injury [33]. This indicated the therapeutic potential of exosomes on spinal cord and traumatic brain injury. Another area of interest is the use of exosomes for the treatment of stroke. In the cell-based therapy like multipotent mesenchymal stromal cell (MSC) treatment, these cells actively secrete exosomes, which contain proteins and microRNA (miRNA) [34]. The release and content of the exosomes can be modified by changing the environmental conditions and through the exosomes miRNA can be transferred to the stroke affected part of the brain. Once in the brain, miRNA act as a gene regulator mediating important biological functions.
Exosomes have been isolated from the CSF of the patients with the two most common neurodegenerative disorders namely, Alzheimer’s and Parkinson’s disease. Proteins such as prion protein (PRNP), neurogenic locus notch homolog protein 3 (NOTCH3) and apolipoprotein E (APOE) which are associated with neurodegenerative disorders are found to be present enriched in CSF exosomes [35]. In the postmortem studies of Alzheimer’s disease, exosomes from the CSF samples contained significantly increased levels of total tau and p-tau proteins when compared to the controls. Also, amyloid precursor protein (APP) is detected in the CSF exosomes of AD patients [36]. LRRK2 and DJ-1, proteins implicated in PD, have been identified in urinary and CSF exosomes [37]. In recent years, the biomarker potential of the miRNA present in the exosomes has been explored for neurodegenerative disorders.
As with other neurodegenerative and brain disorders, exosomes may play an important role in the pathogenesis of TBI. The protein and genetic materials carried in the exosomes released from the injured cells could possibly act as a messenger to other cells and take part in cell-cell communication in TBI. This role of exosomes and their cargo in TBI could lead to the possible use of them as biomarkers in TBI. Very few studies have explored the possibility of exosomes released from the brain cells after TBI as biomarkers for severity and clinical outcome assessment [38] and therapeutics [39]. In a recent review, the potential of mesenchymal stem cells (MSCs) derived exosomes for the treatment of TBI is explored [40]. Particularly, functional microRNAs transferred from mesenchymal stem cells (MSCs) to neuronal cells through exosomes showed improvement in stroke rates and similar treatment of TBI has been hypothesized [41,42]. However, exosomes from the CSF are not specifically studied and the complete characterization of the exosomal proteins is not attempted. In the current study, biomarker potential and neuroproteomic characterization of microvesicles-exosomes derived proteins from human cerebrospinal fluid following traumatic brain injury is evaluated.
Microvesicles and exosomes isolated by ultracentrifugation and subsequent filtration (Figure 1) were characterized by transmission electron microscopy (Figure 3) and nanoparticle tracking analysis (Figure 2). The analysis was done using a targeted approach of immunoblotting and descriptive proteomic method. Previously studied “soluble” protein biomarkers for TBI that are indicative of damage to particular cell type and function were chosen for immunoblotting (Figure 4).
As we pointed out we use two approaches to identify protein components of TBi-ridnuced released MV/E- targeted approaches and global proteomic approaches. For the former, Spectrin and its breakdown products (BDPs) (as necrosis/apoptosis markers), GFAP and its BDP and UCH-L1 are known TBI biomarkers as soluble proteins found in CSF samples [15,16,43] – we also examined synaptophysin as it was identified in MV/E released from cytotoxin-challenged neuronal cells in culture form our early study [20]. We also added exosome marker Alix-1 as positive control. For proteomic discovery approach – we used mass spectrometry to identify novel protein components in TBI MV/E in comparison to those in control CSF. However, doing immunoblots on this large number of proteins is beyond the scope of this study. This should be further pursued in future studies.
In the study, the CSF of TBI patients showed intact αII-spectrin band and intense bands of SBDP of 145-150 kDa and lesser intense breakdown to SBDP of 120 kDa in the MV/E fraction. Similarly, stronger bands of intact GFAP (50 kDa) and more intense breakdown product (GFAP-BDP, 38 kDa) as previously reported [43]were found in TBI samples when compared to the controls (Figure 4). Intact neuronal cell body biomarker ubiquitin C-terminal hydrolase-L1 (UCH-L1) (24 kDa) were detected in the human TBI CSF while they were minimal in the control CSF (Figure 5). In addition, we identified neuronal presynaptic marker Synaptophysin (38 kDa) was detected robustly only in the human TBI CSF (Figure 5). In the study, Alix was used as the exosomal marker and could be detected in both TBI and control CSF (Figure 5). Ideally, a non-CNS injury control would help determine if the proteins found in the TBI MV/exosomes are specific for TBI. However, this is beyond the scope of the present study.
We also performed receiver operating characteristics (ROC) curve analysis for TBI vs control CSF MV/E levels of intact αII-spectrin, SBDP150/145, SBDP120, intact GFAP, GFAP-BDP-38K, synaptophysin and Alix-1. Despite that scatter plots showing strong significances between Control and TBI CSF for all markers (Figure 4-5), in the case of ROC analysis, due to the small sample size, in particular in the control groups, we did not obtain significant area-under-the-curves (results not shown). In the future, studies with large sample size are needed to confirm our current results.
Mass spectrometry-based proteomic identification of proteins was carried out to identify the additional proteins present in the MV/E isolated from the control and TBI CSF. We identified 91 proteins in MV/E from control CSF and 466 proteins from TBI CSF (Table 1-2). Various proteins uniquely present in the MV/E fraction of TBI CSF were identified such as cytoskeletal proteins, neurite-outgrowth related proteins, extracellular matrix protein and cell signaling regulators. Another group of proteins that were present in TBI CSF were cell-death or proteolysis-linked proteins. Combined Systems biology analysis in fact also identified a number pathways linked to proteins found in MV/E isolated from TBI CSF: axonal injury, cell death, complement activation, cell communication, synaptic endocytosis & exocytosis, cytoskeletal changes, and microtubule cytoskeletal assembly and proteolysis (Figure 7-8). While we analyzed protein content in MV/E isolated CSF samples, however, in human brain, it is known that there is a dynamic exchange of content between extracellular fluid (ECF) and CSF compartments. Thus, the protein profile we observed in the MV/E from TBI CSF are also likely similar or identical to that found in the ECF compartment after TBI. MV/E are now recognized as a form of cell-to-cell communications and exchange of cellular content. Thus, it is possible that following TBI, MV/E released from injured neurons and astroglia cells might carry out certain be involved in certain cell-to-cell signal transduction process by way of delivery of MV/E embedded proteins to the neighboring recipient cells.
In terms of potentials of MV/E containing brain proteins versus freely soluble biomarkers in biofluids, there are several emerging studies showing the exosome- containing Tau could be a form of circulating biomarker for Alzheimer’s disease [44,45] and well as for post-TBI chronic traumatic encephalopathy [46]. The potential advantages of MVE-embedded protein markers are that since these proteins are shielded by the lipid bilayer membrane of MVE, (i) these proteins might be more preserved in their initial state; and (ii) they are protected from proteolytic degradation.
In summary, our study characterized microvesicles/exosomes present in CSF samples from human TBI subjects versus control subjects. We found that these M/E are likely derived from various brain cell types in the brain (e.g. neurons, astroglia). Based on the proteins found in these MV/E preparations, we conclude that they contain proteins from various subcellular structures or locations. Thus, brain-protein containing MV/E following TBI might represent a form of cell-to cell communication mechanism. In addition, detection of these MV/E might also have potential diagnostic values for TBI.
Supplementary Material
Supplementary Table 1. TBI patient demographics
Supplementary Table 2. A full list of proteins identified by MS/MS in MV/E isolated from human control CSF samples. Total of 92 proteins identified from two subjects
Supplementary Table 3. A full list of proteins identified by MS/MS in MV/E isolated from human TBI CSF samples. A total of 466 proteins from three subjects.
Supplementary Table 4. A full list of entry relation, relationship and references for targeted analysis.
Supplementary Table 5. A full list of entry relation, relationship and references for global analysis.
Acknowledgement
We like to thank Jill W. Verlander, DVM at the UF EM facility for her advice and technical assistance. We sincerely thank Dr. Claudia Robertson (Baylor College) for providing human TBI CSF samples. This study is in part funded by UF Psychiatry Department development fund. This study is supported in part by NIH grant R21 NS085455-01 (KKW), NIH 1U01 NS086090-01) and DOD grant (W81XWH-14-2-0176) (KKW; G. Manley of UCSF). Post-Doctoral support is by the Fogarty International Training Program in Chronic Non-Communicable Diseases and Disorders at the University of Florida, Grant # 1D43TW009120 (L. Cottler, PI) (VR). We want to thank Dr. Linda Cottler for her support.
References
- 1.TBI: Get the Facts ∣ Concussion ∣ Traumatic Brain Injury ∣ CDC Injury Center [Internet]. [cited 2016. July 12], Available from: http://www.cdc.gov/traumaticbraininjury/get_the_facts.html
- 2.Bramlett HM, Dietrich WD. Pathophysiology of cerebral ischemia and brain trauma: similarities and differences. J Cereb Blood Flow Metab Off J Int Soc Cereb Blood Flow Metab. 2004. February;24(2): 133–50. [DOI] [PubMed] [Google Scholar]
- 3.Yi J-H, Hazell AS. Excitotoxic mechanisms and the role of astrocytic glutamate transporters in traumatic brain injury. Neurochem Int. 2006. April;48(5):394–403. [DOI] [PubMed] [Google Scholar]
- 4.Foran E, Trotti D. Glutamate Transporters and the Excitotoxic Path to Motor Neuron Degeneration in Amyotrophic Lateral Sclerosis. Antioxid Redox Signal. 2009. July;11(7):1587–602. [DOI] [PMC free article] [PubMed] [Google Scholar]
- 5.Bernath E, Kupina N, Liu MC, Hayes RL, Meegan C, Wang KKW. Elevation of cytoskeletal protein breakdown in aged Wistar rat brain. Neurobiol Aging. 2006. April;27(4):624–32. [DOI] [PubMed] [Google Scholar]
- 6.Kobeissy FH, Liu MC, Yang Z, Zhang Z, Zheng W, Glushakova O, et al. Degradation of βII-Spectrin Protein by Calpain-2 and Caspase-3 Under Neurotoxic and Traumatic Brain Injury Conditions. Mol Neurobiol. 2015. August;52(1):696–709. [DOI] [PMC free article] [PubMed] [Google Scholar]
- 7.Zhang Z, Zoltewicz JS, Mondello S, Newsom KJ, Yang Z, Yang B, et al. Human traumatic brain injury induces autoantibody response against glial fibrillary acidic protein and its breakdown products. PloS One. 2014;9(3):e92698. [DOI] [PMC free article] [PubMed] [Google Scholar]
- 8.Wang KK. Calpain and caspase: can you tell the difference? Trends Neurosci. 2000. January;23(1):20–6. [DOI] [PubMed] [Google Scholar]
- 9.Raghupathi R Cell death mechanisms following traumatic brain injury. Brain Pathol Zurich Switz. 2004. April; 14(2):215–22. [DOI] [PMC free article] [PubMed] [Google Scholar]
- 10.Borg J, Holm L, Cassidy JD, Peloso P, Carroll L, Von Holst H, et al. Diagnostic procedures in mild traumatic brain injury: results of the WHO Collaborating Centre Task Force on Mild Traumatic Brain Injury. J Rehabil Med. 2004;36(0):61–75. [DOI] [PubMed] [Google Scholar]
- 11.Eierud C, Craddock RC, Fletcher S, Aulakh M, King-Casas B, Kuehl D, et al. Neuroimaging after mild traumatic brain injury: Review and meta-analysis. Neuroimage Clin. 2014;4:283–94. [DOI] [PMC free article] [PubMed] [Google Scholar]
- 12.Zoltewicz JS, Mondello S, Yang B, Newsom KJ, Kobeissy F, Yao C, et al. Biomarkers track damage after graded injury severity in a rat model of penetrating brain injury. J Neurotrauma. 2013. July 1;30(13): 1161–9. [DOI] [PubMed] [Google Scholar]
- 13.Papa L, Lewis LM, Silvestri S, Falk JL, Giordano P, Brophy GM, et al. Serum levels of ubiquitin C-terminal hydrolase distinguish mild traumatic brain injury from trauma controls and are elevated in mild and moderate traumatic brain injury patients with intracranial lesions and neurosurgical intervention. J Trauma Acute Care Surg. 2012. May;72(5): 1335–44. [DOI] [PMC free article] [PubMed] [Google Scholar]
- 14.Diaz-Arrastia R, Kochanek PM, Bergold P, Kenney K, Marx CE, Grimes CJB, et al. Pharmacotherapy of traumatic brain injury: state of the science and the road forward: report of the Department of Defense Neurotrauma Pharmacology Workgroup. J Neurotrauma. 2014. January 15;31(2): 135–58. [DOI] [PMC free article] [PubMed] [Google Scholar]
- 15.Ringger NC, O’Steen BE, Brabham JG, Silver X, Pineda J, Wang KKW, et al. A novel marker for traumatic brain injury: CSF alphaII-spectrin breakdown product levels. J Neurotrauma. 2004. October;21(10): 1443–56. [DOI] [PubMed] [Google Scholar]
- 16.Mondello S, Robicsek SA, Gabrielli A, Brophy GM, Papa L, Tepas J, et al. αII-Spectrin Breakdown Products (SBDPs): Diagnosis and Outcome in Severe Traumatic Brain Injury Patients. J Neurotrauma. 2010. July;27(7): 1203–13. [DOI] [PMC free article] [PubMed] [Google Scholar]
- 17.Théry C, Zitvogel L, Amigorena S. Exosomes: composition, biogenesis and function. Nat Rev Immunol. 2002. August;2(8):569–79. [DOI] [PubMed] [Google Scholar]
- 18.Raposo G, Stoorvogel W. Extracellular vesicles: exosomes, microvesicles, and friends. J Cell Biol. 2013. February 18;200(4):373–83. [DOI] [PMC free article] [PubMed] [Google Scholar]
- 19.Frühbeis C, Fröhlich D, Kuo WP, Amphornrat J, Thilemann S, Saab AS, et al. Neurotransmitter-Triggered Transfer of Exosomes Mediates Oligodendrocyte-Neuron Communication. PLOS Biol. 2013. July 9;11(7):e1001604. [DOI] [PMC free article] [PubMed] [Google Scholar]
- 20.Kumar D, Manek R, Raghavan V, Wang KK. Protein Characterization of Extracellular Microvesicles/Exosomes Released from Cytotoxin-Challenged Rat Cerebrocortical Mixed Culture and Mouse N2a Cells. Mol Neurobiol. 2017; 1–13. [DOI] [PubMed] [Google Scholar]
- 21.Nekludov M, Mobarrez F, Gryth D, Bellander B-M, Wallen H. Formation of microparticles in the injured brain of patients with severe isolated traumatic brain injury. J Neurotrauma. 2014. December 1;31(23): 1927–33. [DOI] [PubMed] [Google Scholar]
- 22.Redell JB, Moore AN, Ward NH, Hergenroeder GW, Dash PK. Human traumatic brain injury alters plasma microRNA levels. J Neurotrauma. 2010. December;27(12):2147–56. [DOI] [PMC free article] [PubMed] [Google Scholar]
- 23.Robertson CS, Hannay HJ, Yamal J-M, Gopinath S, Goodman JC, Tilley BC, et al. Effect of erythropoietin and transfusion threshold on neurological recovery after traumatic brain injury: a randomized clinical trial. Jama. 2014;312(1):36–47. [DOI] [PMC free article] [PubMed] [Google Scholar]
- 24.Moghieb A, Bramlett HM, Das JH, Yang Z, Selig T, Yost RA, et al. Differential Neuroproteomic and systems biology analysis of spinal cord injury. Mol Cell Proteomics. 2016;15(7):2379–2395. [DOI] [PMC free article] [PubMed] [Google Scholar]
- 25.Kobeissy FH, Zhang Z, Sadasivan S, Gold MS, Wang KK. Methods in drug abuse neuroproteomics: methamphetamine psychoproteome. Neuroproteomics Methods Protoc. 2009;217–228. [DOI] [PubMed] [Google Scholar]
- 26.Lei J, Gao G, Feng J, Jin Y, Wang C, Mao Q, et al. Glial fibrillary acidic protein as a biomarker in severe traumatic brain injury patients: a prospective cohort study. Crit Care [Internet]. 2015. [cited 2016 August 1]; 19 Available from: http://www.ncbi.nlm.nih.gov/pmc/articles/PMC4601141/ [DOI] [PMC free article] [PubMed] [Google Scholar]
- 27.Unden J, Romner B. Can Low Serum Levels of S100B Predict Normal CT Findings After Minor Head Injury in Adults?: An Evidence-Based Review and Meta-Analysis. J Head Trauma Rehabil. 2010;25(4):228–240. [DOI] [PubMed] [Google Scholar]
- 28.Zetterberg H, Smith DH, Blennow K. Biomarkers of mild traumatic brain injury in cerebrospinal fluid and blood. Nat Rev Neurol. 2013. April;9(4):201–10. [DOI] [PMC free article] [PubMed] [Google Scholar]
- 29.Laskowitz D, Grant G. Translational Research in Traumatic Brain Injury. CRC Press; 2016. 424 p. [PubMed] [Google Scholar]
- 30.Gisslén M, Price RW, Andreasson U, Norgren N, Nilsson S, Hagberg L, et al. Plasma Concentration of the Neurofilament Light Protein (NFL) is a Biomarker of CNS Injury in HIV Infection: A Cross-Sectional Study. EBioMedicine. 2015. November 22;3:135–40. [DOI] [PMC free article] [PubMed] [Google Scholar]
- 31.Yousefzadeh-Chabok S, Dehnadi Moghaddam A, Kazemnejad-Leili E, Saneei Z, Hosseinpour M, Kouchakinejad-Eramsadati L, et al. The Relationship Between Serum Levels of Interleukins 6, 8, 10 and Clinical Outcome in Patients With Severe Traumatic Brain Injury. Arch Trauma Res. 2015. March;4(1):e18357. [DOI] [PMC free article] [PubMed] [Google Scholar]
- 32.Haneklaus M, O’Neill LA, Coll RC. Modulatory mechanisms controlling the NLRP3 inflammasome in inflammation: recent developments. Curr Opin Immunol. 2013;25(1):40–45. [DOI] [PubMed] [Google Scholar]
- 33.de Rivero Vaccari JP, Brand F, Adamczak S, Lee SW, Perez-Barcena J, Wang MY, et al. Exosome-mediated inflammasome signaling after central nervous system injury. J Neurochem. 2016. January;136 Suppl 1:39–48. [DOI] [PMC free article] [PubMed] [Google Scholar]
- 34.Xin H, Li Y, Chopp M. Exosomes/miRNAs as mediating cell-based therapy of stroke. Front Cell Neurosci. 2014;8:377. [DOI] [PMC free article] [PubMed] [Google Scholar]
- 35.Vella LJ, Hill AF, Cheng L. Focus on Extracellular Vesicles: Exosomes and Their Role in Protein Trafficking and Biomarker Potential in Alzheimer’s and Parkinson’s Disease. Int J Mol Sci. 2016; 17(2): 173. [DOI] [PMC free article] [PubMed] [Google Scholar]
- 36.Kalani A, Tyagi A, Tyagi N. Exosomes: mediators of neurodegeneration, neuroprotection and therapeutics. Mol Neurobiol. 2014. February;49(1):590–600. [DOI] [PMC free article] [PubMed] [Google Scholar]
- 37.Russo I, Bubacco L, Greggio E. Exosomes-associated neurodegeneration and progression of Parkinson’s disease. Am J Neurodegener Dis. 2012;1(3):217–25. [PMC free article] [PubMed] [Google Scholar]
- 38.Taylor DD, Gercel-Taylor C. Exosome platform for diagnosis and monitoring of traumatic brain injury. Phil Trans R Soc B. 2014;369(1652):20130503. [DOI] [PMC free article] [PubMed] [Google Scholar]
- 39.Zhang Y, Chopp M, Meng Y, Katakowski M, Xin H, Mahmood A, et al. Effect of exosomes derived from multipluripotent mesenchymal stromal cells on functional recovery and neurovascular plasticity in rats after traumatic brain injury. J Neurosurg. 2015. April; 122(4): 856–67. [DOI] [PMC free article] [PubMed] [Google Scholar]
- 40.Yang Y, Ye Y, Su X, He J, Bai W, He X. MSCs-Derived Exosomes and Neuroinflammation, Neurogenesis and Therapy of Traumatic Brain Injury. Front Cell Neurosci. 2017;11:55. [DOI] [PMC free article] [PubMed] [Google Scholar]
- 41.Xin H, Li Y, Buller B, Katakowski M, zhang Y, Wang X, et al. Exosome-Mediated Transfer of miR-133b from Multipotent Mesenchymal Stromal Cells to Neural Cells Contributes to Neurite Outgrowth. Stem Cells Dayt Ohio. 2012. July;30(7):1556–64. [DOI] [PMC free article] [PubMed] [Google Scholar]
- 42.Xiong Y, Mahmood A, Chopp M. Emerging potential of exosomes for treatment of traumatic brain injury. Neural Regen Res. 2017. January; 12(1):19–22. [DOI] [PMC free article] [PubMed] [Google Scholar]
- 43.Zhang Z, Zoltewicz JS, Mondello S, Newsom KJ, Yang Z, Yang B, et al. Human traumatic brain injury induces autoantibody response against glial fibrillary acidic protein and its breakdown products. PloS One. 2014;9(3):e92698. [DOI] [PMC free article] [PubMed] [Google Scholar]
- 44.Wang Y, Balaji V, Kaniyappan S, Krüger L, Irsen S, Tepper K, et al. The release and trans-synaptic transmission of Tau via exosomes. Mol Neurodegener. 2017; 12(1):5. [DOI] [PMC free article] [PubMed] [Google Scholar]
- 45.Reilly P, Winston CN, Baron K, Trejo M, Rockenstein EM, Akers JC, et al. Novel human neuronal tau model exhibiting neurofibrillary tangles and transcellular propagation. Neurobiol Dis [Internet]. 2017. [cited 2017 September 4]; Available from: http://www.sciencedirect.com/science/article/pii/S0969996117301316 [DOI] [PMC free article] [PubMed] [Google Scholar]
- 46.Stern RA, Tripodis Y, Baugh CM, Fritts NG, Martin BM, Chaisson C, et al. Preliminary study of plasma exosomal tau as a potential biomarker for chronic traumatic encephalopathy. J Alzheimers Dis. 2016;51 (4): 1099–1109. [DOI] [PMC free article] [PubMed] [Google Scholar]
Associated Data
This section collects any data citations, data availability statements, or supplementary materials included in this article.
Supplementary Materials
Supplementary Table 1. TBI patient demographics
Supplementary Table 2. A full list of proteins identified by MS/MS in MV/E isolated from human control CSF samples. Total of 92 proteins identified from two subjects
Supplementary Table 3. A full list of proteins identified by MS/MS in MV/E isolated from human TBI CSF samples. A total of 466 proteins from three subjects.
Supplementary Table 4. A full list of entry relation, relationship and references for targeted analysis.
Supplementary Table 5. A full list of entry relation, relationship and references for global analysis.