

Abstract
Background:
Most studies of neurocognitive functioning in Clinical High Risk (CHR) cohorts have examined group averages, likely concealing heterogeneous subgroups. We aimed to identify neurocognitive subgroups and to explore associated outcomes.
Methods:
Data were acquired from 324 participants (mean age 18.4) in the first phase of the North American Prodrome Longitudinal Study (NAPLS-1), a multi-site consortium following individuals for up to 2½ years. We applied Ward’s method for hierarchical clustering data to 8 baseline neurocognitive measures, in 166 CHR individuals, 49 non-CHR youth with a family history of psychosis, and 109 healthy controls. We tested whether cluster membership was associated with conversion to psychosis, social and role functioning, and follow-up diagnosis. Analyses were repeated after data were clustered based on independently developed clinical decision rules.
Results:
Four neurocognitive clusters were identified: Significantly Impaired (n=33); Mildly Impaired (n=82); Normal (n=145) and High (n=64). The Significantly Impaired subgroup demonstrated the largest deviations on processing speed and memory tasks and had a conversion rate of 58%, a 40% chance of developing a schizophrenia spectrum diagnosis (compared to 24.4% in the Mildly Impaired, and 10.3% in the other two groups combined), and significantly worse functioning at baseline and 12-months. Data clustered using clinical decision rules yielded similar results, pointing to high convergent validity.
Conclusion:
Neurocognitive profiles vary substantially in their severity and are associated with diagnostic and functional outcome, underscoring neurocognition as a predictor of illness outcomes. These findings, if replicated, are a first step toward personalized treatment for individuals at-risk for psychosis.
Keywords: Heterogeneity, Clinical High Risk, Neuropsychology, functional outcome, cluster analysis
1. Introduction
Neurocognitive dysfunction is a central feature of schizophrenia (Heinrichs, 2005; Kahn and Keefe, 2013; Nuechterlein et al., 2012; Schulz and Murray, 2016) and, to a lesser extent, other psychoses (Lewandowski et al., 2011). It is also a key determinant of social and role functioning (Green, 1996), (Meyer et al., 2014). Based largely on cross-sectional studies, significant but modest impairments have been observed in the premorbid phase (Cannon et al., 2002; Reichenberg et al., 2010; Woodberry et al., 2008), somewhat greater deficits during the prodromal or clinical high risk (CHR) period (Bora and Murray, 2014; Fusar-Poli et al., 2012; Giuliano et al., 2012), and relatively severe deficits by the first episode (Aas et al., 2014; Danaher et al., 2018; Mesholam-Gately et al., 2009). In the first and second phases of the North American Prodrome Longitudinal Studies (NAPLS 1, NAPLS 2) (Seidman et al., 2010; Seidman et al., 2016), as well as in a number of meta-analyses (Bora and Murray, 2014; Fusar-Poli et al., 2012; Giuliano et al., 2012), baseline neurocognitive performance in those who later convert to psychosis (roughly 25%−35% when followed up to 3 years (Fusar-Poli et al., 2013)) is significantly worse than in non-converters. Effect sizes (ESs) tend to be modest across most neurocognitive domains in non-converters (Cohen’s d = −0.26 to −0.67), and a bit larger (d= −0.35 to −0.84) in those who convert to psychosis (Giuliano et al., 2012). Declarative memory and attention/working memory are relatively strong predictors of psychosis (Frommann et al., 2011; Lencz et al., 2006; Michel et al., 2014; Seidman et al., 2010; Seidman et al., 2016).
Little attention, however, has been paid to inter-individual neurocognitive variability, except for distinguishing converters from non-converters. As neurocognitive function is variably impaired in most cases of established schizophrenia (ranging from near normal to globally and severely impaired performance (Ahmed et al., 2018; Bechi et al., 2018; Hill et al., 2002; Kremen et al., 2000; Ohi et al., 2017; Reichenberg and Harvey, 2007; Seidman et al., 1992; Van Rheenen et al., 2017; Weickert et al., 2000)), we also expect variability in the CHR phase. Moreover, there is considerable neurocognitive heterogeneity in the early phase of schizophrenia (Seidman, 1990). However, in contrast to recent cluster analyses that point to significant neurocognitive heterogeneity in psychosis and related affective disorders (Burdick et al., 2014; Reser et al., 2015; Lewandowski et al., 2014; van Rheenen et al., 2017), there are no published studies characterizing neurocognitive heterogeneity in CHR samples or their clinical and functional consequences.
Moving from group averages to subgroups is necessary to develop a more personalized clinical approach to treatment of CHR individuals. Some youth initially identified as CHR fully remit, while others remain symptomatic without transitioning to psychosis (Woods et al., 2014). Advances have been made in developing “risk calculators” for the prediction of conversion to psychosis using combinations of symptoms, neurocognitive scores, social and role function measures and environmental variables (Cannon et al., 2016; Carrion et al., 2016; Michel et al., 2014), and some have begun to incorporate biological measures (Clark et al., 2016). These are important advances in identifying individual predictors of conversion to psychosis. It is possible that identification of neurocognitively defined subgroups can enhance this effort.
There are several reasons that characterizing neurocognitive heterogeneity may refine risk profiles and potentially enhance treatment. First, profiles based on multiple tests use more information than any single test and thus may have more clinical utility (Lezak, 2013). Second, identifying strengths and weaknesses is important for the patient’s and family’s understanding of the nature of the illness (Seidman, 1994). Third, impaired cognition is a common complaint (“I can’t think”, “I can’t remember what I read”, etc.) and validation of such complaints is fundamental to their self-view (Woodberry et al., 2016). Moreover, neurocognitive deficits may be assessed more objectively and reliably than other aspects of the CHR syndrome (e.g., attenuated positive symptoms) that may be more likely to fluctuate over time, and depend on the individual’s willingness to disclose them. Finally, as cognitive remediation becomes more widely utilized in CHR individuals (Keshavan et al., 2014; Wykes et al., 2011), treatments need to be relevant to the pattern and severity of cognitive problems (Hooker et al., 2014; Piskulic et al., 2015).
Broadly stated, there are two methods for identifying neurocognitive clusters. The typical approach to identifying subgroups is through cluster analysis, a statistical approach for elucidating heterogeneity (Ferreira, 2009). In neurocognitive research on schizophrenia, cluster analytic studies have typically indicated mainly quantitative rather than qualitative differences among schizophrenia subgroups (Goldstein et al., 1998; Goldstein and Shemansky, 1995), or have utilized only a single or small number of neuropsychological tests (Heinrichs and Awad, 1993; Heinrichs et al., 1997). Cluster analysis has not been applied to neurocognition in CHR samples.
The second, clinical method follows decision rules employed by clinicians to make judgments about brain damage and dysfunction, and severity and types of cognitive impairments (Lezak, 2013). This process hinges on the notion that the clinical neuropsychologist identifies strengths and weaknesses in an individual reflecting some admixture of developmental achievements due to genetics and environment and then losses due to neurologically damaging factor(s). A clinical clustering method has been used previously in neuropsychological studies of schizophrenia (Kremen et al., 2004). This paper represents the first use of both of these approaches in a CHR sample.
The goals of this study were to: 1) identify cognitive groupings of CHR participants; 2) assess the extent to which cognitive groups differ from one another on external correlates, examining the utility of this approach to meaningfully predict outcomes and diagnosis; and 3) evaluate the comparability of the statistical and clinical cluster analytic approaches. We predicted heterogeneity in the level of cognitive impairment in CHR participants, and hypothesized that participants with higher levels of cognitive impairment would have increased risk of conversion to psychosis and poorer functional and clinical outcome.
2. Methods
2.1. Sample
Data were obtained in NAPLS-1 (Addington et al., 2007), a consortium of eight research centers studying CHR for psychosis between 2003–2008 (see Supplement for methodological details). Participants received baseline assessments and were observed for up to 2½ years (Addington et al., 2007; Cannon et al., 2008). Based on prior NAPLS’ study methods (Seidman et al., 2010), we included baseline data from eight neurocognitive tests on 324 individuals, yielding a sample of 166 CHR individuals, 49 persons with a Family History (FH) of psychosis without prodromal symptoms, and 109 Normal Controls (NCs) without a FH of psychosis or prodromal symptoms. Prior NAPLS reports have examined neurocognitive function in relation to conversion to psychosis or functional outcome (NAPLS 1 (Meyer et al., 2014; Seidman et al., 2010); NAPLS 2 (Seidman et al., 2016)); however, none reported on heterogeneity of neurocognitive profiles, nor on the relationship of neurocognitive subgroups with conversion to psychosis or functional and diagnostic outcomes. All study protocols were approved by the Institutional Review Boards of the eight participating sites and all subjects gave informed consent.
2.2. Measures
2.2.1. CHR Status and Clinical Symptoms
The Structured Interview for Prodromal Syndromes (SIPS) and the Scale for Assessment of Prodromal Syndromes (SOPS) (Miller et al., 2002) were used to define CHR and conversion to psychosis. Summary scores were determined for each domain (positive, negative, disorganized, and general symptoms). Full details regarding SIPS criteria, reliability and consensus procedures are described elsewhere (Addington et al., 2007). The SCID (Williams et al., 1992) was used to establish DSMIV axis 1 diagnoses for baseline and follow-up.
Neurocognitive Assessment
A variety of neurocognitive measures were used across sites (Seidman et al., 2010), as NAPLS 1 was not a prospective multisite study, but rather a series of individual projects contributing to a federated database. Methods for data integration are reported in previous publications(Seidman et al., 2010) and in the Supplement. The eight cognitive tests used to derive neurocognitive profiles are shown in Table 1. Raw scores were standardized (z) against the control sample for analysis.
Table 1.
Neurocognitive assessments
| Neurocognitive domain | Test |
|---|---|
| Verbal Comprehension | Vocabulary from the WISC, WAIS or WASI(Wechsler, 1981, 1991; Wechsler, 1999, 1997 ), a scale measuring verbal comprehension |
| Visual-perceptual organization | Block Design(Wechsler, 1981, 1991; Wechsler, 1997 ) |
| Vigilance and working memory | Continuous Performance Test-Identical Pairs (CPT-IP) digits(Comblatt et al., 1988) |
| Speed of processing | Digit Symbol-Coding)Weclisler, 1981, 1991; Wechsler, 1997 ) and (5) Trail Making Test Part B(Reitan, 1993) |
| Verbal fluency | Controlled Oral Word Association (COWA)(Benton, 1983) |
| Problem solving/ executive functioning | Wisconsin Card Sorting Test(Heaton, 1993; Kongs, 2000) |
| Verbal learning and memory | Story recall tests from the Wechsler Memory Scale(Wechsler, 1987; Wechsler, 1997) for participants 17 years or older and Children’s Memory Scale(Cohen, 1997) for those younger than 17 years, as well as list learning on the Hopkins Verbal Learning Test-Revised(Brandt J, 1998. ), Rey Auditory Verbal Learning Test(Lezak, 2013), and California Verbal Learning Test adult and child versions(Delis D, 1994; Delis DC, 2000). |
2.2.2. Social and Role Functioning
Functioning was assessed using the GF:Social and GF:Role scales (Cornblatt et al., 2012), specifically designed to assess functioning in at-risk adolescents and young adults. Scales range from 1 to 10 (with higher scores indicating better functioning). We used the ‘current’ functioning scores (functioning levels in the month preceding assessment) at baseline, 6-months, and 12-months after baseline. Ratings for each scale were based on best estimates derived from all available information, an approach shown to yield high inter-rater reliability scores (Cannon et al., 2008; Cornblatt et al., 2007).
2.2.3. Follow-Ups
Participants were seen at six-month intervals and followed-up to 2½ years. All follow-up interviews included SIPS ratings and the two functioning scales. Consistent with prior publications (Cannon et al., 2008), conversion to psychosis was defined as the presence of a psychotic-level positive symptom (a score of 6 with a minimum duration of one week). For the majority of the cases (69.5%), a follow-up SCID interview was conducted at the time of conversion to determine DSM-IV diagnosis.
2.3. Statistical Analyses
2.3.1. Between-group comparability analyses
Analyses were performed using STATA 14.0 (StataCorps). We used between-group t-tests to examine the comparability of our included sample (n=324) versus participants without comparable neurocognitive data (n=563), and between study participants (i.e. those with neurocognition scores available) with and without baseline diagnostic (n=159 vs n=165) and (n=267 vs n=57; GF: Role and GF: Social) functional outcome data.
2.3.2. Neurocognitive profile clusters
We first used the hierarchical clustering Ward’s method to structure the cognitive data (listed in table 1), one of the most reliable methods for deriving clusters (Ferreira, 2009). In this method, each case begins as its own cluster, and cases are joined into two clusters if this results in the minimum increase in the error sum of squares. Ward’s method keeps this growth as small as possible (www.stat.cmu.edu). We established the optimum number of clusters with the Duda and Hart (Duda, 1973) stopping rule, in which distinct clustering is characterized by large Je(2)/Je(l) values and small pseudo-T-squared values (with larger T-squared values next to it) (Islam et al., 2015).
2.3.3. Associations between neurocognitive profiles, clinical and functional outcome
We used a Cox proportional hazard model to determine the effect of neurocognitive profile on time to conversion within the CHR cohort. Conversion was entered as a status variable, time to onset of psychosis or to end-of-study as a time variable and neurocognitive clusters, age at baseline, sex and baseline positive symptoms as predictor variables. Given the overlap between neurocognition and negative and disorganization symptoms (Dominguez Mde et al., 2009), Cox proportional hazard models including these symptom domains were explored as secondary analyses. Kaplan-Meier survival analysis was performed. Regression analyses were used to examine the magnitude of differences in neurocognitive performance between the most impaired profile compared to the rest of the sample, controlling for age and sex. There was no evidence for multi-collinearity in neurocognitive data (mean VIF =1.52), allowing for meaningful interpretation of the regression analyses.
Regression analyses over the entire sample were also performed to examine whether neurocognitive functioning accounted for variance in social and role functioning at baseline, 6 month and 1-year follow-up, controlling for age and sex. Using Chi-square analyses we explored whether the clusters indicating greater neurocognitive impairment were associated with higher rates of schizophrenia-spectrum diagnoses.
2.3.4. Clinical approach
To explore whether we could derive similar results using a clinical approach, data were clustered based on rules used by clinical neuropsychologists (Kremen et al., 2004; Lezak, 2013). A participant was considered “Normal” if performance on all cognitive domains was better than 1.5 standard deviation below the control mean, OR if a maximum of one single domain was between 1.5 to 2 SD below the mean, with the performance of the rest of the domains being better than 1.5 SD below average mean. In the “Normal” cluster, none of the scores could be more than 2SD below control mean.
A participant was clustered as “Mildly Impaired” if s/he scored 2–3 SD below the mean on a single cognitive domain, or two domains fell 1.5 to 2 SD below the mean. To be categorized as “Significantly Impaired”, the participant had to score at least >3 SD on a single domain, or at least two domains >2 SD below the control mean (Kremen et al., 2004).
For both approaches, specificity and classification efficiency were calculated to explore the ability to predict conversion to psychosis (broadly), or risk for developing a diagnosis in the schizophrenia spectrum (specifically).
3. Results
Of the 166 CHR participants with neurocognitive data, 54 (32.5%) converted to a psychotic disorder (comparable to the overall study conversion rate of 35%)(Cannon et al., 2008). None of the FH or Controls converted during the follow-up period. Mean time from baseline assessment to psychosis conversion was 11.4 months (SD= 7.0, range 6–30 months). Participants at baseline were 18.4 years of age (SD= 4.6). See Table 2 for baseline demographic, clinical and neurocognitive characteristics and Supplement for between-group comparability analyses.
Table 2.
Baseline demographic and clinical characteristics of the study sample
| A. CHR-C (n=54) | B. CHR-NC (n=112) | C. FH (n=49) | D. NC (n=109) | Statistics | |
|---|---|---|---|---|---|
| Demographic characteristics | |||||
| Age (M, SD) | 18.9(3.9) | 17.8(5.2) | 18.7 (4.1) | 18.8(4.5) | NS |
| Male (n, %) | 37 (68.5) | 70 (62.5) | 23 (46.9) | 48 (44.0) | A> C&D, B>D |
| White (n, %) | 42 (77.8) | 97 (86.6) | 32 (65.3) | 74 (67.9) | B>D |
| Clinical symptomatology: | |||||
| Positive symptoms (M, SD) | 13.2 (4.7) | 11.0 (3.6) | 2.2 (1.6) | .42 (.71) | A>B>C>D |
| Negative symptoms (M, SD) | 15.1 (6.3) | 11.1 (6.8) | 6.8 (6.2) | .72 (1.32) | A>B>C>D |
| Disorganization (M, SD) | 8.3 (4.3) | 5.6 (3.8) | 2.4 (2.7) | .33 (.54) | A>B>C>D |
| General symptoms (M, SD) | 9.2 (4.2) | 7.9 (4.6) | 3.3(44) | .36 (.70) | A & B >C>D |
| Functioning | |||||
| GF: social (M, SD) | 5.4 (1.3) | 6.6 (1.6) | 7.0 (1.3) | 8.6 (.9) | A<B,C<D |
| GF: role (M, SD) | 5.9 (1.4) | 6.3 (1.8) | 6.7 (1.6) | 8.8 (.9) | A<C&D, B<D |
| GAF (M, SD) | 41.4(11.4) | 48.4(12.7) | 68.0(13.1) | 86.8(8.4) | A<B<C<D |
| Neurocognitive functioning1 | |||||
| Vocabulary | −.54(1.09) | −.05(1.10) | −.67 (.80) | .00(1.00) | A&C <B& D |
| Block Design | −.20(1.08) | −.07 (.94) | −.43 (.69) | .00(1.00) | NS |
| Digit Symbol - Coding | −.71 (1.01) | −.59(1.06) | −.65 (.85) | .00(1.00) | A & B & C < D |
| Trail Making Test - B | −.69(1.72) | −.13(1.02) | −.45 (.82) | .00(1.00) | A<B&D; C<D |
| Continuous Performance Test –IP (digits) | −.50 (.86) | −.38(1.05) | −.30 (.98) | .00(1.00) | A&B < D |
| Verbal Fluency | −.64(1.01) | −.40 (.86) | −.54 (.94) | .00(1.00) | A&B < D |
| Wisconsin Card Sorting Test | −.19(1.00) | .15 (.74) | .19 (.78) | .00(1.00) | A<B&C |
| Memory | −.91 (1.55) | −.39(1.24) | −.07 (.87) | .05 (.97) | A<B&C&D; B<D |
For some categories, different tests were used depending on site and age of the participant. Z-scores are therefore reported here (see Table 2 in Seidman et al., 2010 for raw scores) CE1R-C = Clinical High Risk-Converters; CHR-NC = Clinical High Risk – non-converters; FH = Family History of Psychosis in First Degree Relatives; NC = Normal controls
3.1. Neurocognitive profile - cluster analysis
Duda and Hart Je (2)/Je (1) index results (Supplementary Table 1) suggested that a fourcluster solution best distinguished the cases using neurocognitive performance, while generating reasonably sized subgroups (Supplementary Table 2 for baseline characteristics by cluster). We labeled them according to their level of performance: Significantly Impaired (SI; n=33); Mildly Impaired (MI; n=82); Normal (N; n=145) and High Normal (HN; n=64). As shown in Figure 1a, the SI cluster largely distinguishes itself from the rest of the clusters by larger deviations from the control group on the TMT (processing speed; Beta= −.56, p<0.001) and declarative memory (Beta= −.58, p<0.001).
Fig 1.
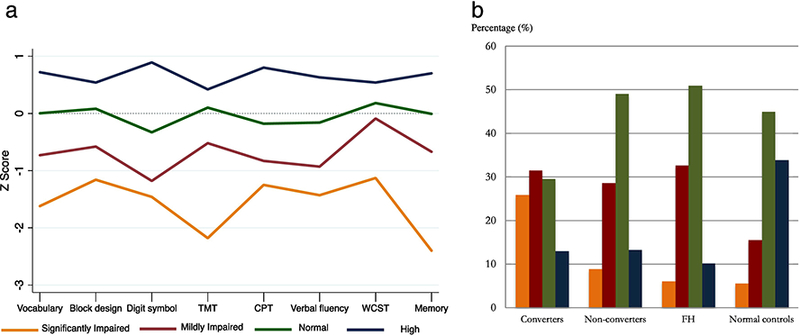
a. Neuropsychological Z-scores by cluster
TMT= trail making test; CPT= continuous performance test; WCST = Wisconsin Card Sorting Test. Magnitude of difference between Significantly Impaired versus the rest of the sample: Vocabulary: Beta= - .42, p<.001; Block Design= −.34, p<.0001; Digit Symbol: Beta = −.28, p<0.001; TMT: Beta= −.56, p<0.001; CPT= −.26, p<0.001; Verbal Fluency: Beta= −.35, p<0.001; WCST: Beta= −.42, p<0.001; Memory: Beta= - .58, p<0.001.
Differences in cognitive performance between the Significantly Impaired group and the rest of the clusters were significant (p<0.05) for all tests
b. Group status by cluster
FH= Family History of Psychosis.
Cluster assignment by baseline group: CHR/Converters= 25.9% Significantly impaired; 31.4% Mildly Impaired; 29.6% Normal; 13.0% High. CHR/Non-converters= 9% Significantly Impaired; 28.6% Mildly Impaired; 49.1% Normal; 13.3% High. FH= 6.1% Significantly Impaired; 32.7% Mildly Impaired; 51.0% Normal; 10.2% High. Controls: 5.5% Significantly Impaired; 15.6% Mildly Impaired; 45.0% Normal; 33.9% High.
Figure 1b depicts group status by proportion of membership in each neurocognitive cluster. Significantly more CHR participants were assigned to the Impaired clusters than to N and HN clusters, with converters disproportionately represented in the SI cluster (X2(9) = 43.44, P < .001).
3.2. Associations between neurocognitive profiles, clinical and functional outcome
3.2.1. Conversion to psychosis
A more impaired cluster profile was predictive of conversion to psychosis after controlling for sex, age and baseline positive symptoms (β = 0.48, se= 0.16, Z= 2.99, p= 0.003, hazard ratio (HR)=1.62, 95% CI= 1.18– 2.22). Figure 2a shows survival curves for the CHR group by neurocognitive clusters.
Fig. 2.
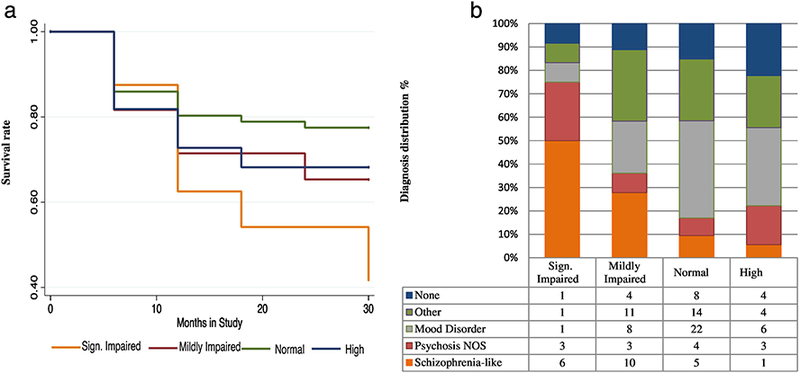
a. Survival curve within CHR population
This Kaplan Meier Survival curve presents the chance to survive the follow-up duration without a psychotic episode. X-axis = time in study (months), Y-axis= survival rate.
b. Follow-up diagnosis within CHR population
Follow-up diagnostic data was available for n=122 out of 166 CHR individuals
Adding negative and disorganized symptoms to a secondary model (removing the largely conceptually overlapping symptoms N6 (Occupational Functioning), and D3 (Trouble with Focus and Attention)) the predictive effect of cluster profile reduced to trend level (β = 0.34, se= 0.17, Z= 1.95, p= 0.05, hazard ratio (HR)=1.29, 95% CI= 1.00– 1.49).
3.2.2. Clinical outcome.
Figure 2b displays significant variation in follow-up diagnosis distributions across neurocognitive clusters (X2 (21) = 33.50; p=0.041). The SI group was most likely to be diagnosed with a schizophrenia-spectrum disorder. Individuals diagnosed with a mood disorder with (n=2) and without (n=35) psychotic features mostly had neurocognitive scores in the HN (14.3%), N (62.9%), and MI (22.9%) range, while there were relatively more individuals with a psychosis NOS diagnosis in the SI range (SI=25%; MI= 8%; N= 8%; HN=17%). Sixteen of 22 (72.3%) participants who had a final diagnosis of schizophrenia had MI or SI neurocognitive profiles.
Figure 3 illustrates the difference in severity of baseline neurocognitive impairment in those with a follow-up diagnosis of schizophrenia versus any other, or no diagnosis (effect sizes are presented in Supplementary Table 3). Deviations were most pronounced on processing speed and memory tasks (TMT, Beta=0.31; Memory, Beta=0.39).
Fig 3.
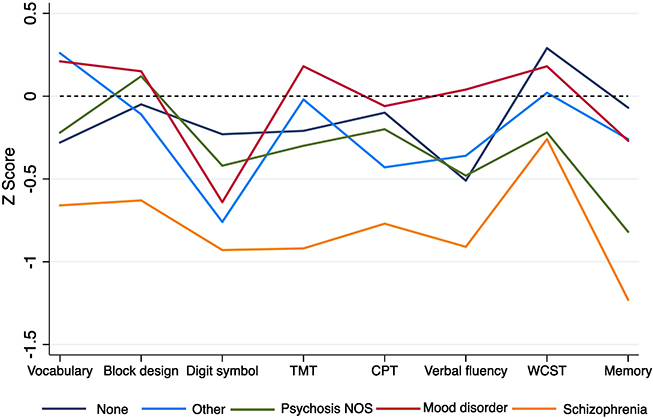
Neuropsychological Z-scores by diagnosis within the CHR sample
3.2.3. Functional outcome.
GF: Social scores and GF: Role scores were significantly worse in the more cognitively impaired groups at baseline (GF:Social: F (3, 263)=24.45, p< .001, GF:Role: F(3, 263) =24.87, p< .001) (see Table 3). These differences were no longer apparent at 6-month follow-up. At month 12, however, social functioning scores were lower for the SI group compared to the rest of the sample (p=.012 compared to the MI group, and p< .001 compared to the N and HN groups), and lower in the MI compared to the N group (p=.004). At month 12, differences in role functioning were only apparent between the SI cluster and HN group (p=.002).
Table 3.
Social and role functioning score distribution by neurocognitive cluster
| A. Significantly Impaired | B. Mildly Impaired | C. Normal | D. High | Statistics | |||||
|---|---|---|---|---|---|---|---|---|---|
| GF: Social | n | M (SD) | n | M (SD) | n | M( SD) | n | M (SD) | |
| Baseline | 27 | 5.3 (1.3) | 71 | 6.2 (1.7) | 120 | 7.1 (1.5) | 49 | 7.9 (1.5) | A<B<C<D |
| 6 Months follow-up | 18 | 5.9 (1.4) | 36 | 6.3 (1.4) | 64 | 6.9 (1.8) | 23 | 7.5 (1.6) | A<D |
| 1 Year follow-up | 10 | 5.4 (1.4) | 31 | 6.7 (1.8) | 56 | 7.4 (1.6) | 22 | 8.3 (1.5) | A<B&C&D; B<D |
| GF:Role | |||||||||
| Baseline | 27 | 5.4 (1.1) | 71 | 6.0 (1.8) | 120 | 7.1 (1.8) | 49 | 8.0 (1.4) | A&B<C<D |
| 6 Months follow-up | 17 | 6.1 (1.5) | 36 | 6.3 (1.4) | 60 | 6.9 (1.6) | 19 | 7.1 (1.3) | NS |
| 1 Year follow-up | 10 | 6.2 (1.6) | 31 | 7.0 (1.7) | 50 | 7.3 (1.5) | 17 | 8.3 (1.2) | A<D |
The regression analyses are controlled for age and gender
Note: The number of subjects assessed on social and role functioning decreased at each follow-up
3.3. Neurocognitive profile - Clinical approach
By definition, there were three a priori defined groups (i.e., there was no HN group). Twenty one individuals were grouped as SI, 51 as MI, and 252 as N (Supplementary Table 4 for baseline characteristics by cluster). While the number of individuals assigned to impaired cognitive groups was lower compared to the cluster analysis (54.5% to 72.7%), the clusters showed similar patterns (Supplementary Figure 1).
3.3.1. Conversion to psychosis.
Worse clinical profile scores were predictive of psychosis after controlling for sex, age and baseline positive symptoms (β = .56, s.e. = 0.18, Z = −2.10, P = 0.036, hazard ratio (HR) = 1.75, 95% CI .21-.91).
Similar to the cluster approach, its predictive effect reduced to trend level when disorganization and negative symptoms were added to a secondary model (ß = 0.35, se= 0.19, Z= 1.86, p= 0.063, hazard ratio (HR)=1.42, 95% CI= 0.98– 2.06).
3.3.2. Clinical outcome.
There was significant variation in follow-up diagnoses across clinical clusters (X2(8) = 19.55; P=0.012; Supplementary Figure 2b). Neurocognitively impaired participants were most likely to be diagnosed with a schizophrenia-spectrum disorder, and 85% of mood-disordered participants were assigned to the N group. However, here the diagnostic distribution did not differ between the MI and SI subgroups (X2 (4) = 4.61; P=0.33), and the percentage with schizophrenia-spectrum diagnoses was marginally higher in the MI group compared to the SI group (43.5 vs 27.3%).
3.3.3. Functional outcome.
Social and role functioning scores at all timepoints were significantly lower for the two impaired neurocognitive clusters compared to the N group (p-values range: p<0.001- p=0.004) (Supplementary table 5). In contrast to the statistical approach, the two cognitively impaired groups did not differ statistically from each other on social or role functioning measures.
3.3.4. Comparison of approaches.
SI group assignment for the cluster analytic and clinical approach had comparable specificity (specificity: 87% (95% CI: 0.79 – 0.92) versus 91% (95% CI: 0.84 – 0.96)) and classification efficiency (classification efficiency: 63% (95% CI: 0.55 – 0.70) versus 66% (95% CI: 0.59 – 0.73)) in predicting conversion to psychosis, as well as conversion to a disorder in the schizophrenia-spectrum (specificity: 94% (95% CI: 0.87 – 0.98) versus 92% (95% CI: 0.85 – 0.96); classification efficiency: 82% (95% CI: 0.73 – 0.88) versus 78% (95% CI: 0.69 – 0.85)).
4. Discussion
To our knowledge, this is the first study to investigate neurocognitive profiles as contributors to outcome heterogeneity in a CHR for psychosis sample. The neurocognitive profiles derived from cluster analysis (SI, MI, N and HN) as well as from clinical decision rules (SI, MI, N) differ primarily on level of performance impairment (i.e. deviations from normal).
The SI cluster derived from cluster analysis distinguished itself from other clusters mostly by larger impairments on processing speed and, especially, memory tasks. Notably, individuals with a SI profile had a conversion rate of 58%, had a 50% chance of developing a schizophrenia spectrum diagnosis (versus 27.8% in the MI, 9.4 % in the N and 5.6% in the HN groups), and had significantly worse functioning scores at baseline and 12-months. Greater impairment was observed in those who subsequently developed schizophrenia in contrast to those with mood disorders. The clear concurrent and predictive associations between baseline neurocognition, conversion to psychosis, and functional and diagnostic outcome demonstrates the clinical relevance of neurocognitive profiles in CHR individuals. Convergent validity was shown by the pattern observed in cluster analysis that was largely reproduced using clinical decision rules, although this method underestimated the number of Impaired cases relative to the cluster analysis. These findings underscore the clinical utility for prediction of broad psychosis outcome and specifically the development of schizophrenia.
These findings elucidate cognitive heterogeneity in terms of the percentages of CHR individuals who are cognitively impaired (44.0% CHR/ 57.4% of converters, SI and MI combined) compared with N (42.8%/ 29.6%) or even HN (13.2%/13.0%) functioning. This affirms the commonsense truism about heterogeneity of neurocognitive functioning, and for the first time demonstrates its scope and consequences for the CHR population. This finding has the potential to influence the way clinicians think about and intervene with their CHR patients. They cannot assume a priori that neurocognitive impairment is present, as CHR individuals range from high functioning to significantly impaired. Given that neurocognitive profiles are significantly related to social and role functioning, and follow-up diagnosis, neurocognitive testing is relevant to the standard patient evaluation.
These data also have implications for treatment, particularly for treatments targeting neurocognition. Cognitive remediation can significantly, albeit modestly, improve cognition in schizophrenia (Keshavan et al., 2014; Wykes et al., 2011). Recently, cognitive remediation has been applied to CHR populations (Hooker et al., 2014; Piskulic et al., 2015) and this approach has considerable promise precisely because the deficits typically observed in CHR populations are milder than in schizophrenia. Even converters appear to manifest smaller decrements prior to conversion compared to typical first-episode schizophrenia patients: Baseline effect sizes in the CHR group who develop schizophrenia-spectrum disorders (in Supplemental Table 2) are approximately 2/3 that of patients with first-episode schizophrenia (Mesholam-Gately et al., 2009). Moreover, our findings have implications for subject selection in cognitive treatment trials, as persons with good (“Normal”) or very good (“High”) neurocognitive functioning are unlikely to benefit much from cognitive remediation. Including them in cognitive enhancement interventions may obscure meaningful results and inadvertently lead to negative conclusions, when in fact differential treatment responses may be moderated by baseline neurocognitive profiles.
This study also elucidates the relationship between neurocognitive profiles and clinical outcomes, such as which CHR individuals are most likely to develop schizophrenia. This question has not been well-studied and to our knowledge, there have been no previous reports directly comparing the baseline neurocognitive profile of CHR individuals who later develop schizophrenia-spectrum vs. mood disorder. Our findings support at least two key points: first, consistent with models of the central impairments in the earliest phases of schizophrenia (Nuechterlein and Dawson, 1984; Seidman, 1983), those who develop schizophrenia are most likely to show relatively severe deficits [effect sizes (Cohen’s d) between 0.6–1.0] in four measures of vigilance/working memory (CPT-IP), and processing speed (Trails, Digit Symbol, Verbal fluency). Secondly, the substantial impairments in schizophrenia contrast notably to those observed in mood disorder, in which neurocognitive functioning is relatively normal, with the exception of Digit Symbol-Coding task performance. This supports the distinction of diagnostic specificity at the neurocognitive level during the prodrome to psychosis, and is consistent with research showing relative specificity of neurocognitive impairments during the premorbid phase (Agnew-Blais et al., 2015; Seidman et al., 2013). These observations are tempered by the low frequency of mood disorders with psychotic features in this sample. Moreover, from an RDoC perspective (Insel, 2014), the differences mainly reflect a severity dimension and distinctly different mechanisms cannot be gleaned from these data.
Declarative memory appears to be the most impaired dimension observed in the SI subgroup. This is consistent with our overall analyses in NAPLS-1 (Seidman et al., 2010), our subsequent findings in NAPLS2 (Seidman et al., 2016), and in meta-analyses (Giuliano et al., 2012). It is notable that this study’s tests included only verbal learning and memory tests, but in the subsequent NAPLS-2 study, visual learning and memory was as impaired as verbal learning and memory (Seidman et al., 2016). Future research should address the neurobiological underpinnings of this memory impairment and whether it evolves over time in people who convert to psychosis, particularly schizophrenia.
Our results also support the notion that there is overlap between the cluster-analytic and clinical methods, as they largely identified similar associations with social and role functioning and other outcomes. However, as in a previous study, in which this clinical method was used in concert with purely statistical analyses (Reichenberg et al., 2009), the clinical method was also more conservative. It is not the purpose of this paper to prove that this specific set of clinical rules is optimal, rather to illustrate through different methods that neurocognitive function in CHR samples is characterized by significant heterogeneity, and that this is of clinical relevance.
4.1. Limitations
This study has several limitations. First, the test battery was limited by the original selection and comparability of tests across federated NAPLS1 sites. In addition, because it is likely that some CHR subjects will convert to psychosis over longer periods of time, “misclassifying” some subjects as nonconverters may have reduced the differences observed in contrasts between converters and nonconverters. We also had limited data on medication status and other treatment exposures. It will be important in future CHR studies to account for the effects of treatment.
Additionally, only 70% had diagnostic interview data at final follow-up. However, because those who did not participate in follow-ups had more symptoms at baseline than those who did (see Supplement), it we may be underestimating the frequency of schizophrenia spectrum diagnosis in the lowest neurocognitive functioning group. Like many similar longitudinal studies, our dropout rate is a limitation. Finally, due to the interdependence of our outcome variables, we chose not to correct our analyses for multiple comparisons.
It is important to note that individual variation is not accounted for with cluster analyses, and replication sometimes yields different results. However, data derived from our clinical approach, independent from cluster analysis, runs counter to the idea that our results would significantly alter with small changes in input data. Both clinical and statistical methods yielded similar patterns, namely that the most pronounced deficits are in memory and processing speed (see Supplement), and had significant associations with functioning and diagnosis, strengthens the validity of the findings. Further research is needed to test which decision rules can be applied in clinical situations.
4.2. Conclusions
This study is the first to indicate that - using two independent approaches – baseline neurocognitive profiles in CHR individuals vary substantially in their severity and are associated with outcome, including outcome diagnosis. This underscores the relevance of neurocognition in prediction of illness progression. Individualized neurocognitive profiling requires replication and testing to determine its promise for personalized treatment for individuals at-risk for psychosis.
Supplementary Material
Acknowledgements:
Jennifer Johnson, PhD, Diane Kirsopp, BA, and Roy Money, MS made significant contributions to the federated NAPLS database. Kristen Woodberry, MSW, PhD, contributed to clinical profile analyses. We dedicate this paper to the memory of Dr. Larry J. Seidman, a devoted and caring mentor and colleague, and a pioneer in research on neurocognition in psychosis.
Role of the funding source: National Institute of Mental Health grants U01MH081928 (Seidman); P50MH066286 (Bearden); U01MH066134 (Addington); R01MH60720 and K24MH76191 (Cadenhead); R01MH65079 (Cannon); K05MH01654 (McGlashan); U01MH066069 and P50 MH064065 (Perkins); RO1MH062066 and U01MH081988 (Walker); U01MH74356, U01 MH082022, and R41MH083436 (Woods); R01MH061523 (Cornblatt). Netherland Organization for Scientific Research VENI 916–15-005 and the Seaver Foundation (Velthorst); Dr. Velthorst, is a Seaver Faculty Scholar. The Staglin Family/IMHRO Music Festival for Mental Health and the Don Levin Trust (Bearden).
Footnotes
Conflict of interest: The authors have declared that there are no conflicts of interest in relation to the subject of this study.The views expressed are those of the authors and do not necessarily reflect the official views of the National Institute of Mental Health, the National Institutes of Health, or any other branch of the US Department of Health and Human Services.
Some elements of this paper were presented at the International Prodromal Research Network in 2011, Colorado by LJ Seidman: “The meaning and utility of neuropsychological measures in the prodrome to psychosis: Group data and classification of individuals”
Publisher's Disclaimer: This is a PDF file of an unedited manuscript that has been accepted for publication. As a service to our customers we are providing this early version of the manuscript. The manuscript will undergo copyediting, typesetting, and review of the resulting proof before it is published in its final citable form. Please note that during the production process errors may be discovered which could affect the content, and all legal disclaimers that apply to the journal pertain.
References:
- Aas M, Dazzan P, Mondelli V, Melle I, Murray RM, Pariante CM, 2014. A systematic review of cognitive function in first-episode psychosis, including a discussion on childhood trauma, stress, and inflammation. Front Psychiatry 4, 182. [DOI] [PMC free article] [PubMed] [Google Scholar]
- Addington J, Cadenhead KS, Cannon TD, Cornblatt B, McGlashan TH, Perkins DO, Seidman LJ, Tsuang M, Walker EF, Woods SW, Heinssen R, North American Prodrome Longitudinal, S., 2007. North American Prodrome Longitudinal Study: a collaborative multisite approach to prodromal schizophrenia research. Schizophr Bull 33(3), 665–672. [DOI] [PMC free article] [PubMed] [Google Scholar]
- Agnew-Blais JC, Buka SL, Fitzmaurice GM, Smoller JW, Goldstein JM, Seidman LJ, 2015. Early Childhood IQ Trajectories in Individuals Later Developing Schizophrenia and Affective Psychoses in the New England Family Studies. Schizophr Bull 41(4), 817–823. [DOI] [PMC free article] [PubMed] [Google Scholar]
- Ahmed AO, Strauss GP, Buchanan RW, Kirkpatrick B, Carpenter WT, 2018. Schizophrenia heterogeneity revisited: Clinical, cognitive, and psychosocial correlates of statistically-derived negative symptoms subgroups. J Psychiatr Res 97, 8–15. [DOI] [PubMed] [Google Scholar]
- Bechi M, Spangaro M, Agostoni G, Bosinelli F, Buonocore M, Bianchi L, Cocchi F, Guglielmino C, Bosia M, Cavallaro R, 2018. Intellectual and cognitive profiles in patients affected by schizophrenia. J Neuropsychol. [DOI] [PubMed] [Google Scholar]
- Bora E, Murray RM, 2014. Meta-analysis of cognitive deficits in ultra-high risk to psychosis and first-episode psychosis: do the cognitive deficits progress over, or after, the onset of psychosis? Schizophr Bull 40(4), 744–755. [DOI] [PMC free article] [PubMed] [Google Scholar]
- Cannon M, Caspi A, Moffitt TE, Harrington H, Taylor A, Murray RM, Poulton R, 2002. Evidence for early-childhood, pan-developmental impairment specific to schizophreniform disorder: results from a longitudinal birth cohort. Arch Gen Psychiatry 59(5), 449–456. [DOI] [PubMed] [Google Scholar]
- Cannon TD, Cadenhead K, Cornblatt B, Woods SW, Addington J, Walker E, Seidman LJ, Perkins D, Tsuang M, McGlashan T, Heinssen R, 2008. Prediction of psychosis in youth at high clinical risk: a multisite longitudinal study in North America. Arch Gen Psychiatry 65(1), 28–37. [DOI] [PMC free article] [PubMed] [Google Scholar]
- Cannon TD, Yu C, Addington J, Bearden CE, Cadenhead KS, Cornblatt BA, Heinssen R, Jeffries CD, Mathalon DH, McGlashan TH, Perkins DO, Seidman LJ, Tsuang MT, Walker EF, Woods SW, Kattan MW, 2016. An Individualized Risk Calculator for Research in Prodromal Psychosis. Am J Psychiatry 173(10), 980–988. [DOI] [PMC free article] [PubMed] [Google Scholar]
- Carrion RE, Cornblatt BA, Burton CZ, Tso IF, Auther AM, Adelsheim S, Calkins R, Carter CS, Niendam T, Sale TG, Taylor SF, McFarlane WR, 2016. Personalized Prediction of Psychosis: External Validation of the NAPLS-2 Psychosis Risk Calculator With the EDIPPP Project. Am J Psychiatry 173(10), 989–996. [DOI] [PMC free article] [PubMed] [Google Scholar]
- Clark SR, Baune BT, Schubert KO, Lavoie S, Smesny S, Rice SM, Schafer MR, Benninger F, Feucht M, Klier CM, McGorry PD, Amminger GP, 2016. Prediction of transition from ultra-high risk to first-episode psychosis using a probabilistic model combining history, clinical assessment and fatty-acid biomarkers. Transl Psychiatry 6(9), e897. [DOI] [PMC free article] [PubMed] [Google Scholar]
- Cornblatt BA, Auther AM, Niendam T, Smith CW, Zinberg J, Bearden CE, Cannon TD, 2007. Preliminary findings for two new measures of social and role functioning in the prodromal phase of schizophrenia. Schizophr Bull 33(3), 688–702. [DOI] [PMC free article] [PubMed] [Google Scholar]
- Cornblatt BA, Carrion RE, Addington J, Seidman L, Walker EF, Cannon TD, Cadenhead KS, McGlashan TH, Perkins DO, Tsuang MT, Woods SW, Heinssen R, Lencz T, 2012. Risk factors for psychosis: impaired social and role functioning. Schizophr Bull 38(6), 1247–1257. [DOI] [PMC free article] [PubMed] [Google Scholar]
- Danaher H, Allott K, Killackey E, Hester R, Cotton S, 2018. An examination of sex differences in neurocognition and social cognition in first-episode psychosis. Psychiatry Res 259, 36–43. [DOI] [PubMed] [Google Scholar]
- Dominguez Mde G, Viechtbauer W, Simons CJ, van Os J, Krabbendam L, 2009. Are psychotic psychopathology and neurocognition orthogonal? A systematic review of their associations. Psychol Bull 135(1), 157–171. [DOI] [PubMed] [Google Scholar]
- Duda ROH, P.E., 1973. Pattern classification and scene analysis. Wiley, New York, NY. [Google Scholar]
- Ferreira LH, DB, 2009. A comparison of hierarchical methods for clustering functional data. Commun. Stat., Simul. Comput 38, 1925–1949 [Google Scholar]
- Frommann I, Pukrop R, Brinkmeyer J, Bechdolf A, Ruhrmann S, Berning J, Decker P, Riedel M, Moller HJ, Wolwer W, Gaebel W, Klosterkotter J, Maier W, Wagner M, 2011. Neuropsychological profiles in different at-risk states of psychosis: executive control impairment in the early--and additional memory dysfunction in the late--prodromal state. Schizophr Bull 37(4), 861–873. [DOI] [PMC free article] [PubMed] [Google Scholar]
- Fusar-Poli P, Borgwardt S, Bechdolf A, Addington J, Riecher-Rossler A, Schultze-Lutter F, Keshavan M, Wood S, Ruhrmann S, Seidman LJ, Valmaggia L, Cannon T, Velthorst E, De Haan L, Cornblatt B, Bonoldi I, Birchwood M, McGlashan T, Carpenter W, McGorry P, Klosterkotter J, McGuire P, Yung A, 2013. The psychosis high-risk state: a comprehensive state-of-the-art review. JAMA Psychiatry 70(1), 107–120. [DOI] [PMC free article] [PubMed] [Google Scholar]
- Fusar-Poli P, Deste G, Smieskova R, Barlati S, Yung AR, Howes O, Stieglitz RD, Vita A, McGuire P, Borgwardt S, 2012. Cognitive functioning in prodromal psychosis: a meta-analysis. Arch Gen Psychiatry 69(6), 562–571. [DOI] [PubMed] [Google Scholar]
- Giuliano AJ, Li H, Mesholam-Gately RI, Sorenson SM, Woodberry KA, Seidman LJ, 2012. Neurocognition in the psychosis risk syndrome: a quantitative and qualitative review. Curr Pharm Des 18(4), 399–415. [DOI] [PubMed] [Google Scholar]
- Goldstein G, Allen DN, Seaton BE, 1998. A comparison of clustering solutions for cognitive heterogeneity in schizophrenia. J Int Neuropsychol Soc 4(4), 353–362. [PubMed] [Google Scholar]
- Goldstein G, Shemansky WJ, 1995. Influences on cognitive heterogeneity in schizophrenia. Schizophr Res 18(1), 59–69. [DOI] [PubMed] [Google Scholar]
- Green MF, 1996. What are the functional consequences of neurocognitive deficits in schizophrenia? Am J Psychiatry 153(3), 321–330. [DOI] [PubMed] [Google Scholar]
- Heinrichs RW, 2005. The primacy of cognition in schizophrenia. Am Psychol 60(3), 229–242. [DOI] [PubMed] [Google Scholar]
- Heinrichs RW, Awad AG, 1993. Neurocognitive subtypes of chronic schizophrenia. Schizophr Res 9(1), 49–58. [DOI] [PubMed] [Google Scholar]
- Heinrichs RW, Ruttan L, Zakzanis KK, Case D, 1997. Parsing schizophrenia with neurocognitive tests: evidence of stability and validity. Brain Cogn 35(2), 207–224. [DOI] [PubMed] [Google Scholar]
- Hill SK, Ragland JD, Gur RC, Gur RE, 2002. Neuropsychological profiles delineate distinct profiles of schizophrenia, an interaction between memory and executive function, and uneven distribution of clinical subtypes. J Clin Exp Neuropsychol 24(6), 765–780. [DOI] [PMC free article] [PubMed] [Google Scholar]
- Hooker CI, Carol EE, Eisenstein TJ, Yin H, Lincoln SH, Tully LM, Dodell-Feder D, Nahum M, Keshavan MS, Seidman LJ, 2014. A pilot study of cognitive training in clinical high risk for psychosis: initial evidence of cognitive benefit. Schizophr Res 157(1–3), 314–316. [DOI] [PMC free article] [PubMed] [Google Scholar]
- Insel TR, 2014. The NIMH Research Domain Criteria (RDoC) Project: precision medicine for psychiatry. Am J Psychiatry 171(4), 395–397. [DOI] [PubMed] [Google Scholar]
- Islam MA, Alizadeh BZ, van den Heuvel ER, Bruggeman R, Cahn W, de Haan L, Kahn RS, Meijer C, Myin-Germeys I, van Os J, Wiersma D, 2015. A comparison of indices for identifying the number of clusters in hierarchical clustering: A study on cognition in schizophrenia patients. Communications in Statistics: Case Studies, Data Analysis and Applications 1(2), 98–113. [Google Scholar]
- Kahn RS, Keefe RS, 2013. Schizophrenia is a cognitive illness: time for a change in focus. JAMA Psychiatry 70(10), 1107–1112. [DOI] [PubMed] [Google Scholar]
- Keshavan MS, Vinogradov S, Rumsey J, Sherrill J, Wagner A, 2014. Cognitive training in mental disorders: update and future directions. Am J Psychiatry 171(5), 510–522. [DOI] [PMC free article] [PubMed] [Google Scholar]
- Kremen WS, Seidman LJ, Faraone SV, Toomey R, Tsuang MT, 2000. The paradox of normal neuropsychological function in schizophrenia. J Abnorm Psychol 109(4), 743–752. [DOI] [PubMed] [Google Scholar]
- Kremen WS, Seidman LJ, Faraone SV, Toomey R, Tsuang MT, 2004. Heterogeneity of schizophrenia: a study of individual neuropsychological profiles. Schizophr Res 71(2–3), 307–321. [DOI] [PubMed] [Google Scholar]
- Lencz T, Smith CW, McLaughlin D, Auther A, Nakayama E, Hovey L, Cornblatt BA, 2006. Generalized and specific neurocognitive deficits in prodromal schizophrenia. Biol Psychiatry 59(9), 863–871. [DOI] [PubMed] [Google Scholar]
- Lewandowski KE, Cohen BM, Ongur D, 2011. Evolution of neuropsychological dysfunction during the course of schizophrenia and bipolar disorder. Psychol Med 41(2), 225–241. [DOI] [PubMed] [Google Scholar]
- Lezak MDH, E.D.; Tranel D, 2013. Neuropsychological Assessment. 5th ed. Oxford University Press, New York, NY. [Google Scholar]
- Mesholam-Gately RI, Giuliano AJ, Goff KP, Faraone SV, Seidman LJ, 2009. Neurocognition in first-episode schizophrenia: a meta-analytic review. Neuropsychology 23(3), 315–336. [DOI] [PubMed] [Google Scholar]
- Meyer EC, Carrion RE, Cornblatt BA, Addington J, Cadenhead KS, Cannon TD, McGlashan TH, Perkins DO, Tsuang MT, Walker EF, Woods SW, Heinssen R, Seidman LJ, group N, 2014. The relationship of neurocognition and negative symptoms to social and role functioning over time in individuals at clinical high risk in the first phase of the North American Prodrome Longitudinal Study. Schizophr Bull 40(6), 1452–1461. [DOI] [PMC free article] [PubMed] [Google Scholar]
- Michel C, Ruhrmann S, Schimmelmann BG, Klosterkotter J, Schultze-Lutter F, 2014. A stratified model for psychosis prediction in clinical practice. Schizophr Bull 40(6), 1533–1542. [DOI] [PMC free article] [PubMed] [Google Scholar]
- Miller TJ, McGlashan TH, Rosen JL, Somjee L, Markovich PJ, Stein K, Woods SW, 2002. Prospective diagnosis of the initial prodrome for schizophrenia based on the Structured Interview for Prodromal Syndromes: preliminary evidence of interrater reliability and predictive validity. Am J Psychiatry 159(5), 863–865. [DOI] [PubMed] [Google Scholar]
- Nuechterlein KH, Dawson ME, 1984. Information processing and attentional functioning in the developmental course of schizophrenic disorders. Schizophr Bull 10(2), 160–203. [DOI] [PubMed] [Google Scholar]
- Nuechterlein KH, Subotnik KL, Ventura J, Green MF, Gretchen-Doorly D, Asarnow RF, 2012. The puzzle of schizophrenia: tracking the core role of cognitive deficits. Dev Psychopathol 24(2), 529–536. [DOI] [PubMed] [Google Scholar]
- Ohi K, Shimada T, Nemoto K, Kataoka Y, Yasuyama T, Kimura K, Okubo H, Uehara T, Kawasaki Y, 2017. Cognitive clustering in schizophrenia patients, their first-degree relatives and healthy subjects is associated with anterior cingulate cortex volume. Neuroimage Clin 16, 248–256. [DOI] [PMC free article] [PubMed] [Google Scholar]
- Piskulic D, Barbato M, Liu L, Addington J, 2015. Pilot study of cognitive remediation therapy on cognition in young people at clinical high risk of psychosis. Psychiatry Res 225(1–2), 93–98. [DOI] [PubMed] [Google Scholar]
- Reichenberg A, Caspi A, Harrington H, Houts R, Keefe RS, Murray RM, Poulton R, Moffitt TE, 2010. Static and dynamic cognitive deficits in childhood preceding adult schizophrenia: a 30-year study. Am J Psychiatry 167(2), 160–169. [DOI] [PMC free article] [PubMed] [Google Scholar]
- Reichenberg A, Harvey PD, 2007. Neuropsychological impairments in schizophrenia: Integration of performance-based and brain imaging findings. Psychol Bull 133(5), 833–858. [DOI] [PubMed] [Google Scholar]
- Reichenberg A, Harvey PD, Bowie CR, Mojtabai R, Rabinowitz J, Heaton RK, Bromet E, 2009. Neuropsychological function and dysfunction in schizophrenia and psychotic affective disorders. Schizophr Bull 35(5), 1022–1029. [DOI] [PMC free article] [PubMed] [Google Scholar]
- Schulz SC, Murray A, 2016. Assessing cognitive impairment in patients with schizophrenia. J Clin Psychiatry 77 Suppl 2, 3–7. [DOI] [PubMed] [Google Scholar]
- Seidman LJ, 1983. Schizophrenia and brain dysfunction: an integration of recent neurodiagnostic findings. Psychol Bull 94(2), 195–238. [PubMed] [Google Scholar]
- Seidman LJ, 1990. The neuropsychology of schizophrenia: a neurodevelopmental and case study approach. J Neuropsychiatry Clin Neurosci 2(3), 301–312. [DOI] [PubMed] [Google Scholar]
- Seidman LJ, 1994. Listening, meaning and empathy in neuropsychological disorders: Case examples of assessment and treatment, in: Ellison J, Weinstein CS, Hodel-Malinofsky T (Eds.), Psychotherapist’s guide to neuropsychiatric patietns: Diagnostic and treatment issues. American Psychiatric Press, Inc., Washington DC, pp. 1–22. [Google Scholar]
- Seidman LJ, Cassens G, Kremen WS, Pepple JR, 1992. The neuropsychology of schizophrenia, in: White RF (Ed.), Clinical Syndromes in Adult Neuropsychology: The Practitioner’s Handbook. Elsevier, Amsterdam, pp. 381–449. [Google Scholar]
- Seidman LJ, Cherkerzian S, Goldstein JM, Agnew-Blais J, Tsuang MT, Buka SL, 2013. Neuropsychological performance and family history in children at age 7 who develop adult schizophrenia or bipolar psychosis in the New England Family Studies. Psychol Med 43(1), 119–131. [DOI] [PMC free article] [PubMed] [Google Scholar]
- Seidman LJ, Giuliano AJ, Meyer EC, Addington J, Cadenhead KS, Cannon TD, McGlashan TH, Perkins DO, Tsuang MT, Walker EF, Woods SW, Bearden CE, Christensen BK, Hawkins K, Heaton R, Keefe RS, Heinssen R, Cornblatt BA, North American Prodrome Longitudinal Study, G., 2010. Neuropsychology of the prodrome to psychosis in the NAPLS consortium: relationship to family history and conversion to psychosis. Arch Gen Psychiatry 67(6), 578–588. [DOI] [PMC free article] [PubMed] [Google Scholar]
- Seidman LJ, Shapiro DI, Stone WS, Woodberry KA, Ronzio A, Cornblatt BA, Addington J, Bearden CE, Cadenhead KS, Cannon TD, Mathalon DH, McGlashan TH, Perkins DO, Tsuang MT, Walker EF, Woods SW, 2016. Association of Neurocognition With Transition to Psychosis: Baseline Functioning in the Second Phase of the North American Prodrome Longitudinal Study. JAMA Psychiatry 73(12), 1239–1248. [DOI] [PMC free article] [PubMed] [Google Scholar]
- Van Rheenen TE, Lewandowski KE, Tan EJ, Ospina LH, Ongur D, Neill E, Gurvich C, Pantelis C, Malhotra AK, Rossell SL, Burdick KE, 2017. Characterizing cognitive heterogeneity on the schizophrenia-bipolar disorder spectrum. Psychol Med 47(10), 1848–1864. [DOI] [PubMed] [Google Scholar]
- Weickert TW, Goldberg TE, Gold JM, Bigelow LB, Egan MF, Weinberger DR, 2000. Cognitive impairments in patients with schizophrenia displaying preserved and compromised intellect. Arch Gen Psychiatry 57(9), 907–913. [DOI] [PubMed] [Google Scholar]
- Williams JB, Gibbon M, First MB, Spitzer RL, Davies M, Borus J, Howes MJ, Kane J, Pope HG Jr., Rounsaville B, et al. , 1992. The Structured Clinical Interview for DSM-III-R (SCID). II. Multisite test-retest reliability. Arch Gen Psychiatry 49(8), 630–636. [DOI] [PubMed] [Google Scholar]
- Woodberry KA, Giuliano AJ, Seidman LJ, 2008. Premorbid IQ in schizophrenia: a meta-analytic review. Am J Psychiatry 165(5), 579–587. [DOI] [PubMed] [Google Scholar]
- Woodberry KA, Shapiro DI, Bryant C, Seidman LJ, 2016. Progress and Future Directions in Research on the Psychosis Prodrome: A Review for Clinicians. Harv Rev Psychiatry 24(2), 87–103. [DOI] [PMC free article] [PubMed] [Google Scholar]
- Woods SW, Walsh BC, Addington J, Cadenhead KS, Cannon TD, Cornblatt BA, Heinssen R, Perkins DO, Seidman LJ, Tarbox SI, Tsuang MT, Walker EF, McGlashan TH, 2014. Current status specifiers for patients at clinical high risk for psychosis. Schizophr Res 158(1 −3), 69–75. [DOI] [PMC free article] [PubMed] [Google Scholar]
- Wykes T, Huddy V, Cellard C, McGurk SR, Czobor P, 2011. A meta-analysis of cognitive remediation for schizophrenia: methodology and effect sizes. Am J Psychiatry 168(5), 472–485. [DOI] [PubMed] [Google Scholar]
Associated Data
This section collects any data citations, data availability statements, or supplementary materials included in this article.