

Abstract
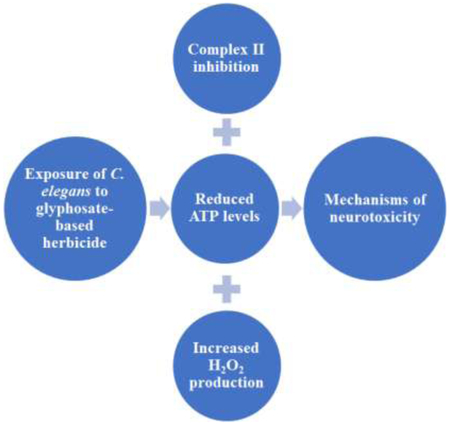
Glyphosate-based herbicides, such as Touchdown (TD) and Roundup, are among the most heavily-used herbicides in the world. While the active ingredient is generally considered non-toxic, the toxicity resulting from exposure to commercially-sold formulations is less clear. In many cases, cell cultures or various model organisms exposed to glyphosate formulations show toxicity and, in some cases, lethality. Using Caenorhabditis elegans, we assessed potential toxic mechanisms through which a highly-concentrated commercial formulation of TD promotes neurodegeneration. Following a 30-minute treatment, we assayed mitochondrial electron transport chain function and reactive oxygen species (ROS) production. Initial oxygen consumption studies indicated general mitochondrial inhibition compared to controls (*p < 0.05). When Complex II activity was further assessed, inhibition was observed in all TD-treated groups (*p < 0.05). Complex IV activity, however, was not adversely affected by TD. This electron transport chain inhibition also resulted in reduced ATP levels (*p < 0.05). Furthermore, hydrogen peroxide levels, but not other ROS, were increased (*p < 0.05). Taken together, these data indicate that commercially-available formulations of TD may exert neurotoxicity through Complex II (succinate dehydrogenase) inhibition, decreased ATP levels, and increased hydrogen peroxide production.
Keywords: Glyphosate, C elegans, mitochondrial inhibition, oxygen consumption, reactive oxygen species, hydrogen peroxide
Graphical Abstract
1.0. Introduction1
The increased use of pesticide-resistant crops (e.g., corn, soy, and wheat) has been accompanied by an upsurge in the total amount of pesticides applied each year (Benbrook 2012). The majority of these pesticides, sold and applied as a combination of patent-protected formulations of active ingredients and adjuvants, are applied by workers in industrial agricultural settings (Grube et al. 2011). The most widely-used pesticides in the world are herbicides formulated with glyphosate as the active ingredient (Grube et al. 2011). While there are many proprietary mixtures of commercially-available glyphosate herbicides, the two most common formulations are sold under the names of Roundup and Touchdown (TD), which are manufactured by Monsanto and Syngenta, respectively (Anonymous 2013). From a human health prospective, it is important to note that numerous neurodegenerative diseases (Allen and Levy 2013; Baltazar et al. 2014), various cancers (Alavanja et al. 2013; Engel et al. 2005), and even neurobehavioral disorders (Roberts and Karr 2012) have been associated with pesticide exposure. Most of these diseases are marked by increased oxidative stress, reactive oxygen species (ROS) production, and/or mitochondrial inhibition (Abdul-Aziz et al. 2015; Celardo et al. 2014; Mostafalou and Abdollahi 2013). Consequently, regulatory bodies are increasingly faced with questions regarding the potential toxicity of glyphosate formulations and their implications for human and animal health.
Similar to other studies of commercially-available pesticides, previous research on glyphosate-based herbicides focused on the toxicity of the active ingredient, glyphosate, rather than formulations. These studies show that a large dose of glyphosate is required in rats (oral LD50 = 2,000 mg/kg) and mice (oral LD50 = 10,000 mg/kg) to produce lethality (Tomlin 2006). More recently, however, a greater appreciation for the toxicity of commercial formulations, the mixtures to which people and animals are actually exposed, has caused researchers to shift their concern from examining the toxicity of pure glyphosate to that of the applied preparations (de Liz Oliveira Cavalli et al. 2013; Mesnage et al. 2014; Peixoto 2005). In many reports, the agricultural formulation is much more toxic than either glyphosate alone (Benachour and Seralini 2009; Chaufan et al. 2014; Mesnage et al. 2014), or the putative surfactants that may be present in the formulation (Kim et al. 2013).
Considering the reports documenting greater potency and efficacy, our studies used commercially available TD. Our previous work showed that exposure to varying concentrations of TD led to morphological changes in multiple neuronal populations in Caenorhabditis elegans (C. elegans) (Negga et al. 2011; Negga et al. 2012). The mechanisms contributing to this neurodegeneration, however, have yet to be determined. As both mitochondrial inhibition and increased ROS production are common disease mechanisms (Chakraborty et al. 2013; Wang et al. 2013), our current studies assess whether TD could initiate these processes. While mitochondrial respiration studies are often conducted in isolated mitochondrial fractions, we completed these assays in vivo using C. elegans to assess the effects of TD on intact mitochondria in living organisms. As such, we first sought to determine whether exposure of C. elegans to TD specifically inhibited mitochondrial electron transport chain complexes. Since mitochondrial inhibition can also lead to oxidative stress, we then assessed whether TD exposure led to increases in overall ROS production or changes in levels of distinct ROS in vivo.
2.0. Materials and Methods
2.1. Worm and Escherichia coli strains.
Wild-type (N2) nematodes, as well as NA22 Escherichia coli (E. coli) and OP50-1 E. coli were obtained from the Caenorhabditis Genetics Center (CGC).
2.2. Synchronization.
C. elegans were maintained at 20°C and synchronized according to standard protocols (Brenner 1974), and as previously published (Negga et al. 2011). Briefly, C. elegans were grown on 8P plates (51.3 mM NaCl, 25.0 g bactoagar/L, 20.0 g bactopeptone/L, 1mM CaCl2, 0.5 mM KH2PO4 (pH 6), 13 μM cholesterol (95% ethanol), 1 mM MgSO4) with NA22 E. coli (cultured in 16 g tryptone/L, 10 g yeast extract/L, 85.5 mM NaCl) until gravid. Eggs were isolated from gravid worms using a hypochlorite solution (0.55% NaOCl, 500 μM NaOH). The egg/bleach mixture was diluted with M9 solution (20 mM KH2PO4, 40 mM Na2HPO4, 68 mM NaCl) followed by separation of eggs using a 30% sucrose solution. Eggs were then resuspended with M9 and nutated for 18 h at 20°C.
2.3. Treatments.
Worms were exposed to TD as previously published (Negga et al. 2011; Settivari et al. 2013). Briefly, 5,000 worms/treatment group were exposed for 30 min to 3.0% glyphosate as TD, 7.0% glyphosate as TD, or 10.0% glyphosate as TD (Touchdown® Hitech, formulation of 52.3% glyphosate, Syngenta AG, Wilmington, DE). To facilitate comparison of our results with other glyphosate-containing pesticides, concentrations are reported as percent active ingredient (glyphosate) rather than percent overall pesticide formulation. At the conclusion of the incubation, worms were washed with sterile dH2O and returned to nematode growth media plates (NGM plates; 51.3 mM NaCl, 17.0 g bactoagar/L, 2.5 g bactopeptone/L, 1 mM CaCl2, 1 mM MgSO4, 500 μM KH2PO4 (pH 6.0), 13 μM cholesterol (95% ethanol), 1.25 mL nystatin/L, 200 mg streptomycin/L) with a lawn of OP50-1 E. coli for 24 h at 20°C to recover from the treatment. Since concentrated TD used in industrial agriculture is diluted to the appropriate application concentration for spraying with water (Monsanto 2014; Syngenta 2010), control worms were treated with sterile dH2O.
2.4. Mitochondrial Assays
2.4.1. Oxygen Consumption Studies.
Worms post-treatment and recovery were counted and normalized to yield standardized groups of 10,000 live worms/mL/treatment concentration. Worms and M9 were added to heated (22°C) water bath chambers (YSI 5301B Standard Bath), and an oxygen probe (YSI 5304) was inserted and re-equilibrated in the sample chamber. Oxygen consumption measurements were recorded every ten seconds for a total of five minutes to assess oxygen consumption and general inhibition of mitochondrial respiration.
2.4.2. Complex II activity.
Following the 24-hour recovery period, worms were washed from plates with sterile M9, and samples were normalized to yield 1,000 live worms/mL/treatment concentration. Following fixation and permeabilization (Grad et al. 2007), Complex II activity was assayed using 5 mM ethylenediaminetetraacetic acid (EDTA), 1 mM KCN, 200 μM phenazine methosulfate, 50 mM sodium succinate, 250 μM nitroblue tetrazolium (NBT) in 10 mL phosphate buffered saline (PBS) per published protocols (Grad et al. 2007). To verify that the assay measured succinate dehydrogenase activity, a negative control was used containing sodium malonate without the inclusion of sodium succinate. After incubation in the assay solution, stained worms were washed and counted to yield 250 worms/treatment group. Worms were pipetted into a 96-well plate, and absorbance read at 560 nm using a Promega® GloMax-Multi+ Detection System (Promega Corporation, Madison, WI).
2.4.3. Complex IV activity.
Similar to Complex II preparation, worms were washed and counted to yield 1,000 worms/mL/treatment group. Following fixation and permeabilization, Complex IV activity was assayed using 10 mg 0.1% (w/v) 3,3’-diaminobenzidine (DAB), 10 mg 0.1% (w/v) cytochrome-C, 2 mg 0.02% (w/v) catalase in 10 mL PBS (Grad et al. 2007). Potassium cyanide (KCN), without the addition of cytochrome c, was used as a negative control. Stained worms were read at 450 nm as described in Section 2.4.2.
2.4.4. Proton gradient integrity.
Post-recovery worms normalized to yield 1,000 worms/mL/treatment group. To determine proton gradient integrity, worms were assayed using 9.71 mM tetramethylrhodamine ethyl ester (TMRE; Biotium, Hayward, CA) in dimethyl sulfoxide (DMSO; yielding a final concentration of 50 μM TMRE in 0.5% DMSO). C. elegans were incubated for 1 h, and then photographed using a digital camera attached to a fluorescence microscope (see Section 2.6.).
2.4.5. Relative ATP amount.
Worms were washed and counted to yield 500 live worms/treatment group. Relative ATP concentration was measured using the Promega Mitochondrial ToxGlo™ Assay kit (Promega Corporation, Madison, WI). To verify the assay, a negative control was used containing either KCN (30 min incubation) or sodium azide (24 h incubation). Per the kit protocol provided, 20 μL of the fluorogenic peptide substrate was added and incubated at 20°C for 60 min to determine percent live worms compared to control. Fluorescence was measured with an excitation wavelength of 495 nm and an emission wavelength of 520-530 nm using a Promega® GloMax-Multi+ Detection System. Next, 100 μL of a luciferin-containing ATP detection reagent was added to each well and incubated at room temperature for 15 min. Luminescence was also measured using the Promega® GloMax-Multi+ Detection System.
2.5. Reactive oxygen species detection
2.5.1. Superoxide detection.
Following recovery, worms normalized to 5,000 live worms/mL/treatment group. One mL of this worm solution was centrifuged, and 10 μL of supernatant was removed and replaced with 10 μL of 500 μM dihydroethidium (DHE; Merck KGaA, Darmstadt, Germany) for a final concentration of 5 μM DHE. Tubes were then vortexed and placed on a nutator at 20°C for 3 h. DHE fluorescence was assessed by photomicrograph analysis at the conclusion of the incubation period.
2.5.2. Hydrogen peroxide detection.
Following recovery, worms were removed from NGM plates, washed, and normalized to yield an average of 4 live worms/μL/treatment group. A total of 200 worms per group was added to a 96-well plate. To the negative control, 50 μL of 1X reaction buffer supplied with the Amplex® Red kit (Life Technologies, Grand Island, NY) was added, while the positive control had 50 μL of 10 μM H2O2. Next, 50 μL of the Amplex® Red mixture was added to all groups. The plate was covered with aluminum foil to protect the reaction mixture from light, placed on a nutator, and incubated at room temperature for 1 h. Afterwards, fluorescence was read with an excitation wavelength of 525 nm and an emission wavelength of 580-640 nm using a Promega® GloMax-Multi+ Detection System.
2.5.3. Hydroxyl radical detection.
Immediately following the 30-min incubation with TD (no recovery period), worms were washed with sterile dH2O, and live worms were counted to yield 1,000 worms/mL/treatment group. Worms were placed in microcentrifuge tubes with 500 μL of hydroxyphenyl fluorescein (HPF) probe (Life Sciences, Grand Island, NY) and 500 μL of worms. Each group was incubated for 1.5 h at 20°C. Following incubation, worms were washed and counted again to yield 250 live worms in each well. Fluorescence was read at an excitation wavelength of 490 nm and an emission wavelength of 510-570 nm using a Promega® GloMax- Multi+ Detection System.
2.6. Fluorescence microscopy
For studies involving TMRE fluorescence, photomicrographs were taken with worms on a 4% agarose pad per the protocol already published (Negga et al. 2012). Fluorescence photomicrographs were obtained using a Leitz & Wetzlar (Halco Instruments, Inc) microscope equipped with a 50-W AC mercury source lamp (E. Leitz, Rockleigh, NJ), filter for red fluorescence, and 40X objective (Leitz & Wetzlar, Halco Instruments, Inc.) coupled to a digital camera (Micrometrics, MilesCo Scientific, Princeton, MN) operated by Micrometrics software (SE Premium, v2.7). Images were obtained under identical levels of exposure time, gain, gamma, and saturation. Photomicrographs were then imported into Adobe Photoshop 6.0.1, to determine red (TMRE) pixel intensity ± standard error of the mean (SEM).
2.8. Statistical analysis
All data were analyzed using GraphPad Prism (version 6.07 for Windows, GraphPad Software, San Diego California USA, www.graphpad.com). For oxygen consumption studies, data are presented as mean consumption, and represent N ≥ 4 separate synchronizations, with n ≥ 3 intra-experimental replicates. Differences in slope were determined using linear regression followed by one-way analysis of variance (ANOVA) of the regression lines. If the ANOVA resulted in an overall significant p value (p < 0.05), a post-hoc Dunnett’s multiple comparison test was performed.
Data are presented as mean ± SEM, and represent N ≥ 3 separate synchronizations with n ≥ 3 intra-experimental replication. One-way ANOVA, followed by a post-hoc Dunnett’s multiple comparison test, was used for plate reader-based studies. For TMRE studies, pixel intensity of individual worms (n > 5 for each independent replication) was measured. Data were considered to be statistically significantly different from control when *p < 0.05.
3.0. Results
3.1. Decreased Oxygen Consumption
To assess overall oxygen consumption and mitochondrial respiration following exposure to TD, oxygen consumption in whole worms was measured (Figure 1). Linear regression analysis indicated that acute treatment with all TD concentrations resulted in a statistically significant decrease in percent oxygen consumed during the equilibration phase of the assay (***p < 0.001).
Figure 1:

TD-Induced Mitochondrial Inhibition. Following TD exposure, N2 (wildtype) worms consumed statistically significantly more oxygen consumed compared to any of the TD treated groups. .Data are presented as mean percent oxygen consumed with the respective regression lines, and represent N ≥ 4 separate synchronizations **p < 0.01, ***p < 0.001 compared to controls.
3.2. Decreased Complex II Activity
While oxygen consumption data provided us with a general indication of mitochondrial function, we wanted to interrogate Complex II individually because previous reports using glyphosate herbicide formulations showed Complex II inhibition in isolated mitochondria (Peixoto 2005). Following treatment and recovery, C. elegans were incubated with the electron acceptor NBT. In the presence of functioning Complex II, NBT is reduced, resulting in the formation of a blue precipitate (Grad et al. 2007). Absorbance data were analyzed for each TD concentration (Figure 2), and indicated that all concentrations resulted in statistically significant decreases in NBT conversion compared to controls (*p < 0.05, **p < 0.01 or ***p < 0.001), but not to each other.
Figure 2:

Direct Complex II activity assessment. Treatment with TD indicated a statistically significant decrease in absorbance compared to control worms. Data are presented as mean absorbance ± SEM and represent N ≥ 4 separate synchronizations. **p < 0.01, ***p < 0.001 compared to controls.
3.3. Increased Complex IV Activity
Since others had reported that Complex IV activity was unaffected in isolated mitochondria treated with Roundup (Peixoto 2005), we wanted to assess Complex IV activity in worms to verify that our results were similar to those from isolated mitochondria. Here, we used the electron donator DAB, which when oxidized by active Complex IV forms a brown precipitate (Grad et al. 2007). Analysis of DAB conversion absorbance data (Figure 3) indicated that treatment with 7.0% TD resulted in a statistically significant increase in absorbance compared to control (***p < 0.001). Although a trend was present for the other two concentrations, increased DAB oxidation did not reach the level of statistical significance.
Figure 3:

Complex IV activity following TD treatment. Following treatment with 7.0% TD, N2 worms showed a statistically significant increase in absorbance. Data are presented as mean absorbance ± SEM and represent N ≥ 4 separate synchronizations. ***p < 0.001 compared to controls.
3.4. Decreased Proton Gradient Integrity
To further ascertain whether mitochondrial function was impaired by TD treatment, TMRE was used to assay the integrity of the proton gradient. TMRE accumulates within active mitochondria due to the presence of an intact proton gradient (Δψ). Following exposure to TD and TMRE, analysis of red pixel number indicated that only treatment with 10.0% TD resulted in a statistically significant decrease (*p < 0.05) compared to control (Figure 4).
Figure 4:

Proton gradient integrity following TD treatment. Only worms treated with the highest concentration of TD showed a statistically significant decrease in number of red pixels. Data are presented as mean pixel intensity ± SEM, and represent N ≥ 3 separate synchronizations. *p < 0.05 compared to control.
3.5. Decreased Relative ATP Levels
Relative ATP concentrations were measured using a luminescent probe specific for ATP to further assess mitochondrial function (Figure 5A). Results showed a statistically significant decrease in ATP production compared to control for all TD concentrations. To verify that decreased ATP levels were not due to increased mortality, a fluorogenic peptide substrate was used to detect necrotic protease activity (Figure 5B). Results indicated no statistically significant difference among any groups, suggesting that decreased ATP was not due to increased lethality.
Figure 5:


Relative ATP amount following TD treatment of N2 worms. Following treatment with 3.0% or 10.0% TD, analysis indicated a statistically significant decrease in luminescence, a measure of ATP levels (A), but no statistically significant change in fluorescence, a measure of viability/lethality (B). *p < 0.05, **p < 0.01, ***p < 0.001 compared to controls.
3.6. Unchanged Superoxide Levels
In light of mitochondrial inhibition, we also wanted to assess whether oxidative stress was increased in C. elegans following exposure to TD. Initially we used DHE to determine superoxide production. DHE is oxidized in the presence of resulting in the formation of a red fluorescent product (Michalski et al. 2014; Peshavariya et al. 2007). Analysis of red pixel number indicated that there was no statistically significant difference between treatment groups compared to controls (data not shown).
3.7. Increased Hydrogen Peroxide Levels
Since no significant production was detected, we assessed whether hydrogen peroxide (H2O2) was formed. We chose to look at this ROS next because a one-electron transfer to could yield H2O2, and thus explain the lack of in the previous studies. Following exposure of worms to TD, Amplex®Red was added to assay tubes. Analysis indicated that TD treatment at all three concentrations resulted in a statistically significant increase in H2O2 production (Figure 6) compared to control worms (***p < 0.001 for 3.0% TD; *p < 0.05 for 7.0% TD; and **p < 0.01 for 10.0% TD).
Figure 6:

Hydrogen peroxide following TD treatment. Treatment at all concentrations of TD showed a statistically significant increase in fluorescence compared to control. Data are presented as mean intensity ± SEM and represent N ≥ 3 separate synchronizations. *p < 0.05, **p < 0.01, ***p < 0.001 compared to control.
3.8. Unchanged Hydroxyl Radical Levels
Finally, since hydroxyl radicals (•OH) can be produced from a one-electron transfer to H2O2, we measured this ROS following exposure to TD. To this end, C. elegans exposed to varying concentrations of TD were further exposed to HPF. In the presence of •OH, this probe is oxidized and fluoresces. Analysis indicated that there was no statistically significant difference among any of the groups (data not shown).
4.0. Discussion
Previous research comparing the toxicity of glyphosate alone or the commercially-available formulation of RoundUp (RU; Monsanto) showed that RU was significantly more toxic than glyphosate alone in numerous cell culture systems (Benachour and Seralini 2009; Kim et al. 2013; Mesnage et al. 2014). This differential toxicity was also observed in vitro using isolated mitochondria (Olorunsogo et al. 1979; Peixoto 2005). Based on these reports and our previous research showing various levels of neurodegeneration in C. elegans (Negga et al. 2011; Negga et al. 2012), we sought to test the hypothesis that mitochondrial inhibition and/or oxidative stress could be possible mechanisms through which the glyphosate-containing herbicide Touchdown (TD) exerts its toxicity. The concentrations used in the current studies are consistent with application concentrations recommended for agricultural use (Monsanto 2014; Syngenta 2010). For example, glyphosate herbicide formulations are typically sold as “ready-for-use” concentrations of approximately 3% glyphosate, or as concentrated formulations of 37.0-53.2% glyphosate, which are diluted with water to final concentrations ranging from 0.4-2.2% for field application and 20-30% for spot application (Syngenta 2010). While some human data are available for glyphosate blood levels in women and children (Knudsen et al. 2017; Kongtip et al. 2017), these populations are typically not the same one that are applying the pesticide in agricultural or industrial settings. Doses for rodent studies are often based on good laboratory practice (GLP) no-observed adverse effect levels (NOAELs), which can be less than a single exposure level to which workers can be exposed (Romano et al. 2010; Tang et al. 2017). It is for these reasons that we used application concentrations for these studies.
Our initial oxygen consumption studies allowed us to assess general mitochondrial inhibition. The results (Figure 1) showed an overall decrease in oxygen consumption (Figure 1), suggesting that basal mitochondrial respiration is reduced because of TD treatment. Since oxygen consumption measures the downstream effect of electron transfer to oxygen, we moved to histochemical assays to determine the function of individual complexes. Based on previous studies using isolated mitochondria exposed to RU (Peixoto 2005), our primary focus next shifted to Complex II and Complex IV.
To assess Complex II activity, we used NBT, which changes color following Complex II-dependent reduction. Consistent with data from Peixoto (2005), we also measured a decrease in Complex II activity related to its ability to reduce NBT. Furthermore, the inhibition was not concentration-dependent at the concentrations we used, suggesting these were above the no observable adverse effect level (NOAEL) for this particular endpoint. Given the fact that our concentrations were within those typically recommended by manufacturers (Monsanto 2014; Syngenta 2010) these data could have important implications for future studies in rodents, and for human health. More research is needed in this area, however.
Since previous studies indicated that Complex IV was not a target of glyphosate formulations (Peixoto 2005), we next used DAB to assess the Complex IV function in our in vivo model system. Complex IV accepts electrons from reduced cytochrome c, but in our assay DAB is the electron carrier. When DAB is oxidized it leads to a color change that can measured spectrophotometrically. Thus, inhibited Complex IV would be unable to accept electrons from DAB, and the resulting absorbance would be less than that of controls. On the other hand, if Complex IV absorbance is increased relative to controls, the data suggest that Complex IV is functional, but electron starved, i.e., electron deficient due to a lack of electrons from up-stream complexes. Not only did we show that Complex IV is not a target of TD (Figure 3), we showed that it had a greater capacity to accept electrons relative to controls, as evidenced by the increased absorption. Data from this assay therefore implies that electron transport chain (ETC) enzymes upstream of Complex IV (e.g., Complex III) may be more sensitive targets.
Based on the oxygen consumption and ETC data, we were somewhat surprised by the fact that the proton gradient was only statistically significantly decreased at the highest TD concentration (Figure 4). All of the ETC enzymes except Complex II are responsible for maintaining the proton gradient (Figure 7). As such, our TMRE data are entirely compatible with Complex II inhibition, and further suggests that Complex III may also be involved. Although the proton gradient was minimally adversely affected by TD, we still measured lower ATP levels in all treatment groups (Figure 5). This was most prominent at the highest TD concentration, and is consistent with the general decrease in mitochondrial inhibition we observed in the oxygen consumption data (Figure 1). Consistent with mitochondrial inhibition, we also observed increased ROS production (Figure 6).
Figure 7:

Schematic of the electron transport chain. Complex II does not contribute to the formation of the proton gradient, which may explain our TMRE data. Reactive oxygen species are normally formed during mitochondrial respiration, particularly at Complexes I and III. Superoxide dismutase (SOD) and glutathione peroxidase (GPX) are responsible for the detoxication of these ROS. Typically an increase in superoxide is associated with Complex I inhibition, and hydrogen peroxide (H2O2) formation is more common with Complex III inhibition.
It is important to note that many pesticides used to model Parkinson’s disease inhibit mitochondria (Keeney et al. 2006; Testa et al. 2005) and/or increase oxidative stress (McCormack et al. 2005). Classic toxicants used in Parkinson’s disease research (e.g., 6-hydroxydopamine and 1-methyl-4-phenyl-1,2,3,6-tetrahydropyridine) also exert their toxicity through similar mechanisms of action (Schober 2004). Clinically, both mitochondrial inhibition and increased ROS are observed in patients with Parkinson’s disease (Celardo et al. 2014; Hauser and Hastings 2013), as well as other neurodegenerative diseases (Barnham et al. 2004; Lin and Beal 2006). As occupational exposure to glyphosate-containing herbicides (and other pesticides) often occurs multiple times during a growing season, it is imperative to determine if these agrochemicals contribute to mitochondrial inhibition or increased oxidative stress in order to better understand what types of personal protective equipment may be advisable for these workers.
While C. elegans is a simple model organism that is quite evolutionarily distant from humans, these worms still provides valuable information for future studies in higher organisms (Teschendorf and Link 2009). Furthermore, numerous human disease-relevant gene homologues and orthologues related to neurotransmitter synthesis, transport, catabolism and clearance, and receptors (Bargmann and Kaplan 1998; Chase and Koelle 2007; Jin 2005) are highly conserved in C. elegans. As such, C. elegans are widely-used in various toxicology and neurodegenerative studies (Wolozin et al. 2011) to refine and reduce the number of studies required in mammals.
Here, we demonstrate that C. elegans acutely exposed to occupationally-relevant concentrations of TD exhibit mitochondrial inhibition and oxidative stress in vivo. Given these findings, we suggest that additional work is required in higher organisms using the pesticide formulations to better characterize potential risk of neurodegeneration in humans.
Highlights.
C. elegans exposed to agriculturally-relevant concentrations of glyphosate-containing herbicide show mitochondrial inhibition
Complex II inhibition is confirmed
ATP levels are statistically significantly reduced in treated worms
Hydrogen peroxide concentrations are increased in treated worms
Acknowledgments
Funding
This work was supported by the National Institute of Environmental Health Sciences [R15 ES015628 to V.A.F], the Edward Burke Endowed Chair (V.A.F.), and National Institutes of Health Office of Research Infrastructure Programs [P40 OD010440 to the Caenorhabditis Genetics Center].
1Abbreviations
- TD
TouchDown
- ROS
Reactive oxygen species
- C. elegcms
Caenorhabditis elegans
- CGC
Caenorhabditis Genetics Center
- NGM
Nematode growth media
- EDTA
Ethylenediaminetetraacetic acid
- PBS
Phosphate buffered saline
- DAB
Diaminobenzidine
- NADP
β-Nicotinamide adenine dinucleotide phosphate
- NBT
Nitroblue tetrazolium
- TMRE
Tetramethylrhodamine ethyl ester
- DMSO
Dimethyl sulfoxide
- DHE
Dihydroethidium
- HPF
Hydroxyphenyl fluorescein
- GST
Glutathione-S-transferase
- RU
RoundUp
Footnotes
Publisher's Disclaimer: This is a PDF file of an unedited manuscript that has been accepted for publication. As a service to our customers we are providing this early version of the manuscript. The manuscript will undergo copyediting, typesetting, and review of the resulting proof before it is published in its final citable form. Please note that during the production process errors may be discovered which could affect the content, and all legal disclaimers that apply to the journal pertain.
References
- Abdul-Aziz A, MacEwan DJ, Bowles KM and Rushworth SA 2015. Oxidative Stress Responses and NRF2 in Human Leukaemia. Oxid Med Cell Longev, p. 454659. [DOI] [PMC free article] [PubMed] [Google Scholar]
- Alavanja MC, Ross MK and Bonner MR 2013. Increased Cancer Burden Among Pesticide Applicators and Others Due to Pesticide Exposure. CA Cancer J Clin 63, 120–42. 10.3322/caac.21170. [DOI] [PubMed] [Google Scholar]
- Allen MT and Levy LS 2013. Parkinson's Disease and Pesticide Exposure--a New Assessment. Crit Rev Toxicol 43, 515–34. 10.3109/10408444.2013.798719. [DOI] [PubMed] [Google Scholar]
- Anonymous. 2013. Top 10 Agchem Firms Obtained Solid Sales Growth in 2012. Agropages.com, http://news.agropages.com/News/NewsDetail---10138.htm#top. [Google Scholar]
- Baltazar MT, Dinis-Oliveira RJ, de Lourdes Bastos M, Tsatsakis AM, Duarte JA and Carvalho F 2014. Pesticides Exposure as Etiological Factors of Parkinson's Disease and Other Neurodegenerative Diseases--A Mechanistic Approach. Toxicol Lett 230, 85–103. 10.1016/j.toxlet.2014.01.039. [DOI] [PubMed] [Google Scholar]
- Bargmann CI and Kaplan JM 1998. Signal Transduction in the Caenorhabditis elegcms Nervous System. Annu Rev Neurosci 21, 279–308. [DOI] [PubMed] [Google Scholar]
- Barnham KJ, Masters CL and Bush AI 2004. Neurodegenerative Diseases and Oxidative Stress. Nat Rev Drug Discov 3, 205–14. 10.1038/nrd1330. [DOI] [PubMed] [Google Scholar]
- Benachour N and Seralini GE 2009. Glyphosate Formulations Induce Apoptosis and Necrosis in Human Umbilical, Embryonic, and Placental Cells. Chem Res Toxicol 22, 97–105. [DOI] [PubMed] [Google Scholar]
- Benbrook CM 2012. Impacts of Genetically Engineered Crops on Pesticide Use in the U.S.-The First Sixteen Years. Environmental Sciences Europe 24, 1–13. [Google Scholar]
- Brenner S 1974. The Genetics of Caenorhabditis Elegcms. Genetics 77, 71–94. [DOI] [PMC free article] [PubMed] [Google Scholar]
- Celardo I, Martins LM and Gandhi S 2014. Unravelling Mitochondrial Pathways to Parkinson's Disease. Br J Pharmacol 171, 1943–57. 10.1111/bph.12433. [DOI] [PMC free article] [PubMed] [Google Scholar]
- Chakraborty S, Bornhorst J, Nguyen TT and Aschner M 2013. Oxidative Stress Mechanisms Underlying Parkinson's Disease-Associated Neurodegeneration in C. elegans. Int J Mol Sci 14, 23103–28. 10.3390/ijms141123103. [DOI] [PMC free article] [PubMed] [Google Scholar]
- Chase DL and Koelle MR 2007. Biogenic Amine Neurotransmitters in C. elegans. WormBook, 1–15. [DOI] [PMC free article] [PubMed] [Google Scholar]
- Chaufan G, Coalova I and Rios de Molina Mdel C 2014. Glyphosate Commercial Formulation Causes Cytotoxicity, Oxidative Effects, and Apoptosis on Human Cells: Differences with Its Active Ingredient. Int J Toxicol 33, 29–38. 10.1177/1091581813517906. [DOI] [PubMed] [Google Scholar]
- de Liz Oliveira Cavalli VL, Cattani D, Heinz Rieg CE, Pierozan P, Zanatta L, Benedetti Parisotto E, Wilhelm Filho D, Mena Barreto Silva FR, Pessoa-Pureur R and Zamoner A 2013. Roundup Disrupts Male Reproductive Functions by Triggering Calcium-Mediated Cell Death in Rat Testis and Sertoli Cells. Free Radic Biol Med 65, 335–46. 10.1016/j.freeradbiomed.2013.06.043. [DOI] [PubMed] [Google Scholar]
- Engel LS, Hill DA, Hoppin JA, Lubin JH, Lynch CF, Pierce J, Samanic C, Sandler DP, Blair A and Alavanja MC 2005. Pesticide Use and Breast Cancer Risk among Farmers' Wives in the Agricultural Health Study. Am J Epidemiol 161, 121–35. [DOI] [PubMed] [Google Scholar]
- Grad LI, Sayles LC and Lemire BD 2007. Isolation and Functional Analysis of Mitochondria from the Nematode Caenorhabditis elegans. In: Leister D and Herrmann J (Eds), Methods in Molecular Biology: Mitochondria: Practical Protocols, Humana Press Inc, Totowa, NJ. [DOI] [PubMed] [Google Scholar]
- Grube A, Donaldson D, Kiely T and Wu L 2011. Pesticides Industry Sales and Usage: 2006 and 2007 Market Estimates In: United States Environmental Protection Agency (Ed), Biological and Economic Analysis Division, Office of Pesticide Programs. [Google Scholar]
- Hauser DN and Hastings TG 2013. Mitochondrial Dysfunction and Oxidative Stress in Parkinson's Disease and Monogenic Parkinsonism. Neurobiol Dis 51, 35–42. 10.1016/j.nbd.2012.10.011. [DOI] [PMC free article] [PubMed] [Google Scholar]
- Jin Y 2005. Synaptogenesis. In: Jorgensen E and Kaplan J (Eds), Wormbook, The C. elegans Research Community. [Google Scholar]
- Keeney PM, Xie J, Capaldi RA and Bennett JP Jr. 2006. Parkinson's Disease Brain Mitochondrial Complex I Has Oxidatively Damaged Subunits and Is Functionally Impaired and Misassembled. J Neurosci 26, 5256–64. [DOI] [PMC free article] [PubMed] [Google Scholar]
- Kim YH, Hong JR, Gil HW, Song HY and Hong SY 2013. Mixtures of Glyphosate and Surfactant Tn20 Accelerate Cell Death Via Mitochondrial Damage-Induced Apoptosis and Necrosis. Toxicol In Vitro 27, 191–7. 10.1016/j.tiv.2012.09.021. [DOI] [PubMed] [Google Scholar]
- Knudsen LE, Hansen PW, Mizrak S, Hansen HK, Morck TA, Nielsen F, Siersma V and Mathiesen L 2017. Biomonitoring of Danish School Children and Mothers Including Biomarkers of Pbde and Glyphosate. Rev Environ Health 32, 279–90. 10.1515/reveh-2016-0067. [DOI] [PubMed] [Google Scholar]
- Kongtip P, Nankongnab N, Phupancharoensuk R, Palarach C, Sujirarat D, Sangprasert S, Sermsuk M, Sawattrakool N and Woskie SR 2017. Glyphosate and Paraquat in Maternal and Fetal Serums in Thai Women. J Agromedicine 22, 282–9. 10.1080/1059924X.2017.1319315. [DOI] [PubMed] [Google Scholar]
- Lin MT and Beal MF 2006. Mitochondrial Dysfunction and Oxidative Stress in Neurodegenerative Diseases. Nature 443, 787–95. 10.1038/nature05292. [DOI] [PubMed] [Google Scholar]
- McCormack AL, Atienza JG, Johnston LC, Andersen JK, Vu S and Di Monte DA 2005. Role of Oxidative Stress in Paraquat-Induced Dopaminergic Cell Degeneration. J Neurochem 93, 1030–7. [DOI] [PubMed] [Google Scholar]
- Mesnage R, Defarge N, Spiroux de Vendomois J and Seralini GE 2014. Major Pesticides Are More Toxic to Human Cells Than Their Declared Active Principles. Biomed Res Int 2014, 179691 10.1155/2014/179691. [DOI] [PMC free article] [PubMed] [Google Scholar]
- Michalski R, Michalowski B, Sikora A, Zielonka J and Kalyanaraman B 2014. On the Use of Fluorescence Lifetime Imaging and Dihydroethidium to Detect Superoxide in Intact Animals and ex vivo Tissues: A Reassessment. Free Radic Biol Med 67, 278–84. 10.1016/j.freeradbiomed.2013.10.816. [DOI] [PMC free article] [PubMed] [Google Scholar]
- Monsanto. 2014. Roundup® Ready-to-Use Weed & Grass Killer III with One-Touch Wand. [Google Scholar]
- Mostafalou S and Abdollahi M 2013. Pesticides and Human Chronic Diseases: Evidences, Mechanisms, and Perspectives. Toxicol Appl Pharmacol 268, 157–77. 10.1016/j.taap.2013.01.025. [DOI] [PubMed] [Google Scholar]
- Negga R, Rudd DA, Davis NS, Justice AN, Hatfield HE, Valente AL, Fields AS and Fitsanakis VA 2011. Exposure to Mn/Zn Ethylene-bis-Dithiocarbamate and Glyphosate Pesticides Leads to Neurodegeneration in Caenorhabditis elegans. Neurotoxicology 32, 331–41. 10.1016/j.neuro.2011.02.002. [DOI] [PMC free article] [PubMed] [Google Scholar]
- Negga R, Stuart JA, Machen ML, Salva J, Lizek AJ, Richardson SJ, Osborne AS, Mirallas O, McVey KA and Fitsanakis VA 2012. Exposure to Glyphosate- and/or Mn/Zn-Ethylene-bis-Dithiocarbamate-Containing Pesticides Leads to Degeneration of Gamma-Aminobutyric Acid and Dopamine Neurons in Caenorhabditis elegans. Neurotox Res 21, 281–90. 10.1007/s12640-011-9274-7.. [DOI] [PMC free article] [PubMed] [Google Scholar]
- Olorunsogo OO, Bababunmi EA and Bassir O 1979. Effect of Glyphosate on Rat Liver Mitochondria in vivo. Bull Environ Contam Toxicol 22, 357–64. [DOI] [PubMed] [Google Scholar]
- Peixoto F 2005. Comparative Effects of the Roundup and Glyphosate on Mitochondrial Oxidative Phosphorylation. Chemosphere 61, 1115. [DOI] [PubMed] [Google Scholar]
- Peshavariya HM, Dusting GJ and Selemidis S 2007. Analysis of Dihydroethidium Fluorescence for the Detection of Intracellular and Extracellular Superoxide Produced by NADPH Oxidase. Free Radic Res 41, 699–712. 10.1080/10715760701297354. [DOI] [PubMed] [Google Scholar]
- Roberts JR and Karr CJ 2012. Pesticide Exposure in Children. Pediatrics 130, e1765–88. [DOI] [PMC free article] [PubMed] [Google Scholar]
- Romano RM, Romano MA, Bernardi MM, Furtado PV and Oliveira CA 2010. Prepubertal Exposure to Commercial Formulation of the Herbicide Glyphosate Alters Testosterone Levels and Testicular Morphology. Arch Toxicol 84, 309–17. 10.1007/s00204-009-0494-z. [DOI] [PubMed] [Google Scholar]
- Schober A 2004. Classic Toxin-Induced Animal Models of Parkinson's Disease: 6-OHDA and MPTP. Cell Tissue Res 318, 215–24. [DOI] [PubMed] [Google Scholar]
- Settivari R, VanDuyn N, LeVora J and Nass R 2013. The NRF2/SKN-1-Dependent Glutathione-S-Transferase Pi Homologue Gst-1 Inhibits Dopamine Neuron Degeneration in a Caenorhabditis elegans Model of Manganism. Neurotoxicology 38, 51–60. 10.1016/j.neuro.2013.05.014.. [DOI] [PMC free article] [PubMed] [Google Scholar]
- Syngenta. 2010. Touchdown Hi Tech. In: Syngenta (Ed), Product Label, Syngenta Crop Protection, Greensboro, NC. [Google Scholar]
- Tang J, Hu P, Li Y, Win-Shwe TT and Li C 2017. Ion Imbalance Is Involved in the Mechanisms of Liver Oxidative Damage in Rats Exposed to Glyphosate. Front Physiol 8, 1083 10.3389/fphys.2017.01083. [DOI] [PMC free article] [PubMed] [Google Scholar]
- Teschendorf D and Link CD 2009. What Have Worm Models Told Us About the Mechanisms of Neuronal Dysfunction in Human Neurodegenerative Diseases? Mol Neurodegener 4, 38. [DOI] [PMC free article] [PubMed] [Google Scholar]
- Testa CM, Sherer TB and Greenamyre JT 2005. Rotenone Induces Oxidative Stress and Dopaminergic Neuron Damage in Organotypic Substantia Nigra Cultures. Molecular Brain Research 134, 109. [DOI] [PubMed] [Google Scholar]
- Tomlin CDS 2006. The Pesticide Manual: A World Compendium British Crop Protection Council: Hampshire, UK, , pp. 545–8. [Google Scholar]
- Wang X, Wang W, Li L, Perry G, Lee HG and Zhu X 2013. Oxidative Stress and Mitochondrial Dysfunction in Alzheimer's Disease. Biochim Biophys Acta 1842, 1240–7. 10.1016/j.bbadis.2013.10.015. [DOI] [PMC free article] [PubMed] [Google Scholar]
- Wolozin B, Gabel C, Ferree A, Guillily M and Ebata A 2011. Watching Worms Whither: Modeling Neurodegeneration in C. elegcms. Prog Mol Biol Transl Sci 100, 499–514. [DOI] [PMC free article] [PubMed] [Google Scholar]