Abstract
Background:
B cells may be involved in the pathophysiology of multiple sclerosis (MS). Inebilizumab (formerly MEDI-551) binds to and depletes CD19+ B cells.
Objectives:
To assess safety, tolerability, pharmacokinetics, pharmacodynamics and immunogenicity of inebilizumab in adults with relapsing MS.
Methods:
This phase 1 trial randomised 28 patients 3:1 (21, inebilizumab; 7, placebo) to inebilizumab (2 intravenous (IV) doses, days 1 and 15: 30, 100 or 600 mg; or single subcutaneous (SC) dose on day 1: 60 or 300 mg) or matching placebo, with follow-up until at least week 24 or return of CD19+ B-cell count to ⩾80 cells/µL.
Results:
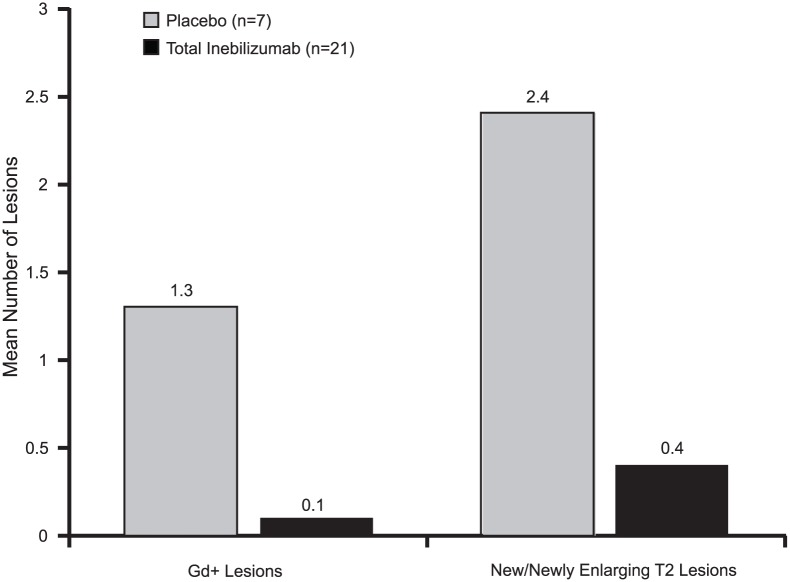
Complete B-cell depletion was observed across all doses. Infusion/injection (grade 1/2) reactions occurred in 6/15 patients receiving inebilizumab IV, 2/5 placebo IV and 1/6 inebilizumab SC. Serious adverse events occurred in three patients receiving inebilizumab: pyrexia, mixed-drug intoxication (unrelated to inebilizumab; resulted in death) and urinary tract infection. Mean number of cumulative new gadolinium-enhancing lesions over 24 weeks was 0.1 with inebilizumab versus 1.3 with placebo; mean numbers of new/newly enlarging T2 lesions were 0.4 and 2.4, respectively.
Conclusion:
Inebilizumab had an acceptable safety profile in relapsing MS patients and showed a trend in reductions in new/newly enlarging and gadolinium-enhancing lesions.
Keywords: B cells, intravenous administration, pharmacodynamics, pharmacokinetics, subcutaneous administration
Introduction
Multiple sclerosis (MS) is a chronic, immune-mediated disease of the central nervous system (CNS) with focal, multifocal and diffuse inflammation characterised by demyelination and gliosis as a result of immune cell infiltration across the blood–brain barrier. The neurologic signs and symptoms of the disease are highly variable and dependent upon the location of lesions in the CNS. Disability accumulates over time and may include cognitive deficits and motor impairments.
Although MS is considered to be a disorder involving primarily T cells, an increasing body of evidence now supports a role of B cells in the pathogenesis of MS through antibody-dependent and antibody-independent mechanisms.1–3 Patients suffering from severe relapses who fail to respond to treatment with high-dose corticosteroids benefit from plasmapheresis,4 thus suggesting a role of the humoral response in the disease. Regulatory B cells secreting interleukin (IL)-10, an immunoregulatory cytokine that downregulates the immune response and controls inflammation, are found in lower numbers in the peripheral blood of MS patients than in healthy controls.5 A higher clinical progression rate has been found in patients with relapsing and secondary progressive MS who possess high B-cell and low monocyte numbers in the cerebrospinal fluid (CSF).6 In addition to antibody production, B cells also play a key role in antigen presentation in experimental autoimmune encephalomyelitis (EAE) models. CNS-resident B cells also have been shown to induce cytokine production and activation of infiltrating T cells.3
B-cell depletion therapy with anti-CD20 monoclonal antibodies, such as rituximab and ocrelizumab, has shown clinical benefit in patients with relapsing-remitting MS.7,8 During B-cell development, CD20 is expressed on pro-B cells through memory B cells. CD19 is expressed at an earlier stage in B-cell development, appearing on early pro-B cells, and persists through maturation to plasmablasts and some plasma cells (PCs).9,10 The clinical implications of this differential expression of CD19 are not known. Preclinical data suggest that the elimination of CD19+ plasmablasts and some PCs could provide a greater clinical effect in B-cell–driven autoimmune diseases.11 Patients with MS were shown to have greater numbers of CD19+ B cells in the blood than healthy controls.12 Short-lived plasmablasts expressing CD19 have been suggested to be a primary effector B-cell population involved in ongoing active inflammation in patients with MS.3,13 Therefore, there is a scientific rationale for depleting CD19+ B cells in patients with relapsing forms of MS.
Inebilizumab (formerly MEDI-551; MedImmune, Gaithersburg, MD, USA), a humanised, afucosylated IgG1κ monoclonal antibody, binds to and depletes CD19+ B cells.14 Afucosylation of inebilizumab results in an approximately 10-fold increased affinity for the activating Fcγ receptor IIIA and significantly enhances antibody-dependent cellular cytotoxicity of effector cells. In a mouse EAE model, administration of inebilizumab reduced the incidence and severity of disease and prevented the development of EAE when given prior to induction.15 This phase 1 dose escalation study was designed to determine the safety and tolerability profile of ascending intravenous (IV) and subcutaneous (SC) doses of inebilizumab in patients with relapsing forms of MS.
Methods
This was a multicentre, randomised, blinded, placebo-controlled, dose escalation, phase 1 study (clinicaltrials.gov identifier: NCT01585766). The primary end point was safety and tolerability of ascending IV and SC doses of inebilizumab. Secondary end points included evaluations of pharmacokinetics, pharmacodynamics and immunogenicity. Exploratory objectives included evaluation of the effect of inebilizumab on magnetic resonance imaging (MRI) outcomes, including the number of new gadolinium (Gd)-enhancing lesions and the number of new or newly enlarging T2 lesions, relapse, Expanded Disability Status Scale (EDSS) scores and tetanus titres. An independent data monitoring and safety committee was established to review safety data on an ongoing basis and to provide guidance on trial continuation, modification or termination.
Patients
Eligible patients were aged 18–65 years with confirmed relapsing forms of MS defined by the McDonald 2010 criteria,16 with at least one relapse (Appendix 1) in the last 3 years, EDSS score ⩽6.5, normal baseline CD19 B-cell count (>80 cells/μL) and no more than 20 Gd-enhancing lesions on MRI. Key exclusion criteria were abnormal liver function tests and low immunoglobulin, neutrophil, platelet, haemoglobin or total lymphocyte counts. In addition, patients who had received at any time total lymphoid irradiation, cladribine, mitoxantrone, cyclophosphamide or T-cell vaccination were excluded, as were patients who had received monthly treatment with a corticosteroid as disease modification for relapsing MS or who had received an IV or high-dose oral corticosteroid for an MS exacerbation within 30 days prior to the study.
The following washout periods were required for prior medications: 1 month for interferon beta and glatiramer acetate; 3 months for fingolimod, dimethyl fumarate, intravenous immunoglobulin therapy and plasmapheresis; 6 months for cyclosporine, azathioprine, methotrexate, mycophenolate and teriflunomide; 1 year for patients who received natalizumab for more than 3 months; and 1 year for monoclonal antibodies.
Design and treatment
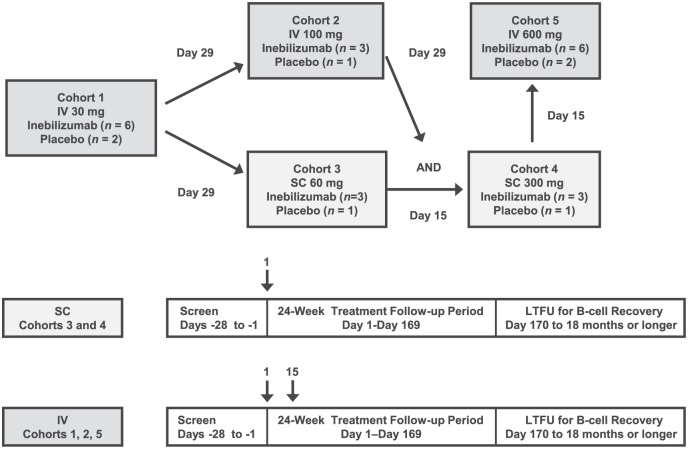
Following a screening period of up to 28 days, patients were randomised as follows. The investigator or designee entered eligible subjects’ names and relevant information into an interactive voice-response system (IVRS). The IVRS then assigned subjects in a 3:1 ratio in six cohorts to receive inebilizumab 30, 100 or 600 mg IV on days 1 and 15, or inebilizumab 60 or 300 mg SC on day 1, or matching placebo (Figure 1). Study site personnel and patients were blinded to treatment; the study sponsor’s staff members were not blinded. Patients who received IV inebilizumab were premedicated with IV methylprednisolone 100 mg or equivalent, oral acetaminophen 500–650 mg or equivalent, and oral diphenhydramine 25–50 mg or equivalent 30–60 minutes prior to infusion to reduce risk of possible infusion reactions. The study comprised three study periods: screening (day −28 to day −1), treatment/follow-up (day 1 to day 169) and long-term follow-up for B-cell recovery (day 170 to 18 months or longer).
Figure 1.
Study design. The number of patients in each group included those who received inebilizumab and those who received placebo. The SC cohorts received inebilizumab or placebo on day 1 only; the IV cohorts received inebilizumab or placebo at days 1 and 15. Long-term follow-up occurred for patients with reduced B-cell counts at week 24.
IV: intravenous; LTFU: long-term follow-up; SC: subcutaneous.
Study outcomes and procedures
Safety and tolerability were assessed by evaluation of adverse events (AEs) and serious AEs (SAEs) for each dose and for the route of administration, as well as by laboratory evaluations and physical examinations. Blood was collected before dosing for pharmacokinetic analysis at weeks 0, 1, 2, 4, 8, 12, 16, 20 and 24; in the IV cohorts, blood was also collected after dosing for pharmacokinetic analysis at weeks 0 and 2. Blood was collected for B-cell count, B-cell subsets and immunoglobulins (including total immunoglobulin, immunoglobulin G (IgG), IgM, IgA and IgE) at weeks 0, 2, 4, 8, 12, 16, 20 and 24, and during long-term follow-up. Blood was collected for analysis of anti-inebilizumab antibodies at weeks 0, 4, 12 and 24 and every 3 months thereafter during long-term follow-up.
Patients were followed until their CD20 B-cell counts returned to the lower limit of normal (80 cells/µL) or baseline; patients who did not meet these criteria at 24 weeks entered long-term follow-up for B-cell repletion. Because the presence of inebilizumab in samples interferes with CD19-based detection of B cells by flow cytometry, both CD19+ and CD20+ B cells were measured in this study.
The effect of inebilizumab on reductions in the number of PCs was evaluated using the PC gene signature method, a robust, sensitive and accurate measure of PCs in clinical samples.17 The relative change in PC numbers was evaluated by whole-genome microarray analysis of blood samples obtained at various time points following treatment.
Cranial MRI with and without Gd contrast was performed at screening and at weeks 4, 8, 12, 16, 20 and 24 for cohort 1 only (30 mg IV) and at weeks 12, 16, 20 and 24 for cohorts 2 through 5. All scans were sent to a central MRI laboratory where a blinded read was performed for the interpretation used for analysis. The EDSS scores were assessed at weeks 0, 12 and 24 and at relapse.
Statistical analysis
Sample sizes were based on clinical judgement but not on statistical criteria as done in a typical phase 1 study. The analysis of the study results was based on the safety population, which included all patients who received any amount of investigational product. A non-compartmental pharmacokinetic analysis was performed. The proportion of patients free of new inflammatory activity (i.e. no Gd-enhancing lesions and no new or newly enlarging T2 lesions) and the proportion of patients who were relapse free were calculated. Safety, pharmacokinetic, pharmacodynamic and clinical activity data were summarised descriptively.
Ethical considerations
The study was conducted in accordance with the principles of the Declaration of Helsinki, the International Conference on Harmonisation guidelines on good clinical practice, any applicable laws and requirements, and any conditions required by local regulatory authorities and/or institutional review boards. All patients provided written informed consent.
Results
Patients
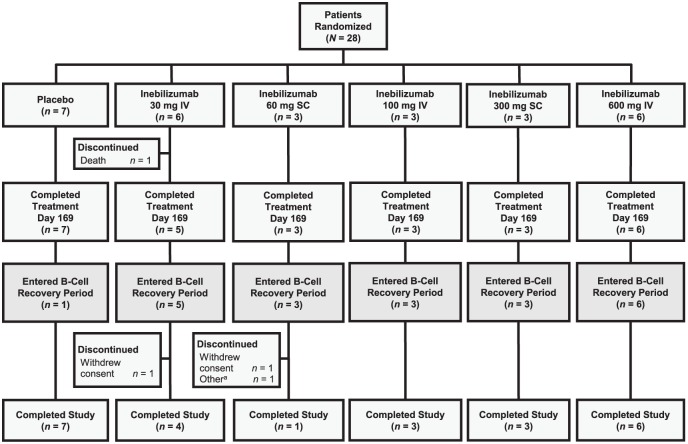
A total of 28 patients were randomised into the following treatment groups: inebilizumab 30 mg IV (n = 6), inebilizumab 60 mg SC (n = 3), inebilizumab 100 mg IV (n = 3), inebilizumab 300 mg SC (n = 3), inebilizumab 600 mg IV (n = 6), and placebo IV or SC (n = 7). In all, 27 patients, 20 in the inebilizumab groups overall and 7 in the placebo group, completed the protocol-defined treatment period (day 169/week 24) (Figure 2); one patient in the inebilizumab 30-mg IV group died during the study. Of the 27 patients who completed week 24, 1 patient (14.3%) in the IV or SC placebo group and 20 patients (95.2%) in the inebilizumab groups (5 patients in the 30-mg IV group; 3 each in the 60-mg SC, 100-mg IV and 300 mg-SC groups; and 6 in the 600-mg IV groups) entered long-term follow-up for B-cell recovery monitoring. Patient demographics and baseline disease characteristics are summarised in Table 1. Briefly, most patients were female and White (68% and 82%, respectively). The median baseline EDSS score was 4.0 (range, 0–6.5), the mean number of Gd-enhancing lesions at baseline was 0.9 (range, 0–4), and the mean absolute CD19+ B-cell count was 215.5 cells/μL (range, 83.5–693.0). Patients in the inebilizumab group had a higher number of Gd-enhancing lesions, a greater volume of T2 lesions and a higher EDSS score at baseline than the placebo group (Table 1).
Figure 2.
Patient disposition. In all, 28 patients were randomised, 27 patients completed through end of treatment (day 169/week 24) and 24 patients completed the study.
aSubject did not complete the study owing to investigator decision.
IV: intravenous; SC: subcutaneous.
Table 1.
Patient demographics and baseline characteristics.
| Parameter | Placebo (n = 7) | Total inebilizumab (n = 21) | Total (N = 28) |
|---|---|---|---|
| Age, median (range), years | 42 (21–62) | 44 (28–65) | 44 (21–65) |
| Female, n (%) | 6 (86) | 13 (62) | 19 (68) |
| Male, n (%) | 1 (14) | 8 (38) | 9 (32) |
| Race, n (%) | |||
| White | 5 (71) | 18 (86) | 23 (82) |
| Black | 2 (29) | 1 (5) | 3 (11) |
| Other/multiple | 0 | 2 (9) | 2 (7) |
| Age at MS symptom onset, median (range), years | 26 (14–50) | 30 (21–60) | 30 (14–60) |
| Age at MS diagnosis, median (range), years | 33 (17–59) | 33 (22–63) | 33 (17–63) |
| EDSS score, median (range) | 3.0 (1.5–5.0) | 4.0 (0–6.5) | 4.0 (0–6.5) |
| Number of Gd+ lesions, mean (SD) | 0.4 (1.13) | 1.1 (1.30) | 0.9 (1.27) |
| Volume of T2 brain lesions, median (range), cm3 | 6.46 (1.54–26.56) | 14.44 (1.25–55.92) | 12.31 (1.25–55.92) |
| CD19+ cell absolute count, median (range), cells/µL | 146.5 (83.5–281.0) | 216.5 (101.0–693.0) | 215.5 (83.5–693.0) |
| Prior disease-modifying therapies | |||
| Antineoplastic agentsa | 0 | 1 (6) | 1 (5) |
| Antipsoriaticsb | 0 | 1 (6) | 1 (5) |
| Corticosteroids (systemic use)c | 1 (33) | 3 (19) | 4 (21) |
| Immunoglobulins | 0 | 1 (6) | 1 (5) |
| Immunostimulantsd | 3 (100) | 13 (81) | 16 (84) |
| Immunosuppressantse | 0 | 5 (31) | 5 (26.3%) |
EDSS: Expanded Disability Status Scale; Gd+: gadolinium-enhancing; MS: multiple sclerosis; SD: standard deviation.
Chlormethine hydrochloride.
Fumaric acid.
Methylprednisolone, prednisone.
Albumin (human + glucose + interferon beta), glatiramer acetate, interferon, interferon beta and interferon beta-1a.
Azathioprine, ciclosporin, fingolimod, natalizumab.
Safety, tolerability and immunogenicity
Most treatment-related AEs observed in the inebilizumab treatment groups up to week 24 were single events. The most frequently seen AEs in the inebilizumab group included nasopharyngitis (24%), upper respiratory tract infection (19%), urinary tract infection (14%), urinary tract inflammation (14%), pyrexia (14%) and increased blood pressure (14%). Treatment-related AEs observed in at least 10% of all patients are summarised in Table 2. Infusion-related reactions were observed in 6/15 (40%) patients receiving IV inebilizumab and 2/5 (40%) receiving IV placebo; injection-related reactions were observed in 1/6 (17%) patients receiving SC inebilizumab and no patients receiving SC placebo. Most injection and infusion reactions were grade 1 (4 patients in the inebilizumab groups and 1 in the placebo group) or grade 2 (2 patients in the inebilizumab groups and 1 in the placebo group) in severity; one grade 2 injection-related reaction was observed in the inebilizumab 300-mg SC group.
Table 2.
Treatment-related adverse events in ⩾10% of patients at 24 weeks.
| Parameter | Placebo (n = 7) | Total inebilizumab (n = 21) |
|---|---|---|
| Total number of events | 4 | 37 |
| Number of patients reporting events, n (%) | 3 (43) | 13 (62) |
| Event, number of patients (%) | ||
| Pyrexia | 0 | 2 (10) |
| Nasopharyngitis | 0 | 2 (10) |
| Oral herpes | 0 | 2 (10) |
| Increased blood pressure | 0 | 2 (10) |
Infections were observed in two patients (29%) receiving placebo, four (80%) receiving inebilizumab 30 mg IV, one (33%) receiving inebilizumab 60 mg SC, three (75%) receiving inebilizumab 100 mg IV, three (100%) receiving inebilizumab 300 mg SC and two (33%) receiving inebilizumab 600 mg IV and did not appear to be related to the inebilizumab dose. Most infections were grade 1 or grade 2 in severity; only one patient receiving inebilizumab 600 mg IV had a grade 3 urinary tract infection that was not related to study drug. No AEs resulted in discontinuation of treatment. Three SAEs occurred in three patients in the inebilizumab group, including pyrexia (n = 1), urinary tract infection (n = 1) and accidental mixed-drug intoxication (n = 1; resulted in death), and one SAE occurred in one patient in the placebo group (MS relapse). The death occurred 133 days after the last dose of inebilizumab (30 mg IV) and was assessed by the investigator to be due to an accidental mixed-drug intoxication that was not related to inebilizumab (see Appendix 2).
A decrease was seen in total immunoglobulin levels in inebilizumab-treated patients. The mean percentage decrease from baseline in total immunoglobulin at week 24 was −10.5% for inebilizumab-treated patients and −0.1% for the placebo group. A reduction was observed in all immunoglobulin subtypes (IgA, IgE, IgG, IgM) and was greatest for the IgM subtype. At the 18-month follow-up, the mean decrease in total immunoglobulin was −15.0% in the inebilizumab group. The total immunoglobulin levels did not fall below the normal range in any study patient. No change was seen in tetanus titres between baseline and week 24 in either the inebilizumab or the placebo group. Anti-inebilizumab antibodies were not detected in any patients receiving inebilizumab or placebo.
Pharmacokinetics and pharmacodynamics
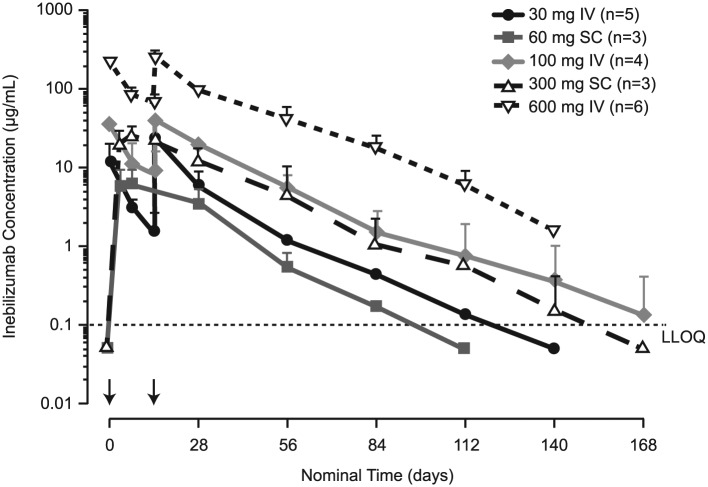
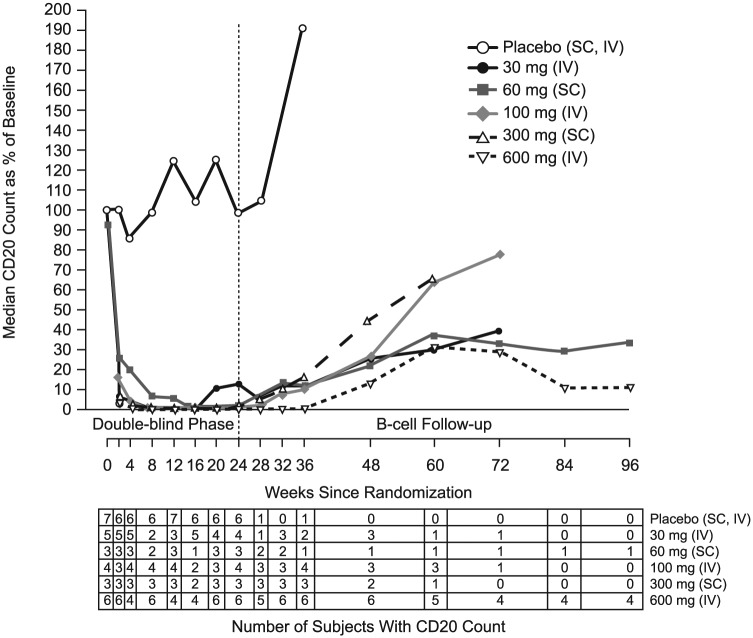
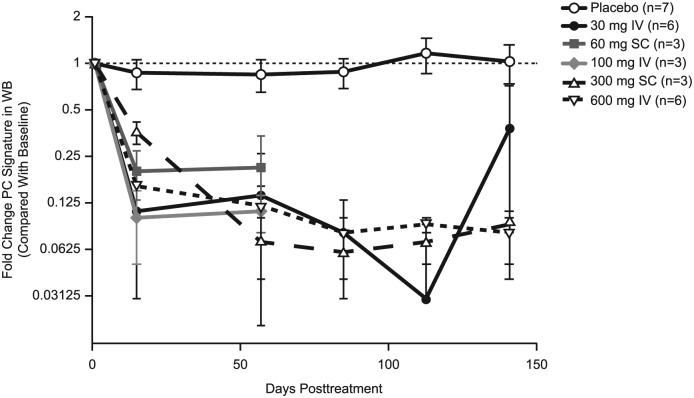
Inebilizumab pharmacokinetic parameters are summarised in Table 3. The terminal elimination phases were parallel in all dose groups. A dose-proportional increase in maximum observed concentration and in area under the concentration–time curve was observed for all dose levels (Figure 3). The mean systemic clearance appeared to be independent of dose levels for both IV and SC cohorts. The median half-life of inebilizumab was 16 days (range, 11–25 days), and the calculated bioavailability using non-compartmental analysis was 58% and 46% following a single 60-mg and 300-mg SC dose, respectively. A rapid decline in CD20 B-cell counts was observed for all inebilizumab IV and the inebilizumab 300-mg SC dose groups, whereas a slower decline was observed with the 60-mg SC dose group (Figure 4). Overall, higher inebilizumab doses caused longer duration of B-cell depletion. The median time for B-cell return to lower limit of normal (80 cells/µL) or baseline after a sign of recovery was similar across dose cohorts (range, 196–277 days). Circulating PCs as measured by the PC gene signature in whole blood also were reduced following inebilizumab administration across all doses (Figure 5).
Table 3.
Pharmacokinetic parameters for inebilizumab.
| Inebilizumab dose, mg | Route | n | Cmax, µg/mL | AUC0-last, µg d/mL | AUC0-inf, µg d/mL | CL or CL/F, mL/d | T½, day | F, % |
|---|---|---|---|---|---|---|---|---|
| 30 | IV | 5 | 17.9 (13.2) | 436a | 440a | 139a | 17.7a | NA |
| 100 | IV | 4b | 43.1 (11.4) | 1140 (278) | 1150 (286) | 181 (44.5) | 17.7 (6.3) | NA |
| 600 | IV | 6 | 248.0 (66.8) | 6850 (1340) | 6950 (1430) | 180 (41.5) | 18.7 (2.0) | NA |
| 60 | SC | 3 | 6.7 (2.9) | 197 (92.6) | 201 (91.5) | 351 (177) | 12.3 (1.7) | 58 |
| 300 | SC | 3 | 24.7 (9.4) | 788 (455) | 794 (453) | 457 (214) | 15.1 (4.3) | 46 |
AUC0-inf: area under the concentration–time curve extrapolated to infinity after dosing; AUC0-last: area under the concentration–time curve from 0 to the last quantifiable concentration; CL: systemic clearance; CL/F: apparent clearance after extravascular administration; Cmax: maximum observed concentration; F: bioavailability; IV: intravenous; NA: not applicable; SC: subcutaneous; T½: terminal elimination half-life.
Standard deviation was not calculated with two patients in the 30-mg cohort. Two patients who received only one dose and one patient with insufficient data to calculate parameters were excluded.
Parameters were calculated from three patients by excluding one patient who received lower dose.
Figure 3.
Mean inebilizumab concentrations versus time. Data below the lower limit of quantification (LLOQ) (0.1 µg/mL; as shown by dashed line) are plotted at half of the LLOQ, for illustrative purposes only. Error bars represent standard deviation of the mean. Arrows indicate dosing events (IV on days 1 and 15; SC on day 1).
IV: intravenous; LLOQ: lower limit of quantification; SC: subcutaneous.
Figure 4.
Median CD20 B-cell counts over time following inebilizumab administration. Data after week 24 reflect only patients who had not achieved B-cell repletion. Data used to calculate median value were collected from ⩾2 patients. *One subject in the 60-mg SC cohort and two subjects in the 600-mg IV cohort did not fully reach repletion to the lower limit of normal during the long-term follow-up period and received other standard-of-care MS therapies.
IV: intravenous; SC: subcutaneous.
Figure 5.
Effect of inebilizumab on plasma cell signature in whole blood. Mean values are plotted. Signature scores were calculated by determining the median fold change of the panel of genes at each time point for each subject within a dose cohort. Results were reported as fold change in PC signature compared with the value at baseline (pretreatment) with the baseline value set to 1. Values <1 represent depletion of the PC signature, and values >1 represent an increase in the PC signature compared with pretreatment levels.
PC: plasma cells; WB: Western blot.
MRI outcomes by week 24
The mean number of cumulative new Gd-enhancing lesions was 0.1 (standard deviation (SD) = 0.30) in the inebilizumab group versus 1.3 (SD = 1.38) in the placebo group (Figure 6). The mean number of new or newly enlarging T2 lesions was 0.4 (SD = 0.94) in the inebilizumab group versus 2.4 (SD = 3.26) in the placebo group. The proportion of patients free of new inflammatory activity (i.e. no new Gd-enhancing lesions and no new or newly enlarging T2 lesions) was 75% in the inebilizumab group versus 43% in the placebo group.
Figure 6.
Magnetic resonance imaging outcomes by week 24.
Gd+: gadolinium-enhancing.
Relapses and EDSS scores
One patient who received placebo experienced a protocol-defined MS relapse. No protocol-defined relapses were seen in the inebilizumab group. The median EDSS score did not change in either treatment group.
Discussion
The role of B cells in the pathogenesis of MS has been increasingly appreciated lately.7,8,18 Experimental evidence suggests that CD19+ B-cell levels in the blood are elevated in patients with MS12 and that CD19+ plasmablasts are associated with ongoing inflammation in MS.13 Studies with anti-CD20 antibodies have demonstrated that B-cell depletion may be an important therapeutic approach to MS.7,8,18 In this study, inebilizumab, a novel anti-CD19 antibody, exhibited durable pharmacodynamic effects in which circulating B cells (as measured by immunocytochemistry/flow cytometry) and PCs (as measured by the PC gene signature) were rapidly depleted.14 Inebilizumab is the first anti-CD19 monoclonal antibody to be tested in MS patients, and one could hypothesise that it may be more efficacious than anti-CD20 antibodies such as rituximab, ocrelizumab and ofatumumab due to its targeting of a larger spectrum of B cells. However, at this time, it is unknown whether targeting CD19+ B cells will translate into any difference in clinical efficacy relative to targeting CD20+ B cells.
The phase 1 study reported here was conducted in patients with relapsing forms of MS to assess the safety of inebilizumab and to analyse its pharmacokinetic and pharmacodynamic profile. In this phase 1 study (n = 28), inebilizumab appeared to have an acceptable safety and tolerability profile during the period tested.
The median half-life of inebilizumab was 16 days, which is shorter than expected for an IgG antibody (≈21 days);19 the shorter half-life of inebilizumab is probably due to afucosylation, although the small number of patients and a high mannose level (8.4%) on the inebilizumab antibody may also be contributing factors. Rapid B-cell depletion was observed at all inebilizumab doses except the 60-mg SC dose. B-cell depletion, duration of depletion remaining ⩾90% from baseline, and time to start of recovery were dose dependent, with most dose groups maintaining 90% depletion throughout the 24-week follow-up period. Patients who received inebilizumab SC had slower depletion of the PC signature than patients who received inebilizumab IV; however, no dose-dependent relationship was observed in the extent of depletion of the PC signature.
The inebilizumab-treated patients developed notably fewer new Gd-enhancing and new or newly enlarging T2 MRI lesions. This finding is consistent with what has been observed with other B-cell depleters evaluated in relapsing forms of MS.7 It is notable that, at baseline, patients in the inebilizumab group had a higher number of Gd-enhancing lesions (1.1 vs 0.4), a greater volume of T2 lesions (14.44 vs 6.46 cm3) and a higher EDSS score (4.0 vs 3.0) than the placebo group. However, owing to the small sample size, no conclusions can be reached from this study regarding the drug’s effect on relapse rate, MRI outcomes and EDSS scores. No changes were seen in EDSS score at week 24, probably owing to the short duration of the study and small sample sizes. Larger studies would be needed to evaluate the effect of inebilizumab on clinical outcomes in relapsing MS, such as the relapse rate and the proportion of patients who experience disability progression.
Acknowledgments
The authors thank John Ratchford, MD, for his involvement in the analysis and interpretation of the data and for his critical review of the manuscript; Wenliang Yao, PhD, for his assistance with the biostatistical analysis; Martin Schwickart for his involvement in the peripheral blood analyses; Sarah Sweeny for project management of the study; and Katie Streicher, PhD, for plasma cell gene signature data; all with MedImmune.
Appendix 1
Relapse criteria
Three types of clinical relapses were defined in the study: protocol-defined clinical relapse, non–protocol-defined clinical relapse and suspected clinical relapse. A protocol-defined clinical relapse required that the patient be seen within 7 days of onset, verified by the treating investigator and independently observed as a change in Expanded Disability Status Scale (EDSS) by the examining investigator. A new symptom or worsening of an old symptom attributable to multiple sclerosis (MS) must have been present, accompanied by a change in the neurologic examination (defined as ⩾0.5 increase in the EDSS over the last scheduled or unscheduled visit, a 2-point change in one functional system, or a 1-point change in two functional systems, except for bladder and cognitive changes), lasting at least 24 hours in the absence of fever and preceded by stability or improvement for at least 30 days. A non–protocol-defined clinical relapse was similar to a protocol-defined clinical relapse, except that the patient was not seen within the 7-day window. A suspected clinical relapse was a relapse that failed to meet the above criteria but that may have been a relapse; that is, all circumstances point to a relapse, but upon examination by the investigator, no residual or change in the EDSS was noted.
Appendix 2
Accidental mixed-drug intoxication fatal event
The subject who suffered the fatal accidental mixed-drug intoxication had a medical history that included relapsing-remitting MS, anxiety, depression, prior suicide attempts via overdose with prescription medication, necrotising pneumonitis, seizure, avascular necrosis of the hips with two left-hip replacements, pulmonary embolism, mild asthma, hyperlipidaemia, hysterectomy, osteoarthritis, factor 5 Leiden deficiency, gastroesophageal reflux disease, migraine headache, urinary tract infections and seasonal allergies. The subject received two doses of inebilizumab (30 mg inebilizumab IV), on day 1 and day 15. On day 56, the subject had an accidental opioid overdose that lasted 7 days. A second and fatal accidental drug intoxication event occurred on day 134. The autopsy attributed the cause of death to mixed-drug intoxication resulting in accidental fatal overdose. Blood levels for morphine and cyclobenzaprine were somewhat elevated. It appeared that the subject had taken these medications in excess of the prescription instructions; however, the blood levels and remaining pill counts did not suggest deliberate overdose. The death was assessed as not related to investigational product by the investigator.
Footnotes
Declaration of Conflicting Interests: The author(s) declared the following potential conflicts of interest with respect to the research, authorship and/or publication of this article: The University of California at Davis received funding, with M.A.A. as principal investigator, for the conduct of this study. M.A.A. has also served as a consultant for Novartis, Roche, Sanofi and Serono and has received research funding from Biogen, Celgene, Novartis, Roche and Sanofi. G.K.-D. has received research funding for the conduct of this study and has had travel, accommodation and/or investigator meeting expenses paid by MedImmune. M.M. has received lecture fees from Biogen, Novartis and Merck. A.P. received research funding for the conduct of this study and has served as a consultant and on an advisory board for MedImmune. J.L., K.P., J.W., S.M., G.B., E.K. and A.F. are employees of MedImmune and may own stock and/or stock options in AstraZeneca. M.A.A., G.K.-D., M.M. and A.P. received no honoraria or other form of financial support related to the development of this manuscript.
Funding: The author(s) disclosed receipt of the following financial support for the research, authorship and/or publication of this article: This study was sponsored by MedImmune, the global biologics R&D arm of AstraZeneca. Medical writing and editorial support were provided by Amy Zannikos, PharmD, of Peloton Advantage, LLC (Parsippany, NJ) and were funded by MedImmune.
Contributor Information
Mark A Agius, Department of Neurology, University of California, Davis, CA, USA/VA Northern California Health Care System, Sacramento, CA, USA; Multiple Sclerosis Center, Barrow Neurological Institute, Phoenix, AZ, USA.
Gabriela Klodowska-Duda, Neuro-Care, Katowice, Poland.
Maciej Maciejowski, KMK-Clinical Sp. z o.o., NZOZ Rawa-Med, Katowice, Poland.
Andrzej Potemkowski, Osrodek Badan Klinicznych Indywidualnej Specjalistycznej Praktyki Lekarskiej, Szczecin, Poland.
Jing Li, MedImmune, Mountain View, CA, USA.
Kaushik Patra, MedImmune, Gaithersburg, MD, USA/Alexion Pharmaceuticals, Lexington, MA, USA.
Jacob Wesley, MedImmune, Gaithersburg, MD, USA.
Soraya Madani, MedImmune, Gaithersburg, MD, USA.
Gerard Barron, MedImmune, Cambridge, UK.
Eliezer Katz, MedImmune, Gaithersburg, MD, USA.
Armando Flor, MedImmune, Gaithersburg, MD, USA.
References
- 1. Baranzini SE, Jeong MC, Butunoi C, et al. B cell repertoire diversity and clonal expansion in multiple sclerosis brain lesions. J Immunol 1999; 163: 5133–5144. [PubMed] [Google Scholar]
- 2. Duddy M, Niino M, Adatia F, et al. Distinct effector cytokine profiles of memory and naive human B cell subsets and implication in multiple sclerosis. J Immunol 2007; 178: 6092–6099. [DOI] [PubMed] [Google Scholar]
- 3. Probstel AK, Sanderson NS, Derfuss T. B cells and autoantibodies in multiple sclerosis. Int J Mol Sci 2015; 16: 16576–16592. [DOI] [PMC free article] [PubMed] [Google Scholar]
- 4. Faissner S, Nikolayczik J, Chan A, et al. Plasmapheresis and immunoadsorption in patients with steroid refractory multiple sclerosis relapses. J Neurol 2016; 263: 1092–1098. [DOI] [PubMed] [Google Scholar]
- 5. Knippenberg S, Peelen E, Smolders J, et al. Reduction in IL-10 producing B cells (Breg) in multiple sclerosis is accompanied by a reduced naive/memory Breg ratio during a relapse but not in remission. J Neuroimmunol 2011; 239: 80–86. [DOI] [PubMed] [Google Scholar]
- 6. Cepok S, Jacobsen M, Schock S, et al. Patterns of cerebrospinal fluid pathology correlate with disease progression in multiple sclerosis. Brain 2001; 124: 2169–2176. [DOI] [PubMed] [Google Scholar]
- 7. Hauser SL, Waubant E, Arnold DL, et al. B-cell depletion with rituximab in relapsing-remitting multiple sclerosis. N Engl J Med 2008; 358: 676–688. [DOI] [PubMed] [Google Scholar]
- 8. Kappos L, Li D, Calabresi PA, et al. Ocrelizumab in relapsing-remitting multiple sclerosis: A phase 2, randomised, placebo-controlled, multicentre trial. Lancet 2011; 378: 1779–1787. [DOI] [PubMed] [Google Scholar]
- 9. LeBien TW, Tedder TF. B lymphocytes: How they develop and function. Blood 2008; 112: 1570–1580. [DOI] [PMC free article] [PubMed] [Google Scholar]
- 10. Otero DC, Anzelon AN, Rickert RC. CD19 function in early and late B cell development: I. Maintenance of follicular and marginal zone B cells requires CD19-dependent survival signals. J Immunol 2003; 170: 73–83. [DOI] [PubMed] [Google Scholar]
- 11. Chen D, Gallagher S, Monson NL, et al. Inebilizumab, a B cell-depleting anti-CD19 antibody for the treatment of autoimmune neurological diseases: Insights from preclinical studies. J Clin Med 2016; 5: E107. [DOI] [PMC free article] [PubMed] [Google Scholar]
- 12. Habib J, Deng J, Lava N, et al. Blood B cell and regulatory subset content in multiple sclerosis patients. J Mult Scler 2015; 2: 139. [DOI] [PMC free article] [PubMed] [Google Scholar]
- 13. Cepok S, Rosche B, Grummel V, et al. Short-lived plasma blasts are the main B cell effector subset during the course of multiple sclerosis. Brain 2005; 128: 1667–1676. [DOI] [PubMed] [Google Scholar]
- 14. Herbst R, Wang Y, Gallagher S, et al. B-cell depletion in vitro and in vivo with an afucosylated anti-CD19 antibody. J Pharmacol Exp Ther 2010; 335: 213–222. [DOI] [PubMed] [Google Scholar]
- 15. Chen D, Blazek M, Ireland S, et al. Single dose of glycoengineered anti-CD19 antibody (MEDI551) disrupts experimental autoimmune encephalomyelitis by inhibiting pathogenic adaptive immune responses in the bone marrow and spinal cord while preserving peripheral regulatory mechanisms. J Immunol 2014; 193: 4823–4832. [DOI] [PMC free article] [PubMed] [Google Scholar]
- 16. Polman CH, Reingold SC, Banwell B, et al. Diagnostic criteria for multiple sclerosis: 2010 revisions to the McDonald criteria. Ann Neurol 2011; 69: 292–302. [DOI] [PMC free article] [PubMed] [Google Scholar]
- 17. Streicher K, Morehouse CA, Groves CJ, et al. The plasma cell signature in autoimmune disease. Arthritis Rheumatol 2014; 66: 173–184. [DOI] [PubMed] [Google Scholar]
- 18. Sorensen PS, Lisby S, Grove R, et al. Safety and efficacy of ofatumumab in relapsing-remitting multiple sclerosis: A phase 2 study. Neurology 2014; 82: 573–581. [DOI] [PubMed] [Google Scholar]
- 19. Leveque D, Wisniewski S, Jehl F. Pharmacokinetics of therapeutic monoclonal antibodies used in oncology. Anticancer Res 2005; 25: 2327–2343. [PubMed] [Google Scholar]


