

Abstract
CCCTC-binding factor (CTCF) plays a key role in the formation of topologically associating domains (TADs) and loops in interphase. During mitosis TADs are absent, but how TAD formation is dynamically controlled during the cell cycle is not known. Several contradicting observations have been made regarding CTCF binding to mitotic chromatin using both genomics- and microscopy-based techniques. Here, we have used four different assays to address this debate. First, using 5C, we confirmed that TADs and CTCF loops are readily detected in interphase, but absent during prometaphase. Second, ATAC-seq analysis showed that CTCF sites display greatly reduced accessibility and lose the CTCF footprint in prometaphase, suggesting loss of CTCF binding and rearrangement of the nucleosomal array around the binding motif. In contrast, transcription start sites remain accessible in prometaphase, although adjacent nucleosomes can also become repositioned and occupy at least a subset of start sites during mitosis. Third, loss of site-specific CTCF binding was directly demonstrated using CUT&RUN. Histone modifications and histone variants are maintained in mitosis, suggesting a role in bookmarking of active CTCF sites. Finally, live-cell imaging, fluorescence recovery after photobleaching, and single molecule tracking showed that almost all CTCF chromatin binding is lost in prometaphase. Combined, our results demonstrate loss of CTCF binding to CTCF sites during prometaphase and rearrangement of the chromatin landscape around CTCF motifs. This, combined with loss of cohesin, would contribute to the observed loss of TADs and CTCF loops during mitosis and reveals that CTCF sites, key architectural cis-elements, display cell cycle stage–dependent dynamics in factor binding and nucleosome positioning.
Several studies have observed a key role of CCCTC-binding factor (CTCF) in organizing the linear genome in topologically associating domains (TADs) and loops in interphase vertebrate cells (Dixon et al. 2012; Nora et al. 2012, 2017). CTCF is an 11 zinc finger protein that binds a well-defined motif to which it can bind only in one direction (Kim et al. 2007). Nucleosomes flanking CTCF-bound sites are strongly positioned (Fu et al. 2008). In addition, flanking nucleosomes contain histone modifications such as H3K4 methylation and histone variants such as H2A.Z (Jin et al. 2009; Nekrasov et al. 2012). Although CTCF has about 42,000 predicted binding sites in the human genome, only a subset of CTCF sites are bound in a given cell type.
It has been proposed that topologically associating domains (TADs) and CTCF loops are formed as a result of cohesin-dependent loop extrusion (Sanborn et al. 2015; Dekker and Mirny 2016; Fudenberg et al. 2016). According to this model, when cohesin is loaded on the chromatin, it will be able to form a loop between two loci and will keep extruding until it is blocked by CTCF, which will function as a boundary element. Whether cohesin is blocked by bound CTCF and whether two CTCF-occupied sites can form a loop depends on the orientation of the CTCF motif: Looping is mostly observed between CTCF sites in a convergent orientation (Rao et al. 2014; de Wit et al. 2015; Guo et al. 2015; Vietri Rudan et al. 2015). CTCF loops often define TADs that are implicated in gene regulation.
Chromosome organization changes dramatically during mitosis. The structural features of interphase chromosomes described by 5C and Hi-C, such as TADs and A- and B-compartments, are lost in prometaphase (Naumova et al. 2013). Current models, based on modeling Hi-C data for prometaphase cells combined with extensive earlier imaging data (Marsden and Laemmli 1979; Adolph 1980; Earnshaw and Laemmli 1983), propose that mitotic chromosomes are organized as arrays of nested loops that are helically arranged around a spiraling central axis (Gibcus et al. 2018). These loops can be generated by a process of loop extrusion mediated by condensin complexes (Dekker and Mirny 2016; Goloborodko et al. 2016; Gibcus et al. 2018).
Although it is clear that loss of CTCF causes genome-wide loss of TADs in interphase (Nora et al. 2017), whether the loss of TADs during mitosis is due to regulation of CTCF is currently unclear. First, it is possible that condensin-mediated loop extrusion, unlike cohesin-mediated extrusion, is not blocked by CTCF. It has been shown that condensin II in interphase cells does not accumulate at CTCF sites, unlike cohesion (Dowen et al. 2013). This suggests that CTCF cannot block condensin II–mediated loop extrusion. Alternatively, TAD boundaries could be absent because CTCF, and most of cohesin, dissociates from chromatin during mitosis. Along these lines, CTCF becomes highly phosphorylated in mitosis (Dovat et al. 2002; Dephoure et al. 2008; Rizkallah and Hurt 2009), and in vitro assays show that DNA binding capability of phosphorylated CTCF is dramatically reduced (Jantz and Berg 2004; Sekiya et al. 2017).
There have been several studies to examine chromatin/protein factor binding in mitotic cells using both microscopy and genomics techniques such as ChIP-seq and DNase I sensitivity assays. Several studies suggest that most factors lose site-specific binding to the chromatin during mitosis (Martínez-Balbás et al. 1995; Hsiung et al. 2015). However, other studies, mainly using imaging or western blot analysis of chromosome-associated proteins, report maintenance of factor binding in mitosis (Burke et al. 2005; Chen et al. 2005; Teves et al. 2016; Liu et al. 2017). There are several reasons that could explain these conflicting results. First, formaldehyde fixation can affect protein association with mitotic chromosomes, and therefore prevent observation of factor binding by both microscopy and ChIP-seq (Pallier et al. 2003; Teves et al. 2016; Festuccia et al. 2019). Additionally, when performing population-wide genomic studies in mitosis, cells need to be synchronized using drugs, cell sorting, or specifically modified cell lines need to be used (Jackman and O'Connor 2001; Taylor 2004; Hochegger et al. 2007; Gibcus et al. 2018). It is important to obtain pure synchronized populations, as contamination of interphase cells, especially in studies using immunoprecipitation, can lead to an overestimation of signal in mitosis. Furthermore, although microscopy has advantages over population-wide studies, microscopy does not capture information on site-specific binding of factors. Moreover, it is important to distinguish colocalization of factors with the mitotic chromatin from site-specific binding, which could function as a mitotic bookmark (Raccaud and Suter 2018; Raccaud et al. 2018; Festuccia et al. 2019). In this study, we used a combination of several genomics techniques and live-cell imaging to study cell cycle dynamics of CTCF-mediated looping interactions, CTCF binding, and local chromatin state flanking CTCF binding sites.
Results
5C shows loss of TADs and CTCF loops in prometaphase
It has been shown that interphase structures, such as TADs and compartments, are lost in mitosis (Naumova et al. 2013; Nagano et al. 2017; Oomen and Dekker 2017; Gibcus et al. 2018). However, the resolution of these previous studies was not sufficient to investigate specific looping interactions, e.g., between CTCF sites. We therefore applied a targeted 5C approach (Dostie et al. 2006) that allows high resolution analysis (10–15 kb) for domains up to several megabases in interphase and mitosis. To obtain mitotic cells, we synchronized HeLa S3 cells by first arresting cells in early S-phase using a thymidine block, followed by an arrest in prometaphase using nocodazole (Naumova et al. 2013). We confirmed cell cycle state of nonsynchronous and mitotic (prometaphase) cell populations using flow cytometry (Supplemental Fig. S1) and quantified the mitotic index (percentage of cells with condensed chromosomes) using fluorescence microscopy of DAPI-stained cells. HeLa S3 asynchronous populations have a mitotic index count of ∼5%, whereas a nocodazole-arrested culture contained 95%–98% mitotic cells. We also biochemically purified mitotic chromatin from prometaphase cells (Gasser and Laemmli 1987). When purified mitotic chromosomes were examined using fluorescence microscopy with DAPI staining, no contaminating interphase cells were detected (for representative examples, see Supplemental Fig. S1).
We performed 5C with a pool of primers targeting each end of each restriction fragment (a “double” alternating design) (Hnisz et al. 2016), which produces a complete interaction map for all restriction fragments throughout the two 2-Mb regions (Supplemental Fig. S2). In interphase cells, TADs are readily detected as domains of increased interaction frequencies between loci flanked by CTCF-bound sites (Fig. 1A, representative TAD marked with dashed line). By evaluating the insulation profile along the locus, we can identify TAD boundaries and quantify the strength of TADs (Crane et al. 2015; Gibcus et al. 2018). Insulation score is low at TAD boundaries and high at loci inside TADs (Fig. 1D). As has been shown before, TAD boundaries are enriched in CTCF binding (Dixon et al. 2012; Rao et al. 2014; Vietri Rudan et al. 2015). CTCF-looping interactions are detected by their appearance as “dots” of elevated interaction frequency (Fig. 1A, several loops marked with arrows). To illustrate CTCF loops, we plotted the interaction frequencies of one CTCF site with its flanking loci (Fig. 1G). We find that interaction frequencies generally decay with genomic distance, but that peaks appear at other CTCF sites, consistent with loop formation. It has been shown that loops between CTCF sites typically occur between motifs that are in convergent orientation (Rao et al. 2014; de Wit et al. 2015; Guo et al. 2015; Tang et al. 2015). Looping interactions observed in our 5C data are consistent with this (Fig. 1G).
Figure 1.

Topologically associating domains (TADs) and CTCF loops are lost in prometaphase. 5C data of Chromosome 11: 33,299,877–34,752,377 show TADs (dashed lines) and CTCF loops (arrows) in interphase (A); however, these structures are lost in nocodazole-arrested mitotic cells (B) and purified mitotic chromatin (C). (D–F) Insulation profiles. (D) The insulation profile for nonsynchronized cells shows a strong pattern alternating peaks centered within TADs and valleys at TAD boundaries. TAD boundaries are colocalized with bound CTCF as is shown by ENCODE CTCF ChIP-seq. (E,F) Insulation profiles for mitotic cells and mitotic chromatin do not show deep minima, indicating TAD boundaries are absent. (G–I) 5C interaction profiles anchored on one CTCF-bound site (15-kb bin spanning Chr 11: 34,012,377–34,027,377). (G) Peaks along these profiles (arrows) indicate CTCF loops observed in interphase. (H,I) CTCF loops are not detected in mitotic cells and mitotic chromatin. Blue arrows represent the position and orientation of CTCF motifs.
5C analysis reveals that TADs are no longer observed in mitotic cells and mitotic chromatin (Fig. 1B,C), in agreement with previous observations (Naumova et al. 2013; Gibcus et al. 2018). The loss of TADs can be seen both visually in the interaction heatmap, as well as by calculation of the insulation profile (Fig. 1E,F). Looping interactions between CTCF sites are also no longer detected in mitosis (Fig. 1H,I).
Analysis of chromatin accessibility in interphase and prometaphase
To investigate chromatin characteristics at CTCF binding sites, we determined chromatin accessibility using ATAC-seq (Buenrostro et al. 2015). ATAC-seq fragments capture information in several different ways. First, ATAC-seq data provide information about genome-wide nucleosome positioning and spacing. This information is captured in the length distribution of all fragments (Fig. 2A). Very short fragments ranging from 24 to 80 bp are frequently observed. These fragments represent accessible regions in between nucleosomes or in between a nucleosome and another chromatin-bound protein. Larger fragments typically form an enrichment of sizes that are multiples of ∼195 bp. This reflects the nucleosomal array, which has been seen before in previous studies using ATAC-seq (Buenrostro et al. 2013). In mitosis we observed a similar nucleosomal array. However, the nucleosomal array is more pronounced, as the enrichment for fragments that are multiples of 195 bp, represented by the peaks in Figure 2A, is stronger. This suggests that the spacing of nucleosomes genome-wide is more regular in mitosis compared to interphase.
Figure 2.

ATAC-seq data show accessibility at CTCF sites and enhancers is reduced in mitosis, although maintained at TSSs. (A) Fragment length distribution of ATAC-seq reads genome-wide in nonsynchronized cells, mitotic cells, and purified mitotic chromatin. (B) Distribution of number of peaks called in nonsynchronized cells, mitotic cells, and mitotic chromatin and their position on ChromHMM segments. (C) Example of a representative region illustrating maintenance of accessible chromatin at TSSs in mitotic conditions, while ATAC-seq signal is lost at CTCF motifs.
A second type of information captured in ATAC-seq data is on accessibility of specific classes of sites. We called peaks on ATAC-seq data using HOMER (Heinz et al. 2010). ATAC-seq data have been shown to display peaks in regions of open chromatin similar to peaks generated by DNase I sensitivity assays (Buenrostro et al. 2013). We can separate regions of the genome based on their function assigned by ChromHMM (The ENCODE Project Consortium 2012; Ernst and Kellis 2017). ATAC-seq peaks are found in different types of functional elements, such as active promoters, enhancers, or CTCF insulator regions (Fig. 2B). We then compared peaks found in interphase to peaks found in mitotic cells and mitotic chromatin. In general, there is large loss of peaks in prometaphase compared to interphase. However, when we compare which types of functional elements lose peaks, we see that active promoters maintain significant accessibility, whereas the other functional elements examined lose most accessibility in mitosis (Fig. 2B). The maintenance of significant accessibility of promoter regions and concomitant loss of accessibility at enhancers during mitosis has been previously observed using DNase I sensitivity assays (Martínez-Balbás et al. 1995; Hsiung et al. 2015). In addition to this, we find an even more substantial loss of accessibility at CTCF binding sites. This was observed in both mitotic cells and purified mitotic chromatin. Figure 2C shows an example of ATAC-seq signal at individual TSSs and a CTCF motif (Fig. 2C).
V-plots reveal protein occupancy at CTCF motifs and nucleosome positioning in interphase
ATAC-seq also captures information on protein binding footprints and nucleosome positioning flanking hypersensitive sites. This information is captured by the length of fragments at a site of interest. We used V-plots to represent these data. V-plots have been used to plot MNase data as a way to display chromatin binding by site-specific factors and positioning of flanking nucleosomes on different length scales (Zentner and Henikoff 2012). We plotted our ATAC-seq data with the fragment length on the y-axis and positioning of the midpoint of the fragment on the x-axis representing the distance to the binding site of interest. To investigate local chromatin state at and around sites of CTCF binding, we made V-plots of our data on CTCF motifs (Kim et al. 2007) that are accessible, i.e., have an ATAC-seq peak, in interphase (Fig. 3A). In nonsynchronized cells, we observe an enrichment of 80–100 bp fragment at the CTCF binding sites (asterisk), which represents the footprint of bound CTCF and possibly associated proteins like cohesin. Similar footprints have been found using MNase digestion (Fu et al. 2008). The footprint can also be observed when the fragment length distribution is plotted for all fragments with their midpoint on bound CTCF motifs (Fig. 3D, asterisk). When we plot the lengths of reads with one end on a CTCF motif, we observe that many fragments have a short length (Fig. 3E). These represent fragments generated by pairs of ATAC cleavages in between bound CTCF and the flanking nucleosomes.
Figure 3.

ATAC-seq data represented in V-plots show loss of CTCF binding in mitosis and rearrangement of nucleosomes flanking CTCF motifs. (A–C) ATAC-seq data represented in V-plots aggregated at CTCF sites. The lengths of ATAC-seg reads are plotted on the y-axis, and the distance between their midpoints and the CTCF motif is shown on the x-axis. (A) V-plot for interphase ATAC-seq data. Asterisk indicates the CTCF footprint. Enriched dots along the arms of the V (arrows) represent strongly positioned nucleosomes. (B,C): V-plots for ATAC-seq data from mitotic cells and purified mitotic chromatin aggregated at CTCF motifs with interphase ATAC-seq peaks. Asterisks mark the loss of the CTCF footprint. Arrows indicate positioning of flanking nucleosomes. (D) Distribution of fragment lengths of reads that have their midpoint on a CTCF motif: (dashed line) genome-wide average read length distribution; (arrows) read lengths representing one and two nucleosomes. (E) Distribution of fragment length of reads with either read end near a CTCF motif with interphase ATAC-seq peak compared to the genome-wide average (dashed line). In interphase, reads representing one flanking nucleosome are longer (red arrow) as compared to reads representing one flanking nucleosome in mitosis (black arrow). (F) Side-by-side comparison of V-plots for nonsynchronized and mitotic chromatin. The shift in nucleosome positioning is highlighted using arrows. Asterisks mark loss of CTCF footprint in mitosis.
The second type of information that can be derived from V-plots is regarding the positioning of flanking nucleosomes. For bound CTCF motifs in interphase, we observe enriched dots on the arms of the V in the V-plot (Fig. 3A, arrows). These dots indicate strong positioning of several nucleosomes flanking the bound CTCF motif, consistent with previous MNase results (Fu et al. 2008). The series of enriched signals represent ATAC-seq fragments covering one, two, three, and four flanking nucleosomes, but are longer than expected for a typical nucleosomal array. We attribute this size discrepancy to mean that some of these fragments can cover not only one or more nucleosomes, but also the flanking bound CTCF site. This becomes even clearer when fragment lengths are plotted of reads that have one of their read ends near a bound CTCF motif (Fig. 3E, red arrow). We observe an enrichment of fragments that are around 220 bp, instead of the expected 195 bp for a canonical mononucleosome. Similar results were found when V-plots were made for all CTCF motifs or for CTCF motifs with peaks from available CTCF ChIP-seq ENCODE data (Supplemental Fig. S3A; The ENCODE Project Consortium 2012). Taken together, these analyses show that during interphase, CTCF is bound to its motif and nucleosomes flanking CTCF-occupied sites form a regularly spaced array.
V-plots show loss of binding at CTCF motifs and rearrangement of nucleosomes in prometaphase
We then created V-plots for ATAC-seq data generated from mitotic cells and purified mitotic chromatin at CTCF motifs that have an interphase ATAC-seq peak (Fig. 3B,C). As expected from the peak calling assessment, overall accessibility is reduced (and no longer significant) in mitotic conditions. However, some accessibility remains. We do note that ATAC-seq signal at CTCF sites for purified mitotic chromatin is stronger compared to ATAC-seq signal in mitotic cells. This higher signal to noise ratio is possibly caused by lower background signals overall due to stronger nucleosome interactions as a result of detergents in the chromosome purification buffer (Gasser and Laemmli 1987). Several additional features are observed. First, there is a change in the CTCF footprint. The enrichment of 80–100 bp fragment lengths observed in interphase is no longer present. Instead there is an enrichment of small fragments around 25–75 bp (asterisks). This suggests that CTCF is no longer bound to the motif, where it protected the site from ATAC-seq cleavage in interphase. We observed this in both mitotic cells and purified mitotic chromatin. The loss of 80–100 bp fragments is also observed when the length distribution is plotted for fragments with their midpoint on interphase bound CTCF motifs (Fig. 3D, cf. to interphase length distribution marked by asterisk).
Second, the positioning of nucleosomes around interphase bound CTCF motifs also changes during mitosis (Fig. 3B,C, arrows). Loss of CTCF binding would create a large accessible region between the flanking nucleosomes, which can in turn cause nucleosomes to move inward. This movement of nucleosomes would cause the linkers in the nucleosomal array to become larger than average. We observe this phenomenon in several ways. First, nucleosomes are able to occupy CTCF sites in mitosis. This can be seen by a gain of mono- and dinucleosome-sized fragments in the length distribution plot in Figure 3D (arrows). Nucleosome occupancy at the CTCF motif is not observed in interphase when CTCF typically occupies the motif. Second, as discussed above, in interphase we observe a peak at 220 bp in the fragment length distribution for fragments with one end in a CTCF motif that is larger than typical for a mononucleosome (Fig. 3E, red arrow). In mitosis, this mononucleosome peak becomes more similar to the genome-wide average (195 bp); again suggesting that CTCF is no longer bound (Fig. 3E, black arrow). This size discrepancy becomes even more obvious when V-plots for nonsynchronized cells and purified mitotic chromatin are plotted side by side (Fig. 3F, compare arrows). Lastly, there is a change in nucleosome spacing and positioning during mitosis (Fig. 3B,C). In interphase, the locations of nucleosomes are observed as enriched dots along the arms of the V with a strong positioning relative to the CTCF motif. Conversely, in mitosis, the enriched dots become less pronounced, and we observe horizontal bands of elevated fragment frequency in the heatmap running several kb upstream of and downstream from the CTCF motif. Because these V-plots are normalized for genome-wide average fragment length frequency, a banding pattern only emerges when the spacing between several of the flanking nucleosomes differs and/or is more variable from the genome-wide average. Specifically, the banding pattern indicates that there is an increase in nucleosomes spaced by larger linkers than the genome-wide average (Fig. 3E, dashed line). These observations confirm that several flanking nucleosomes are able to move inward, creating longer linkers between them. This creates a local nucleosomal array around CTCF sites with larger than average linkers.
Taken together, our data suggest that CTCF is no longer bound in prometaphase and nucleosomes rearrange. To exclude that there are certain subgroups of CTCF motifs that maintain binding in mitosis, we plotted V-plots for several obvious classes of CTCF motifs, e.g., motifs proximal or distal to TSSs or CTCF motifs that maintain an ATAC-seq peak in mitosis. In addition, we use k-means clustering for ATAC fragments of 75–150 bp at CTCF sites to determine whether there are subgroups of motifs that maintain a CTCF footprint in mitosis (Supplemental Fig. S4). None of these methods found a specific group of CTCF motifs that maintain CTCF binding. Finally, we confirmed the loss of CTCF binding and rearrangement of nucleosomes in multiple differentiated cell lines (Supplemental Figs. S5, S6).
Transcription start sites maintain significant accessibility, but show variable loss of factor binding and nucleosome repositioning in prometaphase
We also made several observations about the chromatin landscape at accessible TSSs in interphase and mitosis (Supplemental Fig. S7). First, we see an enrichment of fragments with a length <150 bp compared to the genome-wide average in interphase (Supplemental Fig. S7A, asterisk). We do not observe an enrichment of fragments of a defined size as we do for CTCF (cf. Supplemental Fig. S7D to Fig. 3D). This can be explained by the fact that contrary to CTCF sites, TSSs can be bound by a more diverse set of proteins. Second, we do not observe enrichments of nucleosome-sized fragments centered on the TSS (Supplemental Fig. S7D), confirming that in interphase, typically no nucleosomes are bound at TSSs. Furthermore, the length of fragments covering the two nucleosomes directly flanking the TSS appears less defined compared to those flanking CTCF sites (cf. Fig. 3E to Supplemental Fig. S7E, red arrow). There is a local enrichment of fragments a little over 200 bp in length. These fragments represent ATAC-seq products covering factors bound to the TSS plus the neighboring nucleosome, resulting in a length that is over the genome-wide expected 195 bp covering a single nucleosome. In addition, the enrichment of fragments >200 bp is less pronounced compared to genome-wide average for single nucleosome fragments, suggesting that heterogeneity in factors binding to the TSS can result in a wider distribution of fragment lengths covering the TSS and the flanking nucleosome.
In mitosis, complementary to our peak calling analysis (Fig. 2B,C), V-plots show that overall accessibility at TSSs is reduced, although maintained at higher levels than at CTCF sites (cf. Fig. 3B,C with Supplemental Fig. S7B,C). We observe that in mitotic chromatin, nucleosome-sized fragments are observed at the TSS (Supplemental Fig. S7D, arrows), suggesting that nucleosomes start occupying TSSs. This led us to explore further how mitotic accessibility at TSSs is related to nucleosome positioning. We compared the accessibility and nucleosome positioning in the top 20% most accessible and 20% least accessible TSSs in mitosis. In interphase, these two groups behave highly similarly, except for signal intensity as expected (cf. Fig. 4A,D with Fig. 4F,I). In mitosis, both groups of TSSs can be occupied by nucleosomes, however the level of nucleosome occupancy is inversely related to the level of remaining accessibility in mitosis (Fig. 4D,I, black arrows). For the group of TSSs with low levels of remaining accessibility, the nucleosome occupancy in mitosis is comparable to the genome-wide average (Fig. 4D, dotted line), whereas the group of TSSs with the highest remaining accessibility in mitosis, the nucleosome occupancy is lower than the genome-wide average (Fig. 4I, dotted line). During mitosis, the set of TSSs with the lowest accessibility resembles CTCF sites in several ways. First, while in interphase the fragments representing mononucleosomes flanking the TSS are longer than genome-wide average, in mitosis this length shortens to the canonical 195 bp (Fig. 4E, cf. black and red arrows). This shortening of fragments covering flanking nucleosomes can also be observed in V-plots (Fig. 4B,C, cf. arrows). Lastly, as for CTCF sites, we observe a gain of horizontal banding pattern in the V-plot, again indicating that there is an increase in nucleosomes spaced by larger linkers than the genome-wide average. Importantly and in contrast to CTCF sites, these TSSs are significantly more accessible than the genome-wide average, despite the fact that this set of TSSs is now occupied by nucleosomes.
Figure 4.

ATAC-seq V-plots show nucleosome repositioning, while accessibility is maintained at transcription start sites. (A–E) ATAC-seq data for the set of TSSs that display the lowest 20% accessible peaks in mitotic chromatin; (F–J) ATAC-seq data for the set of TSSs that display the highest 20% accessible peaks in mitotic chromatin. (A,B) V-plots of ATAC-seq signal aggregated at TSSs in nonsynchronized cells (A) and mitotic chromatin (B). (C) Side-by-side comparison of the V-plots of low accessible TSSs for nonsynchronized cells and mitotic chromatin. (D) Distribution of fragment length of reads with their midpoint on a TSS compared to the genome-wide average (dashed line): (arrows) read lengths representing 1 and 2 nucleosomes. (E) Distribution of fragment length of reads with either end in a TSS in mitotic chromatin compared to the genome-wide average (dashed line). In interphase, reads representing one flanking nucleosome are longer (red arrow) compared with reads representing one flanking nucleosome in mitosis (black arrow). (F,G) V-plots of ATAC-seq signal aggregated at TSSs that display the highest 20% accessibility in mitotic chromatin for nonsynchronized cells (F) and mitotic chromatin (G). (H) Side-by-side comparison of the V-plots shown in F and G. (I) Distribution of fragment length of reads with their midpoint on a TSS with highest 20% highest accessible peaks in mitotic chromatin compared with genome-wide average (dashed line): (arrows) read lengths representing 1 and 2 nucleosomes. (J) Distribution of fragment length of reads with either end in a TSS with highest 20% highest accessible peaks in mitotic chromatin compared with the genome-wide average (dashed line). For mitotic chromatin, reads representing one flanking nucleosome are of similar length (black arrow) compared with reads representing one flanking nucleosome in interphase (red arrow).
The set of TSSs that maintain high levels of accessibility in mitosis however behaves differently. For this set of TSSs, we continue to observe an enrichment of short fragments (below 150 bp) compared with the genome-wide average and larger fragments covering the flanking nucleosomes (Fig. 4J, arrows), suggesting that some factors remain bound to the TSSs. This is also observed by a lack of downward shift of nucleosome-sized fragments along the arms in the V (Fig. 4G,H, cf. arrows). However, as indicated above, some increase in nucleosome occupancy at the TSS is observed in mitosis, suggesting that this set of TSSs is heterogeneous with some sites gaining nucleosomes, while other sites maintain interphase nucleosome positioning. The presence of a subset of TSSs with repositioned nucleosomes in mitosis is also reflected in the gain of horizontal bands in the V-plot (Fig. 4G,H). As discussed above, the horizontal banding pattern is a result of repositioned nucleosomes that have altered linker lengths than the genome-wide average.
CUT&RUN directly detects loss of CTCF binding in prometaphase
Next, we set out to detect CTCF binding directly. Given concerns about formaldehyde-induced artifacts that affect protein binding to mitotic chromosomes (discussed above) (Pallier et al. 2003; Teves et al. 2016; Festuccia et al. 2019), we decided not to use ChIP-seq. Instead, we use CUT&RUN (Skene and Henikoff 2017). CUT&RUN uses a protein A-MNase fusion to target proteins of interest labeled by primary antibodies. Upon addition of calcium ions, protein A-MNase will digest DNA bound by the protein of interest, after which short digested DNA fragments can be isolated, amplified, and sequenced. In contrast to ChIP-seq, CUT&RUN can be done on unfixed cells, and it does not require any pull down of molecules. CUT&RUN signal for CTCF shows a very clear peak at accessible CTCF motifs in interphase. However, in mitosis, the signal diminishes to almost background levels (Fig. 5A). Even prolonged digestion did not reveal CTCF binding in mitotic (prometaphase) cells (Supplemental Fig. S8). We analyzed CTCF binding in different obvious classes of CTCF motifs, e.g., sites with an ENCODE CTCF ChIP-seq peak or sites proximal to TSSs (Supplemental Fig. S9). None of these sites showed CTCF CUT&RUN signal in prometaphase cells. Furthermore, when we represent CTCF CUT&RUN signal of each motif sorted on signal strength, there are no CTCF sites found that maintain CTCF binding (Supplemental Fig. S10). This suggests that CTCF binding does not just become weaker in prometaphase, but that essentially all motif-specific binding is lost.
Figure 5.

CUT&RUN data show loss of CTCF binding at CTCF motifs in mitosis, while H2A.Z and H3K4 methylation marks are maintained. (A) Aggregation plot of CTCF CUT&RUN signal of reads shorter than 120 bp after 10 min digestion. Reads are aggregated on CTCF motifs that display an interphase ATAC-seq peak. (B–D) CUT&RUN signal for H2A.Z (B), H3K4me1 (C), H3K4me3 (D) of reads longer than 120 bp after 30 min digestion. Reads are aggregated at CTCF motifs with interphase ATAC-seq peak.
Next, we wanted to determine whether CTCF gains binding at other sites specifically in prometaphase. Whereas de novo peak calling of CTCF CUT&RUN data in interphase identified 7824 peaks, in mitotic cells only 107 peaks were identified (Supplemental Fig. S11). This suggests there is very little site-specific binding in mitosis. It has been described that CTCF becomes highly phosphorylated in mitosis (Dephoure et al. 2008). To ensure the loss of CUT&RUN signal is not caused by the inability of the CTCF antibody to recognize phosphorylated CTCF, we performed Western blot with lysates of nonsynchronized cells, mitotic cells, and mitotic chromatin (Supplemental Fig. S12). The antibody detected CTCF in both nonsynchronized and mitotic cell extracts. However, we did not detect CTCF in extracts from mitotic chromatin (Supplemental Fig. S12). This indicates again that CTCF binding in mitosis is lost and when isolating chromatin from prometaphase arrested cells, CTCF is not copurified with the chromatin.
Histone marks and variants at active CTCF sites are maintained in mitosis
There are several histone characteristics described that are associated with CTCF-bound motifs in interphase. The histone variant H2A.Z is often observed in nucleosomes flanking CTCF sites and TSSs (Fu et al. 2008; Kelly et al. 2010; Nekrasov et al. 2012). Additionally, several histone modifications have been found around bound CTCF motifs; for example H3K4me1 for motifs distal to TSSs and H3K4me3 for motifs proximal to TSSs (Fu et al. 2008). In order to assay the presence of these histone marks and variants, we performed CUT&RUN. For H2A.Z and H3K4 mono- and trimethylation, we observe two distinct peaks around the CTCF motif in nonsynchronized cells (Fig. 5B–D). This confirms our observations in V-plots of ATAC-seq data, where the CTCF flanking nucleosomes are strongly positioned relative to distance from the CTCF motif in interphase due to CTCF binding.
Many histone marks and variants have been suggested to serve as mitotic bookmarks for factor binding (for review, see Wang and Higgins 2013). Both H2A.Z and H3K4 methylation states have been observed throughout the cell cycle (Kelly et al. 2010; Nekrasov et al. 2012; Liu et al. 2017; Javasky et al. 2018). Using CUT&RUN, we observed that H2A.Z binding and H3K4 methylation states are maintained at CTCF sites during mitosis, although CTCF binding is temporarily lost (Fig. 5B–D). We note that the level of H3K4me1 is reduced during mitosis, in contrast to H3K4me3 for which signal strength is similar in interphase and mitosis. It has been previously shown that H3K4me3 typically gets rapidly reestablished on histones on both sister chromatids in S-phase, whereas H3K4me1 levels do not get restored until after cell division (Lin et al. 2016). A 50% reduction in H3K4me1 levels as a result of dilution over the two sister chromatids is consistent with the reduced levels observed by CUT&RUN. As described, we observe two strong peaks in H2A.Z and H3K4 methylation signal flanking the CTCF motif in interphase; however, in mitosis these peaks become weaker and form two broader peaks with a less defined valley in between. This is in concordance with ATAC-seq data, in which we observed rearrangement of the nucleosomes and filling in of the nucleosome depleted regions (NDRs) at CTCF in mitosis.
We then analyzed H2A.Z and H3K4me3 levels at TSSs detected by CUT&RUN in interphase and mitosis. In line with previous studies and our CUT&RUN data at and around CTCF sites, we found that H2A.Z and H3K4me3 levels are maintained at TSSs in prometaphase (Supplemental Fig. S13; Kelly et al. 2010; Varier et al. 2010; Nekrasov et al. 2012; Wang and Higgins 2013; Lin et al. 2016; Javasky et al. 2018). Additionally, we observe loss of depletion of histone signal at TSSs in prometaphase, similar to CTCF sites. This is an indication that nucleosomes reposition and occupy at least a subset of TSSs, consistent with our observations in ATAC-seq V-plots (Fig. 4).
Live-cell imaging shows that CTCF is not enriched on prometaphase chromosomes and that essentially all specific binding is lost
Genomic and imaging studies have occasionally reported contradicting findings when it comes to factor binding to prometaphase chromatin. To independently validate our observation using genomics techniques that essentially all site-specific CTCF binding is lost during prometaphase, we turned to live-cell imaging and applied a three-pronged approach based on long-term time-lapse imaging, Fluorescence Recovery After Photobleaching (FRAP), and Single-Particle Tracking (SPT). We previously generated and validated a U2OS cell line in which all CTCF alleles have been Halo-tagged (C32 Halo-CTCF) (Hansen et al. 2017). To visualize mitotic cells, we additionally stably integrated a histone H2B-GFP transgene. We performed ATAC-seq on this cell line and observed the expected loss of accessibility at CTCF sites in mitosis and loss of the CTCF footprint represented in V-plots (Supplemental Figs. S5E,F, S6G,H). First, we used multihour time-lapse fluorescence microscopy to observe Halo-CTCF (Supplemental Movie S1, S2) and H2B-GFP (Supplemental Movie S2) in actively dividing cells. Although CTCF was clearly enriched on mitotic chromosomes during most phases of mitosis (e.g., telophase), CTCF localization appeared to be diffuse during prometaphase. Second, to quantify CTCF binding dynamics, we used FRAP. As for the genomics experiments, we used nocodazole to arrest cells in prometaphase. As we observed with time-lapse microscopy, CTCF showed a diffuse localization without clear enrichment on mitotic chromosomes during prometaphase (Fig. 6A, upper panel). To rule out any artifacts due to nocodazole drug treatment, we also identified cells in prometaphase without drug treatment based on their H2B-GFP localization (“prometaphase-enriched”) and similarly observed diffuse CTCF localization without enrichment on chromatin.
Figure 6.

Live-cell imaging shows large loss of CTCF binding in mitosis. (A) Halo-CTCF and H2B-GFP localization of representative U2OS cells for prometaphase arrested cells and nonarrested cells selected as prometaphase (“prometaphase-enriched”). (B) FRAP for Halo-CTCF in interphase, prometaphase arrested, and prometaphase-enriched cells. (C) Controls showing FRAP for H2B-Halo in interphase and prometaphase arrested cells and for Halo-3×NLS in interphase cells. (D) Single-particle tracking displacement statistics for Halo-CTCF in different timeframes in interphase, prometaphase arrested, and prometaphase-enriched cells. (E) Displacement cumulative distribution function (CDFs) derived from single-particle tracking at Δτ 22.5 msec for interphase, prometaphase arrested, and prometaphase-enriched cells. (F) Fraction bound of Halo-CTCF calculated using the Spot-On model in interphase, prometaphase arrested, and prometaphase-enriched cells (Hansen et al. 2018a).
We then performed FRAP, bleaching a ∼1 µm circle and quantifying the recovery (Hansen et al. 2017). In interphase, Halo-CTCF showed slow recovery consistent with a high fraction of chromatin binding to specific CTCF sites with an apparent residence time of a few minutes (Fig. 6B; Hansen et al. 2017). However, in prometaphase, Halo-CTCF showed ∼90%–95% recovery within seconds as well as a fraction of the population (∼5%–10%) which showed slower recovery suggesting stable binding by only a small subpopulation (Fig. 6B). We validated our FRAP approach and show that the difference in recovery was not due to improper drift-correction using histone H2B controls (note that the H2B bleach depth is slightly lower in prometaphase due to “gaps” between chromosomes, but that the rate of recovery is unchanged) (Fig. 6C). Thus, in prometaphase, although a small population approaching our detection limit (∼5%–10%) does appear to bind specific sites with a residence time in the minute range, the vast majority of specific CTCF binding is clearly lost, which is consistent with the genomics experiments. We conclude that nearly all specific CTCF binding is lost in prometaphase.
Third and finally, we sought to verify this using an independent technique and used stroboscopic photoactivation single-particle tracking (spaSPT). spaSPT makes it possible to observe single CTCF molecules in live cells and to visualize both bound (specific and nonspecific) and freely diffusing molecules without motion-blur bias (Hansen et al. 2017, 2018b). We then tracked single CTCF molecules at 134 Hz in interphase (Supplemental Movie S3), in nocodazole-arrested prometaphase (Supplemental Movie S4) and in “prometaphase-enriched” cells (Supplemental Movie S5) and quantified the distribution of displacements between frames. Analysis of the cumulative distribution function (CDF) revealed that nearly all CTCF chromatin binding was lost in prometaphase (bound molecules typically appear below 150 nm) (Fig. 6D,E). To quantitatively analyze the spaSPT data, we fit a two-state kinetic model (Spot-On), wherein CTCF can exist in either a bound (both specific and transient nonspecific binding) and free state (Fig. 6D; Hansen et al. 2017, 2018b). This revealed that whereas ∼55% of CTCF molecules are chromatin bound in interphase, only ∼10%–14% are bound in prometaphase (Fig. 6F). Because this bound population includes transient nonspecific binding, these results independently confirm the FRAP results (Fig. 6B). In summary, our live-cell imaging results independently confirm that nearly all specific CTCF binding is lost during prometaphase and, additionally, that this observation is not an artifact of nocodazole treatment.
Discussion
Our study presents a comprehensive analysis of CTCF binding and CTCF motif-flanking nucleosomes in mitosis using several complimentary techniques and multiple differentiated cell lines. Genomics and live-cell imaging techniques show that overall CTCF binding is lost in mitosis, as are TADs and loops between CTCF sites. We did not find any subgroup of CTCF sites that maintain binding in mitosis, nor did we find any new sites of mitotic CTCF binding. This, together with the known loss of cohesin during prophase, could explain why TADs and CTCF loops are not observed in mitosis (Waizenegger et al. 2000; Losada et al. 2002; Liang et al. 2015; Nagasaka et al. 2016). In addition to this, we found that nucleosomes flanking interphase CTCF sites rearrange in prometaphase, resulting in nucleosomes occupying the CTCF motif and forming an array of nucleosomes with larger and more variable linkers (Fig. 7). Furthermore, similar phenomena can occur at TSSs, although these sites remain hyperaccessible as observed by ATAC-seq. Epigenetic marks, such as histone variant H2A.Z and H3K4 methylation marks, are maintained at both CTCF sites and TSSs in mitosis.
Figure 7.
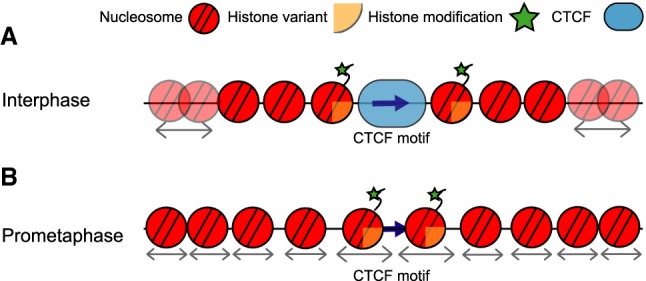
Dynamics of CTCF binding and chromatin organization around active CTCF motifs throughout the cell cycle. (A) In interphase, CTCF is bound to its motif and flanking nucleosomes are strongly positioned relative to the motif, in contrast to nucleosomes further away from the motif, as indicated by arrows. Flanking nucleosomes are characterized by histone variants and modifications. (B) In prometaphase, CTCF binding is temporarily lost and nucleosomes rearrange to fill in the nucleosome depleted region at the CTCF motif. This increases the linker lengths between adjacent nucleosomes. Epigenetic marks, however, are maintained, possibly functioning as bookmarks that enable inheritance of active CTCF motifs throughout the cell cycle. Arrows underneath nucleosomes indicate that the position of these nucleosomes can vary between cells.
Previous studies found evidence for CTCF binding to mitotic chromosomes using imaging and chromatin fractionation approaches (Burke et al. 2005; Liu et al. 2017; Cai et al. 2018). Additionally, proteomics studies of isolated mitotic chromatin detect CTCF, although at reduced levels compared to interphase chromatin (Ohta et al. 2010; Gibcus et al. 2018). However, all of these approaches measure general mitotic chromatin association and do not capture information on site-specific binding (Raccaud and Suter 2018; Raccaud et al. 2018; Festuccia et al. 2019). Our live-cell imaging data also indicate that CTCF remains associated with chromatin during several stages of mitosis; however, in prometaphase, CTCF binding dynamics are changed and the vast majority of specific and stable binding is lost. This is complementary to our findings using genomics techniques, in which we also observe loss of CTCF binding at interphase sites and we do not find any mitotic site-specific binding. It is possible that CTCF remains associated with mitotic chromatin, although in a nonspecific and highly dynamic manner. First, mitotic chromatin retention could enable proper segregation of CTCF levels over the daughter cells. Second, maintained chromatin association can enable efficient reestablishment of CTCF binding upon mitotic exit. A recent study observed a rapid raise of CTCF levels associated to the chromatin in late anaphase, as for many other chromatin binding factors (Cai et al. 2018). The hypothesis that chromatin binding factors retaining chromatin association in mitosis, although losing motif-specific binding, has been tested using imaging techniques in recent studies (Raccaud et al. 2018; Festuccia et al. 2019). Additionally, we note that CTCF may show cell-type–specific dynamics in prometaphase. Our study observes CTCF cell cycle dynamics of differentiated cells, using both transformed and nontransformed cell lines.
Transcription start sites are highly accessible and free of nucleosomes in nonsynchronized cells that are mostly in interphase. In contrast to CTCF sites, TSSs remain hyperaccessible during mitosis. This has also been observed by DNase I sensitivity assays (Martínez-Balbás et al. 1995; Hsiung et al. 2015). Here, we find that despite remaining highly accessible, nucleosome-sized ATAC-seq fragments are detected at TSSs in mitosis indicating that nucleosomes are able to occupy these sites, and that the spacing between flanking nucleosomes becomes larger and more variable compared with genome-wide average, similar to what we observed at and around CTCF sites. These observations are consistent with a recent study that found that a large fraction of NDRs at TSSs become filled in by a nucleosome that is marked with H3K4 methylation (Javasky et al. 2018). The fact that TSSs remain hyperaccessible suggests either that TSSs become occupied by nucleosomes in only a subset of cells in the population, or that nucleosomes rearrange in all cells, creating linkers between adjacent nucleosomes at TSSs that are relatively large and thus more accessible than the genome-wide average. Long linkers between the nucleosomes would be expected if flanking nucleosomes reposition across the relatively large interphase nucleosome-free regions around TSSs in the absence of de novo nucleosome assembly.
The level of nucleosome occupancy at the TSS is directly related to the remaining accessibility during mitosis. We find that the set of most accessible TSSs in mitosis has low levels of nucleosome occupancy, although this level is higher than in interphase. This set of most accessible TSSs also shows evidence that the TSS can frequently remain free of nucleosomes, with no changes in the positions of the directly flanking nucleosomes. One parsimonious interpretation of these data is that TSSs are variable in the extent to which nucleosomes reposition during mitosis. This variability can be at the level of single cells for individual TSSs, or at the level of subsets of TSSs where some sets remain bound by factors that maintain an open nucleosome-free site in most cells. TBP has been described as a factor that can maintain stable binding to at least a subset of promoters (Chen et al. 2002; Xing et al. 2008; Teves et al. 2018). TBP, possibly together with histone modifications that remain stable in mitosis, may serve as bookmarks for reactivation of promoters in the subsequent cell cycle. Because we do not find any evidence that CTCF or other factors remain associated with CTCF sites in mitosis, we propose that the continued presence of modified histones and histone variants such as H2A.Z around CTCF motifs, and the larger spacing between adjacent nucleosomes around the site, are sufficient for marking these sites for rebinding of CTCF as cells exit mitosis.
Both H2A.Z and H3K4 methylation marks have been studied in regard to their role as mitotic bookmarks at promoters. H2A.Z has been described to form a heterodimer with H3.3 that can fill in the NDRs of promoter regions in mitosis (Jin et al. 2009; Kelly et al. 2010; Nekrasov et al. 2012). The H3.3/H2A.Z heterodimer is found to be less stable than its canonical H3/H2A counterpart and often repositioned or removed by chromatin remodelers. It has been suggested that H3.3/H2A.Z could be a place holder for transcription factors in mitosis. Upon mitotic exit, chromatin remodelers can be recruited to sites of H3.3/H2A.Z and open up NDRs, which will enable transcription factors to bind at its interphase sites again (Nekrasov et al. 2012). Both H3K4 monomethylation and trimethylation are maintained in mitosis (Fig. 5; Supplemental Fig. S13; Varier et al. 2010; Lin et al. 2016). Recently it was observed that a large fraction of NDRs at TSSs become filled in by a nucleosome that is marked with H3K4 methylation and loss of histone acetylation (Javasky et al. 2018). Therefore, the nucleosomes that fill in NDRs stand out compared to their flanking nucleosomes that will still have acetylation marks. This could be another mechanism for specific recruitment of chromatin remodelers upon mitotic exit to these bookmarked sites, which could enable reestablishment of interphase factor binding.
We find that chromatin organization around CTCF sites alternates between two distinct states during the cell cycle (Fig. 7A,B). To convert from one state to the other, a number of molecular events must likely take place. First, as cells enter mitosis, CTCF dissociates from the chromatin. This may involve phosphorylation of CTCF, which reduces its affinity for DNA in vitro (Dovat et al. 2002; Jantz and Berg 2004; Dephoure et al. 2008; Sekiya et al. 2017). The mechanism by which nucleosomes become repositioned is not known. It is possible that simply the removal of CTCF, and associated factors such as cohesin, is sufficient for nucleosomes to passively reposition and occupy the CTCF motif. Alternatively, it is possible that specific remodeling enzymes act at CTCF sites during mitosis. Sometime during or after mitotic exit, CTCF regains site-specific binding. This likely involves dephosphorylation of CTCF. Rebinding at CTCF motifs could be facilitated by the relative large linkers between nucleosomes around previously bound CTCF sites and the presence of histone variants and histone modifications. CTCF rebinding correlates with repositioning of the flanking nucleosomes. How CTCF rebinding and nucleosome repositioning are mechanistically linked remains unknown. CTCF binding could passively lead to nucleosome repositioning, or a process of active chromatin remodeling could precede CTCF binding.
The molecular events occurring at CTCF sites during the cell cycle coincide with large-scale changes in higher order chromosomal folding, where TADs and loops are present in interphase and absent in prometaphase. The recently proposed model of loop extrusion explains how such localized events of CTCF binding can determine the formation of TADs and loops at the scale of hundreds of kilobases (Sanborn et al. 2015; Dekker and Mirny 2016; Fudenberg et al. 2016; Hansen et al. 2017). This model proposes that during interphase, dynamic loop extrusion by cohesin is blocked by CTCF-bound sites. This process leads to TAD formation and loops between convergent CTCF sites (Rao et al. 2014; de Wit et al. 2015; Guo et al. 2015; Vietri Rudan et al. 2015). Taken together, our data on CTCF and published data on cohesin (Waizenegger et al. 2000; Losada et al. 2002; Liang et al. 2015; Nagasaka et al. 2016) show that the absence of TADs and CTCF loops in mitosis can be explained by the dissociation of the entire interphase loop extrusion machinery. Upon mitotic exit, condensins become inactivated and CTCF and cohesin reassociate rapidly (Cai et al. 2018), allowing the reestablishment of CTCF loops and TADs.
Methods
Cell culture and synchronization
HeLa S3 and HFF cells were grown at 37°C in Gibco glutamax DMEM supplemented with 10% heat-inactivated fetal bovine serum (FBS) and penicillin-streptomycin. We previously generated a U2OS cell line in which CTCF has been homozygously and endogenously tagged with HaloTag (FLAG-Halo-hCTCF; C32) (Hansen et al. 2017). To additionally enable the visualization of mitotic cells, we stably integrated a previously described transgene expressing histone H2B-GFP with Puro selection (Teves et al. 2016). U2OS cells were cultured in low glucose DMEM with 10% FBS and penicillin-streptomycin. Cells were synchronized using thymidine and nocodazole treatments, which was tailored for each cell line. See Supplemental Methods for detailed description.
Flow cytometry and DAPI staining
The level of mitotic synchrony in all cultures grown for genomic studies was observed by performing flow cytometry for cell cycle analysis using propidium iodide staining in ethanol fixed cells. In addition to this, cells were also stained using DAPI to determine the fraction of prometaphase cells in total culture based on chromatin condensation.
Mitotic chromatin cluster purification
Mitotic chromatin clusters were purified according to a previously published protocol with minor changes (Gasser and Laemmli 1987). A detailed description can be found in Supplemental Materials and Methods. Mitotic chromatin clusters can be frozen at −80°C in 33.33% glycerol. Chromatin clusters were used for ATAC-seq both directly after chromatin cluster purification and after freezing. Supplemental Figure S14 shows fresh or frozen clusters obtain highly similar results for ATAC-seq. For this reason, we continued using frozen chromatin clusters for all further ATAC-seq experiments. Mitotic chromatin clusters for 5C were immediately fixed in 1% formaldehyde before pelleting and storage at −80°C.
Genomics studies
5C was performed according to published protocols (Dostie et al. 2006). We investigated the same regions as previously described, and we used the same primer pool (Hnisz et al. 2016). This 5C primer pool covers two 2-Mb regions located on Chromosome 1 (hg19 Chr 1: 46,740,122–48,740,121) and Chromosome 11 (hg19 Chr 11: 33,003,550–35,003,549). Full 5C interaction heatmaps are represented in Supplemental Figure S2. 5C mapping statistics can be found in Supplemental Table S1. ATAC-seq was performed following a previously published protocol (Buenrostro et al. 2015). Details on how V-plots were produced and additional protocol information can be found in Supplemental Materials and Methods. V-plots of unnormalized length bins and V-plots of a randomized region are shown in Supplemental Figure S15. CUT&RUN was performed according to the published protocol (Skene and Henikoff 2017). Because mitotic cells do not have a nuclear membrane, it was not possible to use concanavalin A beads. Instead, cells were spun at 600g for 3 min at 4°C for every wash or buffer exchange. Details of all genomics techniques can be found in the Supplemental Materials and Methods. A list of antibodies used for CUT&RUN can be found in Supplemental Table S2.
Live-cell imaging studies
FRAP and spaSPT experiments were performed and analyzed as previously described (Hansen et al. 2017). Time-lapse movies were recorded using phase, GFP (for H2B-GFP), and TMR (for Halo-CTCF) acquiring one frame every 2 or 5 min and lasting for a total time of at least 10 h, enough that several cells in a field of view went through mitosis. CTCF was clearly enriched on mitotic chromosomes during most phases of mitosis. Raw data as well as details on all imaging techniques and analysis of spaSPT using Spot-On can be found in the Supplemental Materials and Methods.
Bioinformatic analyses
All genomics data were mapped to hg19 to enable to usage of ENCODE data sets available. Because we remove all blacklisted regions of hg19 as determined by the ENCODE project, we expect that our data mapped to GRCh38 would show highly similar results (The ENCODE Project Consortium 2012). A detailed description of all bioinformatic analyses in this study can be found in the Supplemental Materials and Methods. The Spot-On code is available at Gitlab (https://gitlab.com/tjian-darzacq-lab/spot-on-matlab and https://gitlab.com/tjian-darzacq-lab/SPT_LocAndTrack) (Supplemental Code S1-2). Code used for analysis of ATAC-seq and CUT&RUN data can be found at GitHub (https://github.com/dekkerlab/CTCF_in_mitosis_GR_2018) (Supplemental Code S3). Scripts used for 5C analysis can also be found at GitHub (https://github.com/dekkerlab/cworld-dekker) (Supplemental Code S4).
Data access
All genomic data generated for this study have been submitted to the NCBI Gene Expression Omnibus (GEO; https://www.ncbi.nlm.nih.gov/geo/) under accession number GSE121840. All imaging data are publicly available at Zenodo (https://zenodo.org/record/1306976).
Supplementary Material
Acknowledgments
We thank Sarah Hainer and Tom Fazzio for advice on ATAC-seq data interpretation and providing reagents. We also thank Bas van Steensel for advice and suggestions. We thank Sheila Teves and all current and former Dekker laboratory members for helpful discussions, especially Betul Akgol Oksuz, Bryan Lajoie, Ankita Nand, and Hakan Ozadam for advice on data analysis, and Allana Schooley for helpful comments regarding the manuscript. J.D. and X.D. acknowledge support from the National Institutes of Health Common Fund 4D Nucleome Program (U54-DK107980 and UO1-EB021236). Additionally, this work was supported by grants from the National Human Genome Research Institute (HG003143) to J.D. and the California Institute of Regenerative Medicine (LA1-08013) to X.D. This work was performed in part at the UC Berkeley CRL Molecular Imaging Center, supported by the Gordon and Betty Moore Foundation. A.S.H. is a postdoctoral fellow of the Siebel Stem Cell Institute. J.D. is an investigator of the Howard Hughes Medical Institute.
Author contributions: M.E.O. and J.D. conceived and designed the project. Y.L. and M.E.O. preformed 5C. M.E.O. generated ATAC-seq and CUT&RUN data sets. A.S.H. generated the U2OS cell line and designed, performed, and analyzed all imaging experiments. M.E.O. analyzed 5C, ATAC-seq, and CUT&RUN data sets. M.E.O., A.S.H., X.D., and J.D. wrote the manuscript.
Footnotes
[Supplemental material is available for this article.]
Article published online before print. Article, supplemental material, and publication date are at http://www.genome.org/cgi/doi/10.1101/gr.241547.118.
References
- Adolph KW. 1980. Organization of chromosomes in mitotic HeLa cells. Exp Cell Res 125: 95–103. 10.1016/0014-4827(80)90193-7 [DOI] [PubMed] [Google Scholar]
- Buenrostro JD, Giresi PG, Zaba LC, Chang HY, Greenleaf WJ. 2013. Transposition of native chromatin for fast and sensitive epigenomic profiling of open chromatin, DNA-binding proteins and nucleosome position. Nat Methods 10: 1213–1218. 10.1038/nmeth.2688 [DOI] [PMC free article] [PubMed] [Google Scholar]
- Buenrostro JD, Wu B, Chang HY, Greenleaf WJ. 2015. ATAC-seq: a method for assaying chromatin accessibility genome-wide. Curr Protoc Mol Biol 2015: 21.29.1–21.29.9. 10.1002/0471142727.mb2129s109 [DOI] [PMC free article] [PubMed] [Google Scholar]
- Burke LJ, Zhang R, Bartkuhn M, Tiwari VK, Tavoosidana G, Kurukuti S, Weth C, Leers J, Galjart N, Ohlsson R, et al. 2005. CTCF binding and higher order chromatin structure of the H19 locus are maintained in mitotic chromatin. EMBO J 24: 3291–3300. 10.1038/sj.emboj.7600793 [DOI] [PMC free article] [PubMed] [Google Scholar]
- Cai Y, Hossain MJ, Hériché JK, Politi AZ, Walther N, Koch B, Wachsmuth M, Nijmeijer B, Kueblbeck M, Martinic-Kavur M, et al. 2018. Experimental and computational framework for a dynamic protein atlas of human cell division. Nature 561: 411–415. 10.1038/s41586-018-0518-z [DOI] [PMC free article] [PubMed] [Google Scholar]
- Chen D, Hinkley CS, Henry RW, Huang S. 2002. TBP dynamics in living human cells: constitutive association of TBP with mitotic chromosomes. Mol Biol Cell 13: 276–284. 10.1091/mbc.01-10-0523 [DOI] [PMC free article] [PubMed] [Google Scholar]
- Chen D, Dundr M, Wang C, Leung A, Lamond A, Misteli T, Huang S. 2005. Condensed mitotic chromatin is accessible to transcription factors and chromatin structural proteins. J Cell Biol 168: 41–54. 10.1083/jcb.200407182 [DOI] [PMC free article] [PubMed] [Google Scholar]
- Crane E, Bian Q, McCord RP, Lajoie BR, Wheeler BS, Ralston EJ, Uzawa S, Dekker J, Meyer BJ. 2015. Condensin-driven remodelling of X chromosome topology during dosage compensation. Nature 523: 240–244. 10.1038/nature14450 [DOI] [PMC free article] [PubMed] [Google Scholar]
- de Wit E, Vos ES, Holwerda SJ, Valdes-Quezada C, Verstegen MJ, Teunissen H, Splinter E, Wijchers PJ, Krijger PH, de Laat W. 2015. CTCF binding polarity determines chromatin looping. Mol Cell 60: 676–684. 10.1016/j.molcel.2015.09.023 [DOI] [PubMed] [Google Scholar]
- Dekker J, Mirny L. 2016. The 3D genome as moderator of chromosomal communication. Cell 164: 1110–1121. 10.1016/j.cell.2016.02.007 [DOI] [PMC free article] [PubMed] [Google Scholar]
- Dephoure N, Zhou C, Villen J, Beausoleil SA, Bakalarski CE, Elledge SJ, Gygi SP. 2008. A quantitative atlas of mitotic phosphorylation. Proc Natl Acad Sci 105: 10762–10767. 10.1073/pnas.0805139105 [DOI] [PMC free article] [PubMed] [Google Scholar]
- Dixon JR, Selvaraj S, Yue F, Kim A, Li Y, Shen Y, Hu M, Liu JS, Ren B. 2012. Topological domains in mammalian genomes identified by analysis of chromatin interactions. Nature 485: 376–380. 10.1038/nature11082 [DOI] [PMC free article] [PubMed] [Google Scholar]
- Dostie J, Richmond TA, Arnaout RA, Selzer RR, Lee WL, Honan TA, Rubio ED, Krumm A, Lamb J, Nusbaum C, et al. 2006. Chromosome Conformation Capture Carbon Copy (5C): a massively parallel solution for mapping interactions between genomic elements. Genome Res 16: 1299–1309. 10.1101/gr.5571506 [DOI] [PMC free article] [PubMed] [Google Scholar]
- Dovat S, Ronni T, Russell D, Ferrini R, Cobb BS, Smale ST. 2002. A common mechanism for mitotic inactivation of C2H2 zinc finger DNA-binding domains. Genes Dev 16: 2985–2990. 10.1101/gad.1040502 [DOI] [PMC free article] [PubMed] [Google Scholar]
- Dowen JM, Bilodeau S, Orlando DA, Hübner MR, Abraham BJ, Spector DL, Young RA. 2013. Multiple structural maintenance of chromosome complexes at transcriptional regulatory elements. Stem Cell Reports 1: 371–378. 10.1016/j.stemcr.2013.09.002 [DOI] [PMC free article] [PubMed] [Google Scholar]
- Earnshaw WC, Laemmli UK. 1983. Architecture of metaphase chromosomes and chromosome scaffolds. J Cell Biol 96: 84–93. 10.1083/jcb.96.1.84 [DOI] [PMC free article] [PubMed] [Google Scholar]
- The ENCODE Project Consortium. 2012. An integrated encyclopedia of DNA elements in the human genome. Nature 489: 57–74. 10.1038/nature11247 [DOI] [PMC free article] [PubMed] [Google Scholar]
- Ernst J, Kellis M. 2017. Chromatin-state discovery and genome annotation with ChromHMM. Nat Protoc 12: 2478–2492. 10.1038/nprot.2017.124 [DOI] [PMC free article] [PubMed] [Google Scholar]
- Festuccia N, Owens N, Papadopoulou T, Gonzalez I, Tachtsidi A, Vandoermel-Pournin S, Gallego E, Gutierrez N, Dubois A, Cohen-Tannoudji M, et al. 2019. Transcription factor activity and nucleosome organization in mitosis. Genome Res (this issue) 10.1101/gr.243048.118 [DOI] [PMC free article] [PubMed]
- Fu Y, Sinha M, Peterson CL, Weng Z. 2008. The insulator binding protein CTCF positions 20 nucleosomes around its binding sites across the human genome. PLoS Genet 4: e1000138 10.1371/journal.pgen.1000138 [DOI] [PMC free article] [PubMed] [Google Scholar]
- Fudenberg G, Imakaev M, Lu C, Goloborodko A, Abdennur N, Mirny LA. 2016. Formation of chromosomal domains by loop extrusion. Cell Rep 15: 2038–2049. 10.1016/j.celrep.2016.04.085 [DOI] [PMC free article] [PubMed] [Google Scholar]
- Gasser SM, Laemmli UK. 1987. Improved methods for the isolation of individual and clustered mitotic chromosomes. Exp Cell Res 173: 85–98. 10.1016/0014-4827(87)90334-X [DOI] [PubMed] [Google Scholar]
- Gibcus JH, Samejima K, Goloborodko A, Samejima I, Naumova N, Nuebler J, Kanemaki MT, Xie L, Paulson JR, Earnshaw WC, et al. 2018. A pathway for mitotic chromosome formation. Science 359: eaao6135 10.1126/science.aao6135 [DOI] [PMC free article] [PubMed] [Google Scholar]
- Goloborodko A, Imakaev MV, Marko JF, Mirny L. 2016. Compaction and segregation of sister chromatids via active loop extrusion. eLife 5: e14864 10.7554/eLife.14864 [DOI] [PMC free article] [PubMed] [Google Scholar]
- Guo Y, Xu Q, Canzio D, Shou J, Li J, Gorkin DU, Jung I, Wu H, Zhai Y, Tang Y, et al. 2015. CRISPR inversion of CTCF sites alters genome topology and enhancer/promoter function. Cell 162: 900–910. 10.1016/j.cell.2015.07.038 [DOI] [PMC free article] [PubMed] [Google Scholar]
- Hansen AS, Pustova I, Cattoglio C, Tjian R, Darzacq X. 2017. CTCF and cohesin regulate chromatin loop stability with distinct dynamics. eLife 6: e25776 10.7554/eLife.25776 [DOI] [PMC free article] [PubMed] [Google Scholar]
- Hansen AS, Cattoglio C, Darzacq X, Tjian R. 2018a. Recent evidence that TADs and chromatin loops are dynamic structures. Nucleus 9: 20–32. 10.1080/19491034.2017.1389365 [DOI] [PMC free article] [PubMed] [Google Scholar]
- Hansen AS, Woringer M, Grimm JB, Lavis LD, Tjian R, Darzacq X. 2018b. Robust model-based analysis of single-particle tracking experiments with Spot-On. eLife 7: e33125 10.7554/eLife.33125 [DOI] [PMC free article] [PubMed] [Google Scholar]
- Heinz S, Benner C, Spann N, Bertolino E, Lin YC, Laslo P, Cheng JX, Murre C, Singh H, Glass CK. 2010. Simple combinations of lineage-determining transcription factors prime cis-regulatory elements required for macrophage and B cell identities. Mol Cell 38: 576–589. 10.1016/j.molcel.2010.05.004 [DOI] [PMC free article] [PubMed] [Google Scholar]
- Hnisz D, Weintraub AS, Day DS, Valton A, Bak RO, Li CH, Goldmann J, Lajoie BR, Fan ZP, Sigova AA, et al. 2016. Activation of proto-oncogenes by disruption of chromosome neighborhoods. Science 351: 1454–1458. 10.1126/science.aad9024 [DOI] [PMC free article] [PubMed] [Google Scholar]
- Hochegger H, Dejsuphong D, Sonoda E, Saberi A, Rajendra E, Kirk J, Hunt T, Takeda S. 2007. An essential role for Cdk1 in S phase control is revealed via chemical genetics in vertebrate cells. J Cell Biol 178: 257–268. 10.1083/jcb.200702034 [DOI] [PMC free article] [PubMed] [Google Scholar]
- Hsiung CC, Morrissey CS, Udugama M, Frank CL, Keller CA, Baek S, Giardine B, Crawford GE, Sung MH, Hardison RC, et al. 2015. Genome accessibility is widely preserved and locally modulated during mitosis. Genome Res 25: 213–225. 10.1101/gr.180646.114 [DOI] [PMC free article] [PubMed] [Google Scholar]
- Jackman J, O'Connor PM. 2001. Methods for synchronizing cells at specific stages of the cell cycle. Curr Protoc Cell Biol Chapter 8: Unit 8.3 10.1002/0471143030.cb0803s00 [DOI] [PubMed] [Google Scholar]
- Jantz D, Berg JM. 2004. Reduction in DNA-binding affinity of Cys2His2 zinc finger proteins by linker phosphorylation. Proc Natl Acad Sci 101: 7589–7593. 10.1073/pnas.0402191101 [DOI] [PMC free article] [PubMed] [Google Scholar]
- Javasky E, Shamir I, Gandhi S, Egri S, Sandler O, Rothbart SB, Kaplan N, Jaffe JD, Goren A, Simon I. 2018. Study of mitotic chromatin supports a model of bookmarking by histone modifications and reveals nucleosome deposition patterns. Genome Res 28: 1455–1466. 10.1101/gr.230300.117 [DOI] [PMC free article] [PubMed] [Google Scholar]
- Jin C, Zang C, Wei G, Cui K, Peng W, Zhao K, Felsenfeld G. 2009. H3.3/H2A.Z double variant-containing nucleosomes mark ‘nucleosome-free regions’ of active promoters and other regulatory regions. Nat Genet 41: 941–945. 10.1038/ng.409 [DOI] [PMC free article] [PubMed] [Google Scholar]
- Kelly TK, Miranda TB, Liang G, Berman BP, Lin JC, Tanay A, Jones PA. 2010. H2A.Z maintenance during mitosis reveals nucleosome shifting on mitotically silenced genes. Mol Cell 39: 901–911. 10.1016/j.molcel.2010.08.026 [DOI] [PMC free article] [PubMed] [Google Scholar]
- Kim TH, Abdullaev ZK, Smith AD, Ching KA, Loukinov DI, Green R, Zhang MQ, Lobanenkov VV, Ren B. 2007. Analysis of the vertebrate insulator protein CTCF-binding sites in the human genome. Cell 128: 1231–1245. 10.1016/j.cell.2006.12.048 [DOI] [PMC free article] [PubMed] [Google Scholar]
- Liang Z, Zickler D, Prentiss M, Chang FS, Witz G, Maeshima K, Kleckner N. 2015. Chromosomes progress to metaphase in multiple discrete steps via global compaction/expansion cycles. Cell 161: 1124–1137. 10.1016/j.cell.2015.04.030 [DOI] [PMC free article] [PubMed] [Google Scholar]
- Lin S, Yuan ZF, Han Y, Marchione DM, Garcia BA. 2016. Preferential phosphorylation on old histones during early mitosis in human cells. J Biol Chem 291: 15342–15357. 10.1074/jbc.M116.726067 [DOI] [PMC free article] [PubMed] [Google Scholar]
- Liu Y, Pelham-Webb B, Di Giammartino DC, Li J, Kim D, Kita K, Saiz N, Garg V, Doane A, Giannakakou P, et al. 2017. Widespread mitotic bookmarking by histone marks and transcription factors in pluripotent stem cells. Cell Rep 19: 1283–1293. 10.1016/j.celrep.2017.04.067 [DOI] [PMC free article] [PubMed] [Google Scholar]
- Losada A, Hirano M, Hirano T. 2002. Cohesin release is required for sister chromatid resolution, but not for condensin-mediated compaction, at the onset of mitosis. Genes Dev 16: 3004–3016. 10.1101/gad.249202 [DOI] [PMC free article] [PubMed] [Google Scholar]
- Marsden MPF, Laemmli UK. 1979. Metaphase chromosome structure: evidence for a radial loop model. Cell 17: 849–858. 10.1016/0092-8674(79)90325-8 [DOI] [PubMed] [Google Scholar]
- Martínez-Balbás MA, Dey A, Rabindran SK, Ozato K, Wu C. 1995. Displacement of sequence-specific transcription factors from mitotic chromatin. Cell 83: 29–38. 10.1016/0092-8674(95)90231-7 [DOI] [PubMed] [Google Scholar]
- Nagano T, Lubling Y, Várnai C, Dudley C, Leung W, Baran Y, Mendelson Cohen N, Wingett S, Fraser P, Tanay A. 2017. Cell-cycle dynamics of chromosomal organization at single-cell resolution. Nature 547: 61–67. 10.1038/nature23001 [DOI] [PMC free article] [PubMed] [Google Scholar]
- Nagasaka K, Hossain MJ, Roberti MJ, Ellenberg J, Hirota T. 2016. Sister chromatid resolution is an intrinsic part of chromosome organization in prophase. Nat Cell Biol 18: 692–699. 10.1038/ncb3353 [DOI] [PubMed] [Google Scholar]
- Naumova N, Imakaev M, Fudenberg G, Zhan Y, Lajoie BR, Mirny LA, Dekker J. 2013. Organization of the mitotic chromosome. Science 342: 948–953. 10.1126/science.1236083 [DOI] [PMC free article] [PubMed] [Google Scholar]
- Nekrasov M, Amrichova J, Parker BJ, Soboleva TA, Jack C, Williams R, Huttley GA, Tremethick DJ. 2012. Histone H2A.Z inheritance during the cell cycle and its impact on promoter organization and dynamics. Nat Struct Mol Biol 19: 1076–1083. 10.1038/nsmb.2424 [DOI] [PubMed] [Google Scholar]
- Nora EP, Lajoie BR, Schulz EG, Giorgetti L, Okamoto I, Servant N, Piolot T, van Berkum NL, Meisig J, Sedat J, et al. 2012. Spatial partitioning of the regulatory landscape of the X-inactivation centre. Nature 485: 381–385. 10.1038/nature11049 [DOI] [PMC free article] [PubMed] [Google Scholar]
- Nora EP, Goloborodko A, Valton AL, Gibcus JH, Uebersohn A, Abdennur N, Dekker J, Mirny LA, Bruneau BG. 2017. Targeted degradation of CTCF decouples local insulation of chromosome domains from genomic compartmentalization. Cell 169: 930–944.e22. 10.1016/j.cell.2017.05.004 [DOI] [PMC free article] [PubMed] [Google Scholar]
- Ohta S, Bukowski-Wills JC, Sanchez-Pulido L, Alves Fde L, Wood L, Chen ZA, Platani M, Fischer L, Hudson DF, Ponting CP, et al. 2010. The protein composition of mitotic chromosomes determined using multiclassifier combinatorial proteomics. Cell 142: 810–821. 10.1016/j.cell.2010.07.047 [DOI] [PMC free article] [PubMed] [Google Scholar]
- Oomen ME, Dekker J. 2017. Epigenetic characteristics of the mitotic chromosome in 1D and 3D. Crit Rev Biochem Mol Biol 52: 185–204. 10.1080/10409238.2017.1287160 [DOI] [PMC free article] [PubMed] [Google Scholar]
- Pallier C, Scaffidi P, Chopineau-Proust S, Agresti A, Nordmann P, Bianchi ME, Marechal V. 2003. Association of chromatin proteins high mobility group box (HMGB) 1 and HMGB2 with mitotic chromosomes. Mol Biol Cell 14: 3414–3426. 10.1091/mbc.e02-09-0581 [DOI] [PMC free article] [PubMed] [Google Scholar]
- Raccaud M, Suter DM. 2018. Transcription factor retention on mitotic chromosomes: regulatory mechanisms and impact on cell fate decisions. FEBS Lett 592: 878–887. 10.1002/1873-3468.12828 [DOI] [PubMed] [Google Scholar]
- Raccaud M, Alber AB, Friman ET, Agarwal H, Deluz C, Kuhn T, Gebhardt JCM, Suter DM. 2018. Mitotic chromosome binding predicts transcription factor properties in interphase. bioRxiv 10.1101/404723 [DOI] [PMC free article] [PubMed]
- Rao SS, Huntley MH, Durand NC, Stamenova EK, Bochkov ID, Robinson JT, Sanborn AL, Machol I, Omer AD, Lander ES, et al. 2014. A 3D map of the human genome at kilobase resolution reveals principles of chromatin looping. Cell 159: 1665–1680. 10.1016/j.cell.2014.11.021 [DOI] [PMC free article] [PubMed] [Google Scholar]
- Rizkallah R, Hurt MM. 2009. Regulation of the transcription factor YY1 in mitosis through phosphorylation of its DNA-binding domain. Mol Biol Cell 20: 4766–4776. 10.1091/mbc.e09-04-0264 [DOI] [PMC free article] [PubMed] [Google Scholar]
- Sanborn AL, Rao SS, Huang SC, Durand NC, Huntley MH, Jewett AI, Bochkov ID, Chinnappan D, Cutkosky A, Li J, et al. 2015. Chromatin extrusion explains key features of loop and domain formation in wild-type and engineered genomes. Proc Natl Acad Sci 112: E6456–E6465. 10.1073/pnas.1518552112 [DOI] [PMC free article] [PubMed] [Google Scholar]
- Sekiya T, Murano K, Kato K, Kawaguchi A, Nagata K. 2017. Mitotic phosphorylation of CCCTC-binding factor (CTCF) reduces its DNA binding activity. FEBS Open Bio 7: 397–404. 10.1002/2211-5463.12189 [DOI] [PMC free article] [PubMed] [Google Scholar]
- Skene PJ, Henikoff S. 2017. An efficient targeted nuclease strategy for high-resolution mapping of DNA binding sites. eLife 6: e21856 10.7554/eLife.21856 [DOI] [PMC free article] [PubMed] [Google Scholar]
- Tang Z, Luo OJ, Li X, Zheng M, Zhu JJ, Szalaj P, Trzaskoma P, Magalska A, Wlodarczyk J, Ruszczycki B, et al. 2015. CTCF-mediated human 3D genome architecture reveals chromatin topology for transcription. Cell 163: 1611–1627. 10.1016/j.cell.2015.11.024 [DOI] [PMC free article] [PubMed] [Google Scholar]
- Taylor WR. 2004. FACS-based detection of phosphorylated histone H3 for the quantitation of mitotic cells. In Checkpoint controls and cancer: volume 2: activation and regulation protocols (ed. Schönthal AH), pp. 293–299. Humana Press, Totowa, NJ. [DOI] [PubMed] [Google Scholar]
- Teves SS, An L, Hansen AS, Xie L, Darzacq X, Tjian R. 2016. A dynamic mode of mitotic bookmarking by transcription factors. eLife 5: e22280 10.7554/eLife.22280 [DOI] [PMC free article] [PubMed] [Google Scholar]
- Teves SS, An L, Bhargava-Shah A, Xie L, Darzacq X, Tjian R. 2018. A stable mode of bookmarking by TBP recruits RNA polymerase II to mitotic chromosomes. eLife 7: e35621 10.7554/eLife.35621 [DOI] [PMC free article] [PubMed] [Google Scholar]
- Varier RA, Outchkourov NS, de Graaf P, van Schaik FM, Ensing HJ, Wang F, Higgins JM, Kops GJ, Timmers HT. 2010. A phospho/methyl switch at histone H3 regulates TFIID association with mitotic chromosomes. EMBO J 29: 3967–3978. 10.1038/emboj.2010.261 [DOI] [PMC free article] [PubMed] [Google Scholar]
- Vietri Rudan M, Barrington C, Henderson S, Ernst C, Odom DT, Tanay A, Hadjur S. 2015. Comparative Hi-C reveals that CTCF underlies evolution of chromosomal domain architecture. Cell Rep 10: 1297–1309. 10.1016/j.celrep.2015.02.004 [DOI] [PMC free article] [PubMed] [Google Scholar]
- Waizenegger IC, Hauf S, Meinke A, Peters JM. 2000. Two distinct pathways remove mammalian cohesin from chromosome arms in prophase and from centromeres in anaphase. Cell 103: 399–410. 10.1016/S0092-8674(00)00132-X [DOI] [PubMed] [Google Scholar]
- Wang F, Higgins JM. 2013. Histone modifications and mitosis: countermarks, landmarks, and bookmarks. Trends Cell Biol 23: 175–184. 10.1016/j.tcb.2012.11.005 [DOI] [PubMed] [Google Scholar]
- Xing H, Vanderford NL, Sarge KD. 2008. The TBP–PP2A mitotic complex bookmarks genes by preventing condensin action. Nat Cell Biol 10: 1318–1323. 10.1038/ncb1790 [DOI] [PMC free article] [PubMed] [Google Scholar]
- Zentner GE, Henikoff S. 2012. Surveying the epigenomic landscape, one base at a time. Genome Biol 13: 250 10.1186/gb4051 [DOI] [PMC free article] [PubMed] [Google Scholar]
Associated Data
This section collects any data citations, data availability statements, or supplementary materials included in this article.