

Abstract
Organisms continuously require genetic variation to adapt to fluctuating environments, yet major evolutionary events are episodic, making the relationship between genome evolution and organismal adaptation of considerable interest. Here, by genome-wide comparison of sorghum, maize, and rice SNPs, we investigated reservoirs of genetic variations with high precision. For sorghum and rice, which have not experienced whole-genome duplication in 96 million years or more, tandem duplicates accumulate relatively more SNPs than paralogous genes retained from genome duplication. However, maize, which experienced lineage-specific genome duplication and has a relatively larger supply of paralogous duplicates, shows SNP enrichment in paralogous genes. The proportion of genes showing signatures of recent positive selection is higher in small-scale (tandem and transposed) than genome-scale duplicates in sorghum, but the opposite is true in maize. A large proportion of recent duplications in rice are species-specific; however, most recent duplications in sorghum are derived from ancestral gene families. A new retrotransposon family was also a source of many recent sorghum duplications, illustrating a role in providing variation for genetic innovations. This study shows that diverse evolutionary mechanisms provide the raw genetic material for adaptation in taxa with divergent histories of genome evolution.
Evolutionary innovation is often built on variations from redundant genetic materials generated by one of several forms of gene duplication (Taylor and Raes 2004). In plants, whole-genome duplication (WGD) is thought to be a major force driving biological complexity, evolutionary novelty, and adaptation to specific conditions (Van de Peer et al. 2009). For example, WGD events may have contributed genes important to seed and flower development (Jiao et al. 2011). Syntenic alignments of fully sequenced genomes revealed biased gene retention/loss associated with morphological complexity (Freeling and Thomas 2006). Two consecutive genome triplications in the Solanum lineage might have spawned new functions of genes controlling fruit color and fleshiness (The Tomato Genome Consortium 2012). A fivefold ploidy increase in the cotton lineage ∼60 million years ago may have contributed to the evolution of spinnable fibers (Paterson et al. 2012). A recent genome triplication may contribute to the remarkable morphological plasticity of Brassica species (Wang et al. 2011).
What are the raw materials for evolutionary innovation in lineages that abstain from whole-genome duplication for long time periods? For example, the eudicots Vitis, Carica (papaya), and Theobroma (cacao) experienced hexaploidization ∼110 million years ago (mya) with no further WGD thereafter (Jaillon et al. 2007). Three ancient WGDs shaped the ancestral lineage of grasses (Jiao et al. 2014); however, Oryza sativa (rice) and Sorghum bicolor (sorghum) experienced no subsequent polyploidization (Paterson et al. 2004, 2009; Schnable et al. 2009; Tang et al. 2010). Do the few remaining 96-my-old paleologs (ohnologs) in rice and sorghum still experience mutations that contribute to evolutionary novelty (Wang et al. 2015)? If not, what has been the raw material for adaptation in these taxa since their last genome duplication?
Recent SNP discoveries unveiled DNA markers linked to loci under recent selection, for example affecting plant height, inflorescence architecture, or flowering time (Morris et al. 2013; Thurber et al. 2013), major agronomic traits (Huang et al. 2010; Xu et al. 2012) and domestication of rice (Huang et al. 2012), and major morphological changes during domestication of maize (Chia et al. 2012; Hufford et al. 2012). In this study, we aim to clarify the sources of raw materials responsible for genetic changes by comparative analyses of taxa with divergent histories of genome evolution.
Results
SNP data from Sorghum, Oryza, and Zea
We identified 10,482,224 SNPs from whole genome resequencing of 26 sorghum (S. bicolor) accessions with ∼20× read coverage and RNA-seq of 40 accessions including three Asian accessions (Zheng et al. 2011) that broadly sample genetic divergence, including 61 domesticated accessions from five distinct races, five wild accessions, and three outgroups (S. propinquum, S. timorense, S. versicolor). Published SNPs representing diverse maize and rice genotypes were also investigated (Table 1).
Table 1.
List of high-density SNP data sets available in sorghum, maize, and rice

Genetic variations at the population level
We investigated SNP levels in genes resulting from three different types of duplications: WGD (syntenic); tandem duplication; and transposed genes (see Methods for classification details). To minimize the effect of genome size variation (especially intron length), we calculated SNP density as the number of SNP sites on coding regions/length of coding sequences of the gene. High SNP density, especially of nonsynonymous coding SNPs (nsSNP), indicates possible changes of gene function. Enrichment for genes with high nsSNP density may suggest a major contribution of a gene duplication category to genetic variation. We first ordered all genes based on nsSNP density from lowest to highest, then compared the three duplication types in sliding windows of 1000 genes (Fig. 1). Across all three grasses, lineage-specific genes stand out as having high density of nsSNPs. However, their generally short lives (Bost et al. 2001) and enrichment for pseudogenes and transposons (Wicker et al. 2011) may constrain their contributions to genetic innovations.
Figure 1.

Number of duplicated gene types in different nsSNP density categories. All genes in (A) sorghum, (B) rice, and (C) maize are ordered by nsSNP density, ranked in 1000-gene intervals from low to high nsSNP density as shown in the x-axis.
A striking difference between the two paleo-duplicated genomes (sorghum, rice) and the more recently duplicated maize genome is the contrast between tandem and syntenic genes. In sorghum and rice, increasing nsSNP density is associated with increasing numbers of tandem genes but declining numbers of syntenic genes (Pearson correlation coefficient, r = −0.82 for sorghum, r = −0.88 for rice) (Fig. 1A,B). In maize, increasing nsSNP density is associated with a relatively constant number of tandem genes, but a declining number of syntenic genes (r = −0.015, Pearson correlation coefficient) (Fig. 1C). The results suggest that genome-wide duplicated genes in maize are still the main source of diversity, while small-scale (tandem and transposed) duplicates are the main repositories of genetic variation in sorghum and rice.
The high density of nsSNPs in sorghum and rice tandem genes is not due simply to older duplication time. If nsSNPs accumulate linearly following evolutionary time, there should be a correlation between synonymous divergence (Ks) and nsSNP density. However, no significant correlation was observed (Supplemental Fig. S1).
In partial summary, tandem duplicated genes contribute substantially to recent genetic innovation in sorghum and rice, partly compensating for the absence of recent whole-genome duplication. Further evidence of this phenomenon derives from the finding that more common gene families experienced independent but convergent tandem duplication between sorghum and rice than between sorghum and maize, although sorghum-rice divergence is ∼3× more ancient (Supplemental Fig. S2A; Wang et al. 2015). The abundance (Supplemental Fig. S2A), small sequence divergence between the majority of existing tandem gene pairs (Supplemental Fig. S2B), and enrichment for nsSNPs in sorghum and rice reinforce our finding that tandem and transposed genes are a major repository for genetic variation in taxa that have not experienced genome duplication in a long time.
Evolution of tandem duplications in sorghum population
Tandem duplications continue to be generated in the sorghum gene pool, providing opportunities for new diversity to arise. Using a parsimony-based approach and S. timorense as an outgroup, we identified a total of 311 gains of tandem duplicated gene copies in the S. bicolor gene pool since its divergence from S. propinquum an estimated 1–2 mya (Feltus et al. 2006). The copy number of each tandem gene in each draft genome sequence is estimated by deviation of read coverage of the gene from the genome-wide average. In this case, we only consider genes that gained tandem copies relative to the reference genome. Pairwise comparison of 26 sorghum lines with whole genome sequences reveals that an average of 12.16 lineage-specific tandem duplication events occurred since divergence of each of these from any other sorghum genotype in our study group. Using synonymous SNPs to produce a neutral phylogenetic tree (Supplemental Fig. S3), the birth rate of tandem duplications can be deduced from the numbers of synonymous SNP and tandem duplications on each branch (Supplemental Fig. S4). Most nsSNPs in tandem genes occurred in branches of the tree predating sorghum domestication (marked in red, Supplemental Fig. S5), indicating that domestication acted primarily on standing genetic variation rather than new mutations.
Compared to the overall gene distribution in the sorghum genome, tandem genes are significantly more likely to be in euchromatin (P < 0.0001, Fisher's exact test). Tandem genes containing large number of nsSNPs are enriched, albeit nominally (P = 0.0765, Fisher's exact test), in the euchromatin compared to the overall tandem gene distribution in the sorghum genome (Supplemental Fig. S6). This suggests that the high nsSNP density of tandem genes is unlikely to be caused by processed pseudogenes, which are highly enriched in plant heterochromatin. To verify this, we compared the nsSNP density of genes located in the euchromatin and heterochromatin (Supplemental Fig. S7). Genes in the heterochromatin have significantly higher nsSNP density than genes in euchromatin (P = 9.22 × 10⁻⁵, t-test). This implies that the high nsSNP density of tandem genes is not from processed pseudogene remnants in heterochromatin experiencing little selection pressure.
Genes with large-impact SNPs
A nsSNP can have a large impact on, or even destroy, gene function, providing new alleles for adaptation (Baxter et al. 2010). We investigated five types of large impact SNPs (minor allele frequency > 0.05 used to minimize rare mutations and SNP calling errors), i.e., that affect: (1) translation initiation sites, (2) alternative splicing motifs (GT-AG), (3) premature stop codons, (4) stop codon loss, or (5) inferred gene function (see Methods and Fig. 2). In total, we found 28,457 large impact SNPs in 13,090 sorghum genes, including 13,928 (48.9%) premature stop codons, 9324 (32.8%) translation extensions, 4819 (16.9%) alternative-splicing sites, and 386 (1.4%) changes of translation initiation site. In maize, 17,615 large impact SNPs in 11,170 genes included 11,334 (64.3%) premature stop codons, 1656 (9.4%) translation extensions, 3209 (18.2%) alternative-splicing sites, and 1416 (8.0%) changes of translation initiation site. In rice, 16,783 large impact SNPs in 9932 genes included 10,009 (59.6%) premature stop codons, 4550 (27.1%) translation extensions, 1791 (10.7%) alternative-splicing sites, and 433 (2.6%) changes of translation initiation site. We also identified 676, 1351, and 1087 nsSNPs inferred to have large effects on gene function in sorghum, maize, and rice, respectively (FDR < 0.01). There are significantly larger numbers of SNPs that alter translation initiation sites in maize (Fig. 2).
Figure 2.

Genes containing large impact SNPs. Distribution of five large impact SNP categories in sorghum, maize, and rice. (***) P < 0.01 for enrichment relative to the other two species.
Genes showing signatures of selection
Evidence of nonneutral evolution, i.e., genes with signatures of either positive (diversifying) or balancing selection, is more abundant in tandem duplicated than syntenic sorghum genes. Supplemental Table S1 shows the number of genes in each duplication type with significant Tajima's D values using coalescent simulation of neutral evolution (see Methods). In sorghum, 43 (1.23% of) tandem genes show significantly excessive low frequency alleles compared to 47 (0.87% of) syntenic genes (percentages differing at P = 0.0001, Fisher's exact test). Nearly half of the selected tandem genes (20) are in the 1000 genes with the highest nsSNP rate.
To assess the relative contribution of each duplication type to the reservoir of genetic diversity available for selection, we ranked duplicated gene types according to the proportion that show significant Tajima's D values in sorghum and maize (Supplemental Fig. S8). In sorghum, the proportion of tandem duplicated genes showing recent positive selection, 1.23%, is larger than for other types of duplications, especially syntenic genes (Supplemental Table S1; Supplemental Fig. S8). Nevertheless, there is no significant difference in the proportions of tandem and syntenic genes showing recent positive selection in maize—indeed, “transposed” duplications contributed the most to maize genetic diversity.
Comparative evolution of syntenic gene pairs
To further investigate the notion that syntenic duplicated gene pairs offer the opportunity for functional diversification of one member (Blanc and Wolfe 2004; Chapman et al. 2006; Guo et al. 2013), we used Tajima's D to discern whether both genes show signatures of (1) recent positive selection, or (2) balancing selection, and (3) to quantify divergence of SNP frequency (for syntenic pairs under different selection pressure, the difference of Tajima's D for the respective genes is larger than 3 [Fig. 3]). Figure 3, A–C, shows the genomic distribution of syntenic gene pairs with divergent SNP frequency patterns (connected by red lines) and Tajima's D of genomic regions (blue lines). In sorghum, maize, and rice, the majority of syntenic gene pairs show significant differences in Tajima's D (Fig. 3D), suggesting divergence of functionality which is consistent with many previous observations, including our own (Guo et al. 2013). Cases in which both members of a syntenic pair are under positive selection are extremely rare; however, there are cases in which both members are under balancing selection in sorghum (2), maize (28), and rice (70).
Figure 3.

Genetic diversity of syntenic gene pairs. Syntenic genes pairs that show different genetic diversity (difference of Tajima's D > 3) are connected by red lines. Blue lines show genomic distribution of Tajima's D across each chromosome. A sliding window method is used with window size of 1 Mb and step size of 100 kb. The short lines outside each circle mark the genomic position of the following types of genes (from inside to outside): tandemly duplicated (cyan); transposed duplications (orange); species-specific duplications (magenta); and singleton (green). (A) Sorghum; (B) maize; (C) rice. (D) Number of syntenic gene pairs with different selection patterns. “Positive”: both syntenic genes showing recent positive selection indicated by significant negative Tajima's D. “Balancing”: both syntenic genes showing balancing selection indicated by significant positive Tajima's D. “Divergence”: syntenic gene pairs showing different selection patterns as indicated by the red lines in the circle plot.
Gene family expansions
Regardless of duplication type, ongoing gene family expansions provide raw material for adaptation to fluctuating environments. We found 667 and 1119 unique genes in sorghum and rice, respectively, from 244 and 442 orthologous gene families (see Methods), that have at least one paralog with Ks < 0.05, suggesting recent duplication (Fig. 4A). To further examine gene family size, we sampled 18 species across the angiosperm phylogeny and constructed orthologous groups using OrthoMCL (Li et al. 2003). The expansion and contraction of gene families were calculated for each branch using the CAFE algorithm (Fig. 4B). A total of 1025 orthologous groups are expanded in the sorghum lineage versus 768 in the rice lineage since their divergence ∼50 mya. A remarkable 3862 orthologous groups were expanded in the maize lineage versus 770 in sorghum since their divergence ∼10 mya, partly reflecting maize-specific genome duplication. Rice has 3838 gene families reduced in size compared to 270 in maize and 115 in sorghum. Indeed, 3762 of these gene families, inferred to be in the common ancestor of rice, wheat, and Brachypodium distachyon, are now completely absent in rice. Transcription factors are significantly enriched in these gene families (P = 1 × 10⁻¹⁴, Fisher's exact test). Thus, since the divergence of sorghum/maize and rice, rice has experienced more recent (Ks < 0.5) gene duplications, whereas gene duplications in sorghum are comparatively more ancient.
Figure 4.

Evolution of plant gene family size. (A) Histogram of Ks values of all paralogous gene pairs identified by BLASTP with P-value < 1 × 10⁻¹⁰ and alignment accounting for >80% of gene length (removing partially aligned pairs). (B) Expansion and contraction of gene families in major flowering plant lineages using the CAFE algorithm (De Bie et al. 2006). The number of expansions is marked as red and contractions as blue.
Recent expansion of a novel LTR retrotransposon family in sorghum
The 667 and 1119 unique genes from recent duplication (Ks < 0.05) in sorghum and rice group into 363 gene families in sorghum and 451 in rice by single linkage clustering (Everitt et al. 2011). One cluster contains 71 annotated genes that are unique to sorghum, with less stringent matches to a total of 212 homologs, including 147 (69.3%) located ∼100 bp downstream from gag genes in a ∼10,000-bp LTR retrotransposon. This LTR retrotransposon family is likely nonautonomous, since it lacks pol and env genes. Different parts of these sorghum retrotransposons (5′ LTR, 3′ LTR, gag, the hypothetical gene, and 1000 bp up- and downstream) have similar average nucleotide diversity (0.007), which strongly suggests their simultaneous and recent expansion (Fig. 5A). A BLAST search of the LTR retrotransposon sequence reveals one partial hit (141 bp) to serine threonine-protein kinase TOR, which resides in a LTR Gypsy retrotransposon in the sugarcane hybrid cultivar R570 (Vilela et al. 2017). The TOR domain locates ∼700 bp downstream from an annotated gene (Sb10G13800). However, a BLAST search of Sb10G13800 yielded no hits. Using I-TASSER (Yang and Zhang 2015), we predicted the protein structure of Sb10G13800 (Supplemental Fig. S9), and a functional search based on this structure suggested a deaminase.
Figure 5.
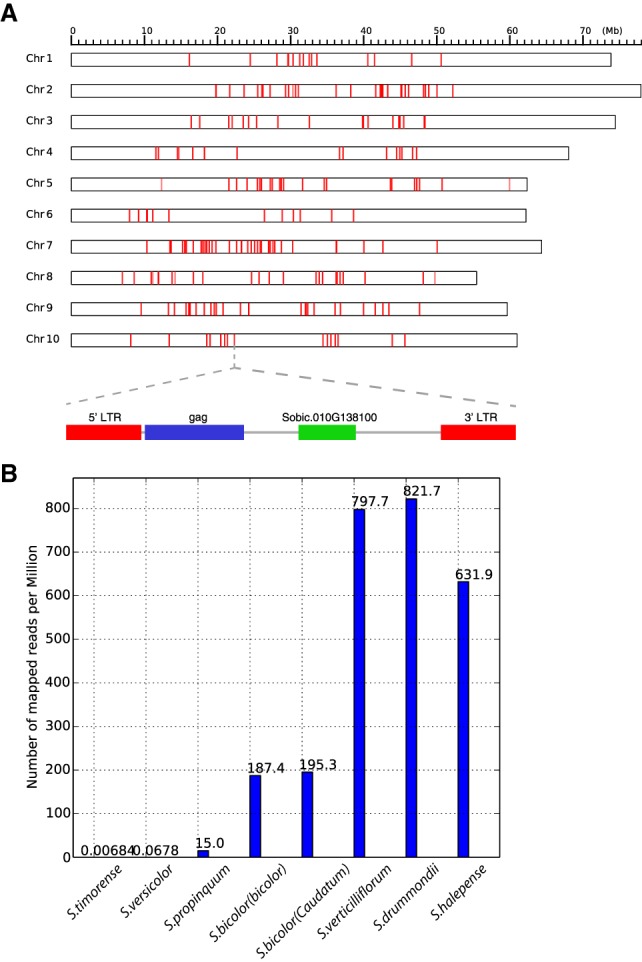
A recently amplified sorghum retrotransposon. (A) Genomic distribution and structure. (B) Copy number variation in sorghum and outgroup species, estimated by the number of mapped reads normalized to the total number of reads for each genome (per million reads).
We mapped all genomic reads from three outgroup species and two wild and two domestic S. bicolor genotypes to the 71 annotated genes unique to sorghum. The outgroups show only nominal evidence of the element family (Fig. 5B), while copy numbers in the two wild S. bicolor genotypes are ∼4× higher than in domesticated genotypes. A hybrid tetraploid species, S. halepense (S. bicolor × S. propinquum), shows intermediate copy numbers, suggesting that amplification of the retrotransposon family in Sorghum bicolor was during the last 1–2 million years after divergence from a common ancestor shared with (outgroup) S. propinquum but prior to S. halepense formation.
Both semiquantitative (Fig. 6A) and real time PCR (Fig. 6B) show that a gene (Sb10G13800) carried by the retrotransposon is expressed in all sampled species/genotypes except S. propinquum, a wild Asian species that occurs in streamsides and moist places and lacks the drought resistance characteristic of other sorghum species. Genes flanking the retrotransposon are significantly enriched for protein binding (P = 0.016), transporter activity (P = 0.036), and receptor binding (P = 0.017) functions. This raises an intriguing hypothesis that the retroelement family is somehow related to drought resistance, perhaps influencing expression of these genes.
Figure 6.

Expression of a gene (Sb010G13800) located in the retrotransposon from seven sorghum accessions. (A) Semiquantitative RT-PCR. (B) Quantitative real-time PCR (qRT-PCR).
Discussion
Many lines of evidence show that small-scale duplications provide a rich reservoir of raw material for genetic innovation and may compensate for a sustained absence of WGD in some lineages. An explanation could be that large effect variations in syntenic genes have been purged by selection over the last ∼26 million years in maize and ∼90 million years in sorghum and rice, while small-scale duplications that generally have short half-lives only persist if large effect variations confer upon them a selective advantage.
Syntenic genes are relatively conservative and less likely than small-scale duplications to contain large impact SNPs in sorghum and maize. Genes containing few large impact SNPs may be under relatively strong purifying selection. In rice, enrichment of specific gene families and loss of large numbers of ancestral gene families with regulatory functions (Fig. 4B) strongly argues that the generation and retention of lineage-specific genes might play an important role in adaptation to new environments. On the contrary, maintaining and tinkering with ancestral gene families is ongoing in the sorghum-maize lineage. A greater need for adaptation of rice may perhaps be reflected by its widespread natural distribution—the 22 wild Oryza species and two domesticated species are distributed in diverse environments across the globe (Brar and Singh 2011), while all five species in the Zea genus (Z. mays, Z. diploperennis, Z. perennis, Z. luxurians, Z. nicaraguensis) are distributed across narrow ranges in central America. In maize, a significantly larger proportion of transposed genes than syntenic genes show molecular signatures of nonneutral evolution (Fig. 3). In fact, most syntenic maize genes have low nucleotide diversity. Transposons continue to reshuffle redundant genetic materials produced by WGD within the genome long after the WGD event (∼26 mya in maize) and may arguably be “the tinkerer” in plant genome evolution.
Using Sorghum version 2.1 gene annotation, we identified a new retrotransposon family that recently expanded in S. bicolor. While S. versicolor has very few copies of this element, its expression in S. versicolor is virtually the same as in S. bicolor and far higher than in S. propinquum. Few S. versicolor reads (5764 of 1,076,401,148) could be mapped to the S. bicolor reference genome at the stringency applied to S. bicolor reads. At relaxed stringency, we found 47,070 S. versicolor reads, compared to 14,404 reads (of 715,456,664) aligned from S. propinquum. The retrotransposon appears to have dramatically increased in copy number in wild S. bicolor, with either a moderate decline in cultivated S. bicolor or a continuing increase in wild S. bicolor that was not paralleled in domesticated strains. It is at least interesting, and perhaps significant, that the expression profile of the element, being high in S. versicolor and wild S. bicolor but lower in domesticated S. bicolor and S. propinquum, is correlated with generally lower drought resistance. The relationship between drought resistance and the new retrotransposon family in sorghum warrants further investigation.
While we aimed to analyze data sets comparable among the three species, i.e., with similar sequencing depth, SNP calling methods, and composition in terms of the number of domesticated lines, landraces, and wild relatives, we must note that the structure of the three data sets could confound comparison of the number of SNPs or SNP densities. The differences among the three species presented in this study are based on internal comparisons, i.e., that, in sorghum, tandem genes tend to have more nsSNP than syntenic duplicated genes, while maize shows an opposite trend. By focusing on such internal comparisons, differences such as population composition and sequencing depth between taxa should be mitigated.
Methods
Classification of gene duplications
To investigate variation of SNP levels among specific genes, we classified Oryza, Sorghum, and Zea genes as syntenic, tandemly duplicated, transposed, lineage-specific, or single-copy. The initial sorghum reference genome sequence and gene annotations (v1.4) were used. Reference genome sequences and gene annotations of maize and rice were downloaded from Phytozome v9 (http://www.phytozome.net). Syntenic, transposed, and tandem genes were identified using MCScanX-transposed (Wang et al. 2013). Single-copy and lineage-specific genes were retrieved from the 18 genome OrthoMCL clusters. Single-copy genes are defined as genes that are conserved in all studied genomes and with a one-to-one orthology relationship in these genomes. Due to the intrinsic stringency of the OrthoMCL clustering method, we relaxed the criteria and defined single-copy genes as genes in the orthogroups with genes in at least 10 of the 18 studied genomes. Genome-specific genes are defined as genes in the orthogroups that include genes only in one genome, plus genes that are not classified into any orthogroups (no homologous genes identified).
Classification of gene families
We selected 18 taxa to represent the major land plant lineages for which genome sequence data are available, including five rosids (Arabidopsis thaliana, Gossypium raimondii, Populus trichocarpa, Glycine max, Vitis vinifera), two asterids (Solanum lycopersicum, Utricularia gibba), one basal eudicot (Nelumbo nucifera), seven monocots (Oryza sativa, Brachypodium distachyon, Triticum urartu, Sorghum bicolor, Zea mays, Setaria italica, Musa acuminata), one gymnosperm (Picea abies), one lycophyte (Selaginella moellendorffii), and one moss (Physcomitrella patens). All-against-all BLASTP was used to pair homologous genes with criteria of E-value <1 × 10⁻¹⁰. OrthoMCL was used to construct a complete set of protein coding genes in orthogroups based on protein similarity graphs. The expansion and contraction of gene families in the phylogenetic lineages are estimated using the CAFE algorithm (Hahn et al. 2005). The procedure determining the number of gene families with tandem duplications iterates through each gene family cluster and checks the duplication type of each member. If one member is a tandem-duplicated gene, the gene family is classified as including tandem duplication.
Materials and sequencing
Sorghum genotypes in Supplemental Table S3 were sequenced using standard methods implemented at the US Department of Energy Joint Genome Institute, as indicated using either genomic DNA or RNA from pooled above-ground plant parts (leaves, stems, inflorescence).
SNP detection
From each accession, 76-bp paired-end reads were aligned to the Sorghum bicolor reference genome using BWA version 0.5.9 (Li and Durbin 2009). Multiple-sample SNP calling was performed using the mpileup program in the SAMtools package and bcftools (Li et al. 2009). Reads with mapping quality score ≥25 and base quality ≥20 were used for SNP calling. Raw SNPs were further filtered according to read depth distribution to avoid paralog contamination and low coverage regions. Each accession's genotype is calculated by maximum likelihood estimation using reads with 4–30× coverage.
Tandem genes are often recently derived and share high sequence similarity (Supplemental Fig. S4B), complicating short read alignment and introducing “false SNPs” from paralogs. To address this, the coverage of genomic reads (not including transcriptome data) is examined for every tandem gene in the sorghum genome. The average coverage of the whole genome is about 553×. There are 31 tandem genes with more than twice the genome coverage (1100×), of which seven have coverage more than 2500× (ranging up to 7500×). A total of 14 of the 31 high coverage tandems have SNPs called and were removed from further analysis. The same filter was applied to the maize and rice SNP data, inferring the average coverage of a tandem gene from the read coverage of SNP sites.
Identification of large-impact SNPs
A customized script was used to map SNPs to the Sorghum bicolor gene model version 1.4 (Supplemental Code). Large impact SNPs are identified as those mapped to coding regions, splicing sites, stop codons, and transcription initiation sites. The functional impact of nonsynonymous SNPs is assessed based on the evolutionary conservation profile of amino acids. Orthologous groups of protein sequences from 30 plant species are constructed using OrthoMCL. Protein sequences from each orthologous group are aligned using Clustal W 2.0 (Larkin et al. 2007). nsSNPs are mapped to the alignment of the corresponding orthologous group and a “functional impact score” is calculated with a modified entropy function (Reva et al. 2011):
where α, β are 20-amino acid residues and gaps, ni(α) is the number of occurrences of residue α in an alignment column i. ni(β) is the number of occurrences of an alternative residue β in the column i. Pc is the probability of occurrence of the most common residue in the alignment column i. Si is the function index score, a measure of functional impact of a mutation on protein function. The significance threshold of Si is determined at the FDR = 0.01.
Population genetic analysis
Population parameters and neutral test statistics are calculated using libsequence C++ library v1.7.4 (Thornton 2003). To determine the significance threshold, coalescence simulations of populations under neutral evolution are performed using the ms program (Hudson 2002). Population size and number of segregating sites used in simulation are the same as the empirical data used in this study. The process was repeated 10,000 times for sorghum, maize, and rice, respectively. The significance threshold of Tajima's D is determined at the FDR = 0.01. To calculate Tajima's D across a genomic region, a sliding window method was used to analyze each chromosome of sorghum, maize, and rice separately, with a window size of 1 Mb and step size of 100 kb.
Homologous gene clusters were constructed using BLASTP with E-value cutoff of 1 × 10⁻³. Pair-wise protein alignments were generated using Clustal W 2.0 with default settings. For each aligned peptide pair, an alignment score was calculated by dividing the number of aligned amino acids with the length of the shorter peptide sequence. The protein pairs with alignment score less than 0.8 were excluded for later analyses. The protein alignments were used to guide nucleotide sequence alignments. Synonymous/nonsynonymous divergence rates were then calculated using PAML package with the Nei-Gojobori model (Yang 1997).
Construction of phylogenetic trees
The CDS of a gene from small gene families having less than six copies and having no tandem copies was used to search the genome sequence of each involved lineage, and the best BLAST hit region at stringent criteria was retrieved (E-value <1 × 10⁻¹⁰). The retrieved orthologous regions of a gene in all lineages were aligned using Clustal W 2.0, and the alignments of all genes were used to construct a concatenated alignment. At the mapping depth of at least 65 (i.e., ≥65 lineages have a nucleotide at a specific site in the alignment), 1721 genes contributed to produce the alignment of 306,267 bp. The concatenated alignment was used to construct phylogenetic trees using PhyML v3.0 (Guindon et al. 2010).
Tracing the origin of nsSNPs in tandem genes
For each nsSNP in tandem genes and given the sorghum phylogenetic tree, we map changes to branches in a way that minimizes the overall number of changes in the tree. We used Fitch's algorithm to deduce the nucleotide for ancient branches and calculate a parsimony score. Deduction of the nucleotide of each node includes the forward and backward passes. In the forward pass, for each internal node v with children u, w is assigned one or more nucleotides using the following formula:
where S(v) is the nucleotide of a node, and S(u) and S(w) are the nucleotides of the two children of node v. z is the parsimonious number of changes on the tree.
The backward pass starts at the root r. Each child w is assigned one nucleotide following the formula:
In the backward pass, a random nucleotide is chosen if there are more than two nucleotides in the node. Then, the change is placed in the branch where the nucleotide of the parental node differs from the child node.
Estimation of tandem duplication rate in sorghum
We only consider genes that gained tandem copies relative to the reference genome. The copy number of each tandem gene is inferred by the number of times read coverage exceeds the genome-wide average. The number of tandem duplications occurring between two genotypes is defined as the one-dimensional Euclidean distance of the number of tandem duplications of all tandem genes.
The number of tandem duplications (T) and synonymous SNPs (S) occurring on the phylogenetic tree are determined by a maximum parsimony method. Using S. propinquum as an outgroup, the number of synonymous SNPs between S. propinquum and each of the S. bicolor genotypes is calculated by adding up the number of tandem duplications in the path leading to the genotype. The divergence time between S. propinquum and S. bicolor is estimated at 1.5 million years (Feltus et al. 2006). For a given S. bicolor genotype, the time required for a synonymous SNP to occur in the genotype can be estimated by the number of synonymous SNPs differentiating the genotype and S. propinquum and the divergence time between the two (1.5 my). The average time required for a synonymous substitution to occur in the study as a whole population is estimated at 134 years (the mean for all studied S. bicolor genotypes with genomes resequenced). For each branch, S × 134 is the time span of the branch in years assuming a molecular clock. S × 134/T would be the time for generating one tandem duplication in the sorghum population. We can estimate the rate of tandem duplication (Y) on each branch by Y = S × 134/T. Two genotypes (SAP-80, S. versicolor) were excluded from this analysis due to low read coverage and large deviation from the mean.
Retrotransposon expression analysis
Plant materials were grown in the greenhouse during the fall of 2015. Leaf samples for each individual at the third-leaf stage were frozen in liquid nitrogen and stored at −80°C. Total RNA was extracted using PureLink Plant RNA Reagent (Ambion) according to the manufacturer's protocol. RNA was treated with the RNase-Free DNase Set (QIAGEN) to digest residual genomic DNA and quantified using a NanoDrop spectrophotometer. RNA quality was verified on a 1% agarose gel prepared in RNase-free 1 × TAE buffer (Tris base, acetic acid, and EDTA). First-strand cDNA was synthesized from 1 µg of total RNA using SuperScript III reverse transcriptase (Invitrogen) with 500 ng anchored oligo (dT) primers in two 20-µL reactions, incubated 5 min at 65°C and 1 h at 50°C and inactivated 5 min at 85°C. After cDNA synthesis, 20 µL double-sterile water was added to the reaction. Each PCR consisted of 1 µL cDNA in a 20-µL reaction with 4 µL 5 × GoTaq green reaction buffer, 2 µL 2 mM dNTP mix, 0.5 µL each primer (10 µM), and 0.5 U of GoTaq DNA polymerase (Promega). The thermal profile consisted of incubation at 95°C for 4 min, followed by different cycles (26, 29, and 32) at 95°C for 45 sec, 58°C for 45 sec, 72°C for 45 sec, and a final extension at 72°C for 10 min. A sorghum actin gene (SbActin, GenBank accession no. U60495) was used as an internal control. Primer sequences used in quantitative reverse transcription polymerase chain reaction (RT-PCR) are listed in Supplemental Table S2.
qRT-PCR was carried out using an Applied Biosystems 7500 Fast Real-time PCR System and Fast SYBR Green Master Mix (Life Technologies). Gene-specific primers were RT-3F and RT-3R. SbActin was used as an internal control. At least three replicate assays were performed with independently isolated RNA for all experiments. Each RT reaction was loaded in triplicate for qRT-PCR analysis. qRT-PCR data were analyzed using the PCR analysis program 7500 software v2.0.6 (Life Technologies).
Function enrichment test
Arabidopsis GO-slim gene annotation is used for function enrichment analysis. GO-slim terms are assigned to sorghum genes based on sequence similarity inferred from best BLASTP hits. The binomial distribution based on the proportion of a GO-slim term among all annotated genes in the sorghum genome is used as the null distribution. The significance threshold is defined as P < 0.01, unless specified otherwise.
Data access
All sequence data generated in this study have been submitted to the NCBI Sequence Read Archive (SRA; https://www.ncbi.nlm.nih.gov/sra) under accession numbers listed in Supplemental Table S3. Scripts for the analysis in this study are available as Supplemental Code.
Supplementary Material
Acknowledgments
The sequencing conducted by the U.S. Department of Energy Joint Genome Institute is supported by the Office of Science of the U.S. Department of Energy under Contract No. DE-AC02-05CH11231. We thank D. Rokhsar, U.S. Department of Energy Joint Genome Institute, for helpful discussions.
Footnotes
[Supplemental material is available for this article.]
Article published online before print. Article, supplemental material, and publication date are at http://www.genome.org/cgi/doi/10.1101/gr.237511.118.
References
- Baxter L, Tripathy S, Ishaque N, Boot N, Cabral A, Kemen E, Thines M, Ah-Fong A, Anderson R, Badejoko W, et al. 2010. Signatures of adaptation to obligate biotrophy in the Hyaloperonospora arabidopsidis genome. Science 330: 1549–1551. 10.1126/science.1195203 [DOI] [PMC free article] [PubMed] [Google Scholar]
- Blanc G, Wolfe KH. 2004. Functional divergence of duplicated genes formed by polyploidy during Arabidopsis evolution. Plant Cell 16: 1679–1691. 10.1105/tpc.021410 [DOI] [PMC free article] [PubMed] [Google Scholar]
- Bost B, de Vienne D, Hospital F, Moreau L, Dillmann C. 2001. Genetic and nongenetic bases for the L-shaped distribution of quantitative trait loci effects. Genetics 157: 1773–1787. [DOI] [PMC free article] [PubMed] [Google Scholar]
- Brar DS, Singh K. 2011. Oryza. In Wild crop relatives: genomic and breeding resources: cereals (ed. Kole C), pp. 321–367. Springer, Heidelberg, Germany. [Google Scholar]
- Chapman BA, Bowers JE, Feltus FA, Paterson AH. 2006. Buffering of crucial functions by paleologous duplicated genes may contribute cyclicality to angiosperm genome duplication. Proc Natl Acad Sci 103: 2730–2735. 10.1073/pnas.0507782103 [DOI] [PMC free article] [PubMed] [Google Scholar]
- Chia JM, Song C, Bradbury PJ, Costich D, de Leon N, Doebley J, Elshire RJ, Gaut B, Geller L, Glaubitz JC, et al. 2012. Maize HapMap2 identifies extant variation from a genome in flux. Nat Genet 44: 803–807. 10.1038/ng.2313 [DOI] [PubMed] [Google Scholar]
- De Bie T, Cristianini N, Demuth JP, Hahn MW. 2006. CAFE: a computational tool for the study of gene family evolution. Bioinformatics 22: 1269–1271. 10.1093/bioinformatics/btl097 [DOI] [PubMed] [Google Scholar]
- Everitt BS, Landau S, Leese M, Stahl D. 2011. Hierarchical clustering. In Cluster analysis (ed. Balding DJ, et al. ), 5th ed, pp. 71–110. Wiley, West Sussex, UK. [Google Scholar]
- Feltus FA, Hart GE, Schertz KF, Casa AM, Kresovich S, Abraham S, Klein PE, Brown PJ, Paterson AH. 2006. Alignment of genetic maps and QTLs between inter- and intra-specific sorghum populations. Theor Appl Genet 112: 1295–1305. 10.1007/s00122-006-0232-3 [DOI] [PubMed] [Google Scholar]
- Freeling M, Thomas BC. 2006. Gene-balanced duplications, like tetraploidy, provide predictable drive to increase morphological complexity. Genome Res 16: 805–814. 10.1101/gr.3681406 [DOI] [PubMed] [Google Scholar]
- Guindon S, Dufayard JF, Lefort V, Anisimova M, Hordijk W, Gascuel O. 2010. New algorithms and methods to estimate maximum-likelihood phylogenies: assessing the performance of PhyML 3.0. Syst Biol 59: 307–321. 10.1093/sysbio/syq010 [DOI] [PubMed] [Google Scholar]
- Guo H, Lee TH, Wang X, Paterson AH. 2013. Function relaxation followed by diversifying selection after whole-genome duplication in flowering plants. Plant Physiol 162: 769–778. 10.1104/pp.112.213447 [DOI] [PMC free article] [PubMed] [Google Scholar]
- Hahn MW, De Bie T, Stajich JE, Nguyen C, Cristianini N. 2005. Estimating the tempo and mode of gene family evolution from comparative genomic data. Genome Res 15: 1153–1160. 10.1101/gr.3567505 [DOI] [PMC free article] [PubMed] [Google Scholar]
- Huang X, Wei X, Sang T, Zhao Q, Feng Q, Zhao Y, Li C, Zhu C, Lu T, Zhang Z, et al. 2010. Genome-wide association studies of 14 agronomic traits in rice landraces. Nat Genet 42: 961–967. 10.1038/ng.695 [DOI] [PubMed] [Google Scholar]
- Huang X, Kurata N, Wei X, Wang ZX, Wang A, Zhao Q, Zhao Y, Liu K, Lu H, Li W, et al. 2012. A map of rice genome variation reveals the origin of cultivated rice. Nature 490: 497–501. 10.1038/nature11532 [DOI] [PMC free article] [PubMed] [Google Scholar]
- Hudson RR. 2002. Generating samples under a Wright-Fisher neutral model of genetic variation. Bioinformatics 18: 337–338. 10.1093/bioinformatics/18.2.337 [DOI] [PubMed] [Google Scholar]
- Hufford MB, Xu X, van Heerwaarden J, Pyhäjärvi T, Chia JM, Cartwright RA, Elshire RJ, Glaubitz JC, Guill KE, Kaeppler SM, et al. 2012. Comparative population genomics of maize domestication and improvement. Nat Genet 44: 808–811. 10.1038/ng.2309 [DOI] [PMC free article] [PubMed] [Google Scholar]
- Jaillon O, Aury JM, Noel B, Policriti A, Clepet C, Casagrande A, Choisne N, Aubourg S, Vitulo N, Jubin C, et al. 2007. The grapevine genome sequence suggests ancestral hexaploidization in major angiosperm phyla. Nature 449: 463–467. 10.1038/nature06148 [DOI] [PubMed] [Google Scholar]
- Jiao Y, Wickett NJ, Ayyampalayam S, Chanderbali AS, Landherr L, Ralph PE, Tomsho LP, Hu Y, Liang H, Soltis PS, et al. 2011. Ancestral polyploidy in seed plants and angiosperms. Nature 473: 97–100. 10.1038/nature09916 [DOI] [PubMed] [Google Scholar]
- Jiao Y, Li J, Tang H, Paterson AH. 2014. Integrated syntenic and phylogenomic analyses reveal an ancient genome duplication in monocots. Plant Cell 26: 2792–2802. 10.1105/tpc.114.127597 [DOI] [PMC free article] [PubMed] [Google Scholar]
- Larkin MA, Blackshields G, Brown NP, Chenna R, McGettigan PA, McWilliam H, Valentin F, Wallace IM, Wilm A, Lopez R, et al. 2007. Clustal W and Clustal X version 2.0. Bioinformatics 23: 2947–2948. 10.1093/bioinformatics/btm404 [DOI] [PubMed] [Google Scholar]
- Li H, Durbin R. 2009. Fast and accurate short read alignment with Burrows–Wheeler transform. Bioinformatics 25: 1754–1760. 10.1093/bioinformatics/btp324 [DOI] [PMC free article] [PubMed] [Google Scholar]
- Li L, Stoeckert CJ Jr, Roos DS. 2003. OrthoMCL: identification of ortholog groups for eukaryotic genomes. Genome Res 13: 2178–2189. 10.1101/gr.1224503 [DOI] [PMC free article] [PubMed] [Google Scholar]
- Li H, Handsaker B, Wysoker A, Fennell T, Ruan J, Homer N, Marth G, Abecasis G, Durbin R; 1000 Genome Project Data Processing Subgroup. 2009. The Sequence Alignment/Map format and SAMtools. Bioinformatics 25: 2078–2079. 10.1093/bioinformatics/btp352 [DOI] [PMC free article] [PubMed] [Google Scholar]
- Mace ES, Tai S, Gilding EK, Li Y, Prentis PJ, Bian L, Campbell BC, Hu W, Innes DJ, Han X et al. 2013. Whole-genome sequencing reveals untapped genetic potential in Africa's indigenous cereal crop sorghum. Nat Commun 4: 2320 10.1038/ncomms3320 [DOI] [PMC free article] [PubMed] [Google Scholar]
- Morris GP, Ramu P, Deshpande SP, Hash CT, Shah T, Upadhyaya HD, Riera-Lizarazu O, Brown PJ, Acharya CB, Mitchell SE, et al. 2013. Population genomic and genome-wide association studies of agroclimatic traits in sorghum. Proc Natl Acad Sci 110: 453–458. 10.1073/pnas.1215985110 [DOI] [PMC free article] [PubMed] [Google Scholar]
- Paterson AH, Bowers JE, Chapman BA. 2004. Ancient polyploidization predating divergence of the cereals, and its consequences for comparative genomics. Proc Natl Acad Sci 101: 9903–9908. 10.1073/pnas.0307901101 [DOI] [PMC free article] [PubMed] [Google Scholar]
- Paterson AH, Bowers JE, Bruggmann R, Dubchak I, Grimwood J, Gundlach H, Haberer G, Hellsten U, Mitros T, Poliakov A, et al. 2009. The Sorghum bicolor genome and the diversification of grasses. Nature 457: 551–556. 10.1038/nature07723 [DOI] [PubMed] [Google Scholar]
- Paterson AH, Wendel JF, Gundlach H, Guo H, Jenkins J, Jin D, Llewellyn D, Showmaker KC, Shu S, Udall J, et al. 2012. Repeated polyploidization of Gossypium genomes and the evolution of spinnable cotton fibres. Nature 492: 423–427. 10.1038/nature11798 [DOI] [PubMed] [Google Scholar]
- Reva B, Antipin Y, Sander C. 2011. Predicting the functional impact of protein mutations: application to cancer genomics. Nucleic Acids Res 39: e118 10.1093/nar/gkr407 [DOI] [PMC free article] [PubMed] [Google Scholar]
- Schnable PS, Ware D, Fulton RS, Stein JC, Wei F, Pasternak S, Liang C, Zhang J, Fulton L, Graves TA, et al. 2009. The B73 maize genome: complexity, diversity, and dynamics. Science 326: 1112–1115. 10.1126/science.1178534 [DOI] [PubMed] [Google Scholar]
- Tang H, Bowers JE, Wang XY, Paterson AH. 2010. Angiosperm genome comparisons reveal early polyploidy in the monocot lineage. Proc Natl Acad Sci 107: 472–477. 10.1073/pnas.0908007107 [DOI] [PMC free article] [PubMed] [Google Scholar]
- Taylor JS, Raes J. 2004. Duplication and divergence: the evolution of new genes and old ideas. Annu Rev Genet 38: 615–643. 10.1146/annurev.genet.38.072902.092831 [DOI] [PubMed] [Google Scholar]
- Thornton K. 2003. Libsequence: a C++ class library for evolutionary genetic analysis. Bioinformatics 19: 2325–2327. 10.1093/bioinformatics/btg316 [DOI] [PubMed] [Google Scholar]
- Thurber CS, Ma JM, Higgins RH, Brown PJ. 2013. Retrospective genomic analysis of sorghum adaptation to temperate-zone grain production. Genome Biol 14: R68 10.1186/gb-2013-14-6-r68 [DOI] [PMC free article] [PubMed] [Google Scholar]
- The Tomato Genome Consortium. 2012. The tomato genome sequence provides insights into fleshy fruit evolution. Nature 485: 635–641. 10.1038/nature11119 [DOI] [PMC free article] [PubMed] [Google Scholar]
- Van de Peer Y, Maere S, Meyer A. 2009. The evolutionary significance of ancient genome duplications. Nat Rev Genet 10: 725–732. 10.1038/nrg2600 [DOI] [PubMed] [Google Scholar]
- Vilela MM, Del Bem LE, Van Sluys MA, de Setta N, Kitajima JP, Cruz GM, Sforça DA, de Souza AP, Ferreira PC, Grativol C, et al. 2017. Analysis of three sugarcane homo/homeologous regions suggests independent polyploidization events of Saccharum officinarum and Saccharum spontaneum. Genome Biol Evol 9: 266–278. 10.1093/gbe/evw293 [DOI] [PMC free article] [PubMed] [Google Scholar]
- Wang X, Wang H, Wang J, Sun R, Wu J, Liu S, Bai Y, Mun JH, Bancroft I, Cheng F, et al. 2011. The genome of the mesopolyploid crop species Brassica rapa. Nat Genet 43: 1035–1039. 10.1038/ng.919 [DOI] [PubMed] [Google Scholar]
- Wang Y, Li J, Paterson AH. 2013. MCScanX-transposed: detecting transposed gene duplications based on multiple colinearity scans. Bioinformatics 29: 1458–1460. 10.1093/bioinformatics/btt150 [DOI] [PubMed] [Google Scholar]
- Wang X, Wang J, Jin D, Guo H, Lee TH, Liu T, Paterson AH. 2015. Genome alignment spanning major Poaceae lineages reveals heterogeneous evolutionary rates and alters inferred dates for key evolutionary events. Mol Plant 8: 885–898. 10.1016/j.molp.2015.04.004 [DOI] [PubMed] [Google Scholar]
- Wicker T, Mayer KF, Gundlach H, Martis M, Steuernagel B, Scholz U, Simková H, Kubaláková M, Choulet F, Taudien S, et al. 2011. Frequent gene movement and pseudogene evolution is common to the large and complex genomes of wheat, barley, and their relatives. Plant Cell 23: 1706–1718. 10.1105/tpc.111.086629 [DOI] [PMC free article] [PubMed] [Google Scholar]
- Xu X, Liu X, Ge S, Jensen JD, Hu F, Li X, Dong Y, Gutenkunst RN, Fang L, Huang L, et al. 2012. Resequencing 50 accessions of cultivated and wild rice yields markers for identifying agronomically important genes. Nat Biotechnol 30: 105–111. 10.1038/nbt.2050 [DOI] [PubMed] [Google Scholar]
- Yang Z. 1997. PAML: a program package for phylogenetic analysis by maximum likelihood. Comput Appl Biosci 13: 555–556. [DOI] [PubMed] [Google Scholar]
- Yang J, Zhang Y. 2015. I-TASSER server: new development for protein structure and function predictions. Nucleic Acids Res 43: W174–W181. 10.1093/nar/gkv342 [DOI] [PMC free article] [PubMed] [Google Scholar]
- Zheng LY, Guo XS, He B, Sun LJ, Peng Y, Dong SS, Liu TF, Jiang S, Ramachandran S, Liu CM, et al. 2011. Genome-wide patterns of genetic variation in sweet and grain sorghum (Sorghum bicolor). Genome Biol 12: R114 10.1186/gb-2011-12-11-r114 [DOI] [PMC free article] [PubMed] [Google Scholar]
Associated Data
This section collects any data citations, data availability statements, or supplementary materials included in this article.