

Abstract
Typological theoretical perspectives suggest that the consequences of involvement in peer and dating violence may depend on the particular pattern of violent behaviors that youth experience and/or engage in. Yet few studies have examined whether distinct patterns of dating and peer violence involvement differentially predict developmental outcomes. Using two waves of data, the current study examined the prospective associations between distinct patterns of peer and dating aggression and victimization, identified using latent class analysis, and a range of potential developmental outcomes in a general population sample of adolescents in the 8th to 10th grades (n=3068; 46% female, 58% White, 31% Black, 11% other race/ethnicity). The findings suggest that, compared to youth involved in other patterns of violence, youth involved in peer and dating violence as aggressors and victims are at greatest risk for negative sequelae, although results differed considerably for girls and boys and on the outcome variable and comparison groups being examined.
Introduction
Adolescent interpersonal violence is a prevalent national problem. According to the national Youth Risk Behavior Survey, approximately 16% of high school aged students in the United States report past 30-day weapon carrying, 22% report past year physical fighting, and 10% report having experienced physical and/or sexual dating violence in the past year (Kann et al., 2016). Youth who are involved in interpersonal violence are at risk for a range of negative developmental outcomes (Arseneault et al. 2010; Chen et al. 2016; Connolly 2017; Copeland et al. 2013; Foshee et al. 2016; Nahapetyan et al. 2014). For example, longitudinal studies of dating violence have found that victims, compared to non-victims, are at increased risk of substance use, psychological distress, academic decline, physical injuries, and increased suicide attempts (Chen et al. 2016). Similar negative outcomes have been found in studies assessing the effects of peer violence victimization (Arseneault et al. 2010; Connolly 2017; Copeland et al. 2013). While less research has examined consequences for aggressors, research also suggests that perpetrators of dating and peer violence may experience similar negative internalizing and externalizing outcomes and that these associations hold even when adjusting for victimization experiences (Foshee et al. 2016; Moore et al. 2014; Nahapetyan et al. 2014).
While these studies indicate that involvement in interpersonal violence has detrimental effects for youth, most studies of the consequences of interpersonal violence have narrowly assessed whether youth have or have not experienced or engaged in one particular type (i.e. peer or dating) and form (i.e., physical or sexual or psychological) of violence victimization or perpetration. This approach fails to account for: differences in the severity of violence experienced or enacted, overlap among different types and forms of interpersonal violence, and/or for the fact that victims are often also aggressors (Haynie et al. 2001; Haynie et al. 2013). Prior findings may thus overestimate the impact of a particular measure of violence (e.g., physical dating violence victimization) since the impact may be explained by having concomitantly experienced and/or engaged in other types and forms of violence or their combination (Finkelhor et al. 2007; Hamby and Grych 2013). Further, when studies have assessed multiple violence and/or forms, the predominant analytic approach has been to focus on identifying the unique effects of each particular measure of violence, controlling for the others. Yet, this approach may fail to capture the particular configurations of violence experiences that work synergistically to predict negative outcomes. In particular, typological theoretical perspectives on violence suggest that subgroups may experience unique patterns of violence that have distinct consequences. For example, Johnson’s (1995) typology of adult partner violence, which has also been found to describe youth dating relationships (Zweig et al. 2014), suggests that those who experience multiple forms of severe partner violence in conjunction with controlling behavior, a pattern referred to as coercive controlling violence, may be at greatest risk for traumatic stress and related negative mental health outcomes (Johnson and Leone 2005).
Indeed, consistent with typological perspectives on violence, an emerging body of literature suggests there is substantial heterogeneity in the types of violence that youth engage in and experience and this heterogeneity may be key to understanding differential risk for negative consequences. For example, research examining different forms of adolescent dating violence has found that youth who are involved in physical and psychological dating abuse are at greater risk for mental health problems compared to those involved in psychological abuse only (Choi et al. 2017; Haynie et al. 2013; Reyes et al. 2017). Bullying research has found that those who both engage in and experience bullying (bully-victims) show the poorest outcomes compared to those who only bully or are only victims (Wolke and Lereya 2015; Ozdemir and Stattin 2011). The findings from the few studies that have assessed both peer and dating violence suggest that cross-context aggressor victims (i.e., those who are victims and perpetrators of peer and dating abuse) are at greater risk for internalizing and externalizing behaviors compared to those involved in only one violence type (Bossarte et al. 2008; Garthe et al. 2018; Whiteside et al. 2013). For example, Whiteside et al. (2013) found that cross-context aggressor victims were more likely than peer-only aggressor victims to report heavy alcohol and marijuana use and to have carried a weapon. Bossarte et al. (2008) similarly found that suicidality and delinquent behavior was greatest among youth involved in frequent peer and dating violence compared to youth with other violence profiles.
Taken together, these findings suggest that distinct configurations or patterns of violence experiences may lead to different health outcomes for youth. However, research along these lines is limited in several ways. First, few studies have identified patterns of violence involvement using indicators that tap into multiple domains that may be key to distinguishing subgroups of violence-involved youth including: generality of violence across peer and dating contexts; form of violence (i.e., psychological, physical, sexual); violence severity; and aggressor victims overlap. Second, to our knowledge, all previous studies examining patterns of peer and dating violence involvement among adolescents have been cross-sectional, precluding the ability to establish temporality of associations with potential outcome variables, and most have used high risk samples, limiting generalizability of findings. Finally, to our knowledge, no previous research has examined whether and how associations between patterns of peer and dating violence involvement and developmental outcomes differ for boys and girls. This is an important line of research given that theory and some empirical research suggest that the etiology, manifestation, and consequences of violence involvement may differ for boys and girls, though findings have been inconsistent (Connolly 2017; Exner-Cortens et al. 2013; Foshee et al. 2013; Foshee et al. 2016).
The Current Study
The current study used two waves of data from a large study of a general population of adolescents to examine longitudinal associations between membership in distinct patterns of peer and dating violence and a range of potential developmental consequences. The study builds on previous research with the current sample that used latent class analysis to identify four unique patterns of violence involvement among boys and girls that differed by sex (Reyes et al. 2018). Among both boys and girls, three general patterns were identified: no involvement in violence (uninvolved); an aggressor and victim of peer violence only (peer aggressor victims), and an aggressor and victim of peer and dating violence (cross-context aggressor victims). Among girls a unique pattern emerged characterized by involvement in occasional verbal dating abuse (verbal dating aggressor victims). Among boys a unique pattern emerged characterized by being a victim of only moderate physical dating and peer violence (cross-context physical victims). We expand on this research by determining whether and how involvement in these distinct patterns of violence differentially predicts developmental outcomes for boys and girls, controlling for temporality of associations.
We examined the effects of violence pattern involvement on two sorts of behavioral adjustment, internalizing (depressive symptoms, anxiety, and body image) and externalizing (substance use and delinquency) behaviors, as well as on academic aspirations, and peer relationships (close friendships and peer status). Behavioral adjustment, school engagement, and social connectedness are key assets that may be proximally affected by violence involvement, are critical to facilitating positive emotional and social development among youth, and influence life-course trajectories of health and well-being (Hamilton et al. 2004; Brumbach et al. 2009).
Figure 1 illustrates the conceptual model used to examine pathways between class membership and the types of outcomes studied. We examined pathways separately for girls and boys, though we do not make specific hypotheses about sex differences given inconsistencies in previous research. As noted above, previous research has demonstrated that youth involved in multiple types or forms of violent behavior may be more likely to experience detrimental consequences than youth involved in singular types or forms of violence. Drawing from this research, our general research hypothesis was that, compared to those involved in other violence patterns, cross-context aggressor victims would be at greater risk for negative developmental outcomes.
Figure 1.
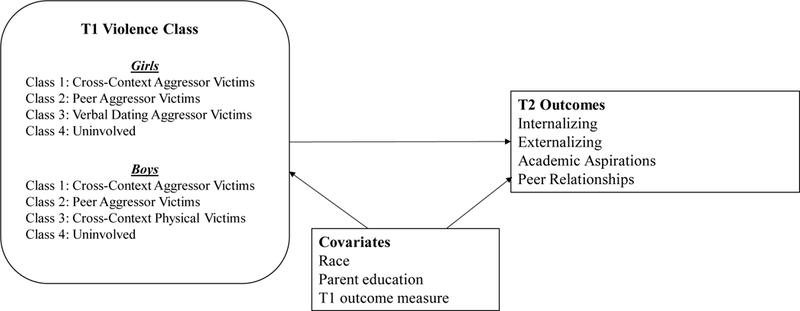
Heuristic diagram depicting longitudinal associations between violence class membership and developmental consequences.
Methods
Study design and sample
The data are from a study of adolescent health risk behaviors that was conducted in all public schools in three nonmetropolitan counties in North Carolina. All adolescents in public schools in the participating counties who were in grades 8, 9 and 10, were able to complete the survey in English, and who were not in special education programs were eligible to participate in the study at baseline (T1; Fall) and six months later at follow-up (T2; Spring). Parents had the opportunity to refuse consent for their child’s participation by returning a written form or by calling a toll-free telephone number. Immediately prior to the survey administration, adolescent assent was obtained from teens whose parents had consented. Trained data collectors administered the questionnaires in student classrooms on at least two occasions to reduce the effect of absenteeism on response rates. The Institutional Review Board for the School of Public Health at the University of North Carolina at Chapel Hill approved the data collection protocols.
A total of 6342 students were eligible to participate in the study at baseline. Of these 5016 (79%) completed a survey. Non-participation was due to: (1) parental declination of consent (6%), (2) adolescent declination of assent (7%), and absenteeism on days of data collection (7%). We restricted the sample to participants who reported having dated (n=3109) and who were not missing data on sex (n=1) or on all of the violence indicators (n=40; 1% of the sample of daters), yielding a final analytic sample of n=3068 at baseline. The sample is 46% female; 58% white, 31% black and 11% of another race/ethnicity; 33% of participants were in grade 8, 35% in grade 9 and 32% in grade 10; 26% reported that the highest level of education obtained by either parent was high school or less. Of those in the baseline analytic sample, 85% (n=2627) participated in the follow-up assessment.
Measures
Latent classes of dating and peer violence aggression and victimization.
As noted above, in our previous research we found that a four-class latent categorical variable best characterized adolescent patterns of involvement in dating and peer violence among boys and girls, but a test of measurement invariance indicated that the nature of the classes differed by sex. Among both boys and girls, three classes were identified: uninvolved (45% of girls, 61% of boys), peer aggressor victims (23% of girls, 21% of boys), and cross-context aggressor victims (12% of girls, 5% of boys). Among girls, but not boys, a verbal dating aggressor victims class (21% of girls) was identified. Among boys, but not girls, a cross-context physical victims class (13% of boys) was identified. Notably, the peer aggressor victims class differed for boys and girls in that girls in this class were likely to be involved only in moderate peer violence, whereas boys in this class were involved in severe peer violence. In addition, the cross-context aggressor victims class differed for boys and girls in that boys in this class were likely be involved in frequent controlling and sexual dating aggression, whereas girls were not likely to engage in these forms of aggression. A detailed description of the latent class analysis, including fit statistics are provided in Reyes et al. 2018. Table 1 provides prevalence rates for each of the fourteen categorical indicators of dating and peer violence aggression and victimization (described below) that were used in estimating the latent class model. Figure 2 provides a visual representation of the item response probabilities for the four-class models for girls (top panel) and boys (bottom panel).
Table 1.
Prevalence of dating and peer violence perpetration and victimization at baseline (T1) among girls (n=1420) and boys (n=1648)
| Latent class indicators | Girls % |
Boys % |
|---|---|---|
| Violence Perpetration | ||
| Moderate physical PV | 33 | 38 |
| Severe physical PV | 16 | 22 |
| Moderate physical DV | 16 | 7 |
| Severe physical DV | 7 | 5 |
| Sexual DV | 4 | 8 |
| Verbal DV | ||
| Occasional | 23 | 11 |
| Frequent | 11 | 9 |
| Controlling DV | ||
| Occasional | 10 | 5 |
| Frequent | 5 | 4 |
| Violence Victimization | ||
| Moderate physical PV | 36 | 36 |
| Severe physical PV | 12 | 22 |
| Moderate physical DV | 14 | 14 |
| Severe physical DV | 5 | 7 |
| Sexual DV | 9 | 10 |
| Verbal DV | ||
| Occasional | 23 | 12 |
| Frequent | 12 | 7 |
| Controlling DV | ||
| Occasional | 14 | 10 |
| Frequent | 10 | 7 |
Note. PV= peer violence. DV= dating violence.
Figure 2.
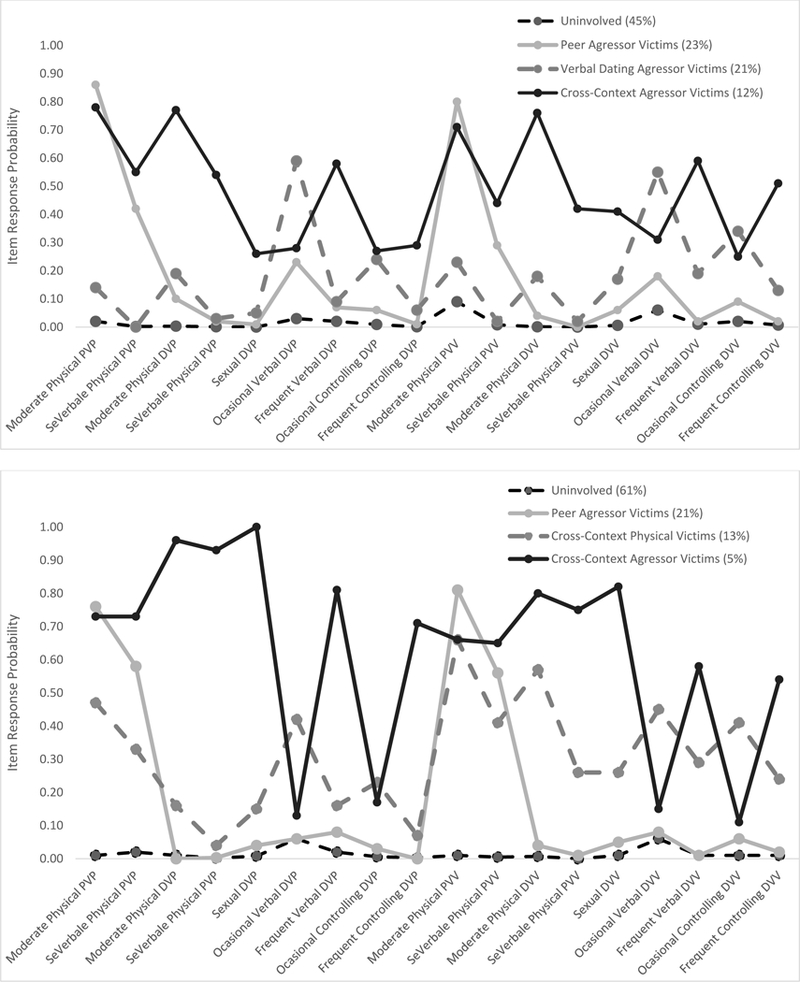
Latent classes of peer and dating violence for girls (top panel) and boys (bottom panel)
Peer violence aggression and victimization.
Peer violence was assessed using a modified version of the Safe Dates Dating Abuse Scale (Foshee 1996) that refers to peers rather than dates. Adolescents were asked, “During the past three months, how many times did you do each of the following things to someone about the same age as you that you were not dating?” A parallel question assessed victimization. Three items were listed that assessed acts of moderate physical aggression (e.g., “slapped or scratched them”) and three assessed acts of severe physical aggression (e.g., “hit them with a fist or something else hard”), with parallel items assessing victimization. Response categories for the items ranged from zero (0) to ten times or more (4). We created four binary indicators of peer violence (moderate aggression and victimization; severe aggression and victimization) such that for each indicator 0 indicated no involvement and 1 indicated at least one act of violence.
Dating violence aggression and victimization.
Involvement in dating aggression was also assessed using a short version of the Safe Dates Dating Abuse Scale (Foshee, 1996) but with reference to “someone you were dating or on a date with?” Adolescents were further instructed not to include acts that were perpetrated “in self-defense or play.” Moderate and severe physical dating violence aggression and victimization (four indicators) were assessed with the same items used to index peer violence and coded in the same manner. Additional items indexed sexual dating violence (“forced you to have sex”, “forced you to do something sexual that you did not want to do”), verbal dating violence (“said something to hurt their feelings,” “insulted them in front of others,” “threatened to hurt you”) and controlling behavior (“would not let you do things with other people,” “made you describe where you were every minute of the day”), with parallel items assessing aggression and victimization. Sexual dating violence aggression and victimization were coded such that 0 indicated no involvement and 1 indicated involvement in at least one act of sexual aggression/victimization in the past three months. Indicators of involvement in verbal and controlling aggression and victimization were created such that those endorsing no acts were given a score of “0” (no involvement); those who endorsed any act of that form of aggression 1–2 times were given a score of “1” (occasional involvement), and individuals who endorsed any act of that form of aggression 3 or more times were given a score of “2” (frequent involvement).
Outcome measures.
All outcome measures were assessed at both T1 and T2. Body image, academic aspirations, and social status were scored such that higher values indicated a positive outcome. All other outcomes were scored such that higher values indicated a negative outcome. With the exception of social status (centrality), all measures used a past three-month reference frame and were based on self-report. Table 2 provides descriptive statistics on the outcome measures for boys and girls at both time points.
Table 2.
Descriptive statistics for outcome measures at baseline (T1) and follow-up (T2) among girls (n=1420) and boys (n=1648).
| Outcome measures | Mean or % at T1 and T2 | |
|---|---|---|
| T1 (Girls/Boys) |
T2 (Girls/Boys) |
|
| Internalizing | ||
| Depressive symptoms | 1.28/1.13 | 1.33/1.32 |
| Anxiety | 2.07/1.58 | 2.08/1.55 |
| Body image | 2.19/2.47 | 2.15/2.50 |
| Externalizing | ||
| Heavy alcohol use | 26/23 | 25/24 |
| Cigarette use | 33/30 | 30/28 |
| Marijuana use | 24/29 | 23/26 |
| Hard drug use | 5/8 | 5/9 |
| Number of delinquent acts | 1.57/1.60 | 1.74/1.64 |
| Academic aspirations and peer relationships | ||
| Academic aspirations | 95/90 | 96/89 |
| Number of close friends | 6.54/7.18 | 6.14/7.18 |
| Social status | 1.10/0.98 | 1.00/0.86 |
Internalizing.
Depressive symptoms.
Depressive symptoms were measured using three items from the Short Mood and Feelings Questionnaire (Angold et al. 1995). Adolescents were asked how often in the past three months they agreed with the following statements: “I hated myself,” “I was a bad person,” and “I did everything wrong” (T2 α=.94). Response options for each item ranged from (0) “strongly disagree” to (4) “strongly agree.” Items were averaged to create a composite score.
Anxiety.
Anxiety was measured by seven items (e.g., “I felt sick to my stomach”; T2 α=.91) from the Revised Children’s Manifest Anxiety Scale (Reynolds and Richmond, 1979). Response options for each item ranged from (0) indicating “strongly disagree” to (4) “strongly agree.” Items were averaged to create a composite score.
Body image.
Body image was measured by three items (e.g., “most of the time I am happy with how I look”; T2 α=.91) from the Self Image Scale for Young Adolescents (Petersen et al. 1994). Response options for each item ranged from (0) “strongly disagree” to (3) “strongly agree.” Items were averaged to create a composite score.
Externalizing.
Heavy alcohol use.
Heavy alcohol use was measured using four items that asked adolescents how many times they had 3 or 4 drinks in a row, 5 or more drinks in a row, gotten drunk or very high from drinking alcohol, and been hung over in the past three months (T2 α=.93). Response options for each item ranged from (0) “none” to (4) “greater than or equal to 10 times.” A composite score was created by summing the four items and dichotomizing such that (0) indicated no heavy alcohol use and (1) indicated at least one incident of heavy alcohol use.
Cigarette use.
Cigarette use was assessed with a single item that asked adolescents the number of days they had smoked cigarettes in the past 3 months. Response options for this item ranged from (0) “0 days” to (5) “20 days or more.” Adolescent responses were dichotomized such that (0) indicated no smoking on any days and (1) indicated that the adolescent endorsed cigarette smoking on one or more days.
Marijuana use.
Marijuana use was assessed with a single item that asked adolescents the number of times they had used marijuana. Response options for this item ranged from (0) “none” to (4) “10 times or more.” Adolescent responses were dichotomized such that (0) indicated no marijuana use and (1) indicated marijuana use one or more times.
Hard drug use.
Hard drug use was assessed with a single item that asked adolescents the number of times they had used hard drugs. Response options for this item ranged from (0) “none” to (4) “10 times or more”. Adolescent responses were dichotomized such that (0) indicated no hard drug use and (1) indicated hard drug use one or more times.
Number of delinquent acts.
Delinquent acts were assessed using four items (e.g., “skipped school”; T2 α=.83) from the Problem Behavior Frequency Scale (Farrell et al. 2000). Response options for each item ranged from (0) “none” to (4) “10 or more times.” A count of delinquent acts was created by summing across the four items.
Academic aspirations and peer relationships.
Academic aspirations.
Academic aspirations were assessed using a single item asking adolescents how important or unimportant it is to go to college. Response options range from (0) “not at all important” to (3) “very important.” Adolescents’ responses to this item were dichotomized such that (0) indicated the he/she felt that college was not very important or not at all important and (1) indicated that he/she felt that college was somewhat important or very important.
Number of close friends.
Number of close friends was assessed by asking adolescents how many close or best friends they had. Responses options ranged from (0) zero friends to (10) 10 or more friends.
Social status.
The social status outcome, Bonacich power centrality, was created through social network analysis. At each wave, students were given a Student Directory that listed all enrolled students along with an identification number for each. Adolescents identified up to five close friends. Nomination data were then used to create the social status variable (Bonacich 1987; Wasserman and Faust 1994); individuals who are connected to more central others have higher Bonacich centrality scores than those who are not. For example, individual i and j both have 5 close friends, but individual i’s friends each also have more friends compared to that of individual j’s friends. In that case individual i would have a higher centrality score that individual j. The centrality measure was created using James Moody’s SPAN (SAS Programs for Analyzing Networks) modules (Moody 2000).
Analysis Strategy
We estimated a series of latent class regression models (one for each outcome) using the approach developed in Vermunt (2010). This approach allowed us to examine associations between latent class membership and each outcome while adjusting for both: (1) measurement error due to uncertainty of class classification (for more details see, Vermunt 2010, and Asporouhov and Muthén 2014) and (2) the effects of control variables (race, parent education, and the T1 measure of the outcome) on class membership and the T2 outcome measure. Because the nature of the latent class variable differed for boys (n=1420) and girls (n=1648) all models were sex-stratified. Binary outcomes were modeled using logistic regression, count outcomes using negative binomial regression, and continuous outcomes using linear regression.
To test the study hypothesis for each outcome while constraining type one error due to multiple comparisons we first conducted an omnibus multiparameter Wald test to determine whether constraining the predicted mean (or probability) of the outcome to be equal across classes, as compared to allowing the parameter estimates to vary across classes, produced a significant decrement in model fit. If the omnibus test was statistically significant at alpha=.05, indicating class differences, we examined pairwise comparisons between classes on the outcome using Wald tests. If the omnibus test was not statistically significant we did not conduct post-hoc comparisons. Pair-wise comparisons involving the cross-context aggressor victims class were of primary interest given that our overarching hypothesis was that members of this class, compared to each of the other three classes, would be at greater risk for negative outcomes. Additional post-hoc analyses examined pairwise comparisons among the other three classes.
Missing data on the LCA indicators and outcome variable was accounted for using full information maximum likelihood, which provides unbiased parameter estimates under the assumption that data are missing at random (MAR; Allison 2001). Missing data on control variables was dealt with using a modified joint likelihood (i.e., endogenous X) approach that retains all cases under MAR assumptions (Sterba 2014).
Results
Results for girls and boys are described in two sections. The first section describes findings related to our overarching hypothesis that being in the cross-context aggressor victims class as compared to each of the other classes would longitudinally predict negative outcomes for each of the variables under study. The second section reports findings of analyses comparing the remaining three violence profiles. The findings are summarized in Table 3 for girls and Table 4 for boys.
Table 3.
Effects of latent class membership on outcome measures among girls (n=1420).
| Outcome | Class 1 | Class 2 | Class 3 | Class 4 | Omnibus, Χ2(3) |
Post-hoc comparisons to Class 1 |
All other post-hoc pair-wise comparisons |
|---|---|---|---|---|---|---|---|
| Cross-Context Aggressor- Victims |
Peer Aggressor- Victims |
Verbal Dating Aggressor- Victims |
Uninvolved | ||||
| Internalizing | |||||||
| Depressive symptoms | 1.72 (.17) | 1.47 (.14) | 1.66 (.14) | 1.26 (.12) | 20.73*** | 1>2^, 1>4*** | 2>4*, 3>4*** |
| Anxiety | 2.10 (.13) | 2.22 (.10) | 2.27 (.10) | 1.93 (.09) | 22.51*** | 2>4***, 3>4*** | |
| Body image | 1.96 (.09) | 2.02 (.07) | 2.01 (.07) | 2.16 (.06) | 16.07** | 1>4** | 2>4*, 3>4** |
| Externalizing | |||||||
| Heavy alcohol use | .29 | .15 | .17 | .12 | 15.55** | 1>2**, 1>3*, 1>4*** | 3>4^ |
| Cigarette use | .29 | .20 | .17 | .14 | 11.00* | 1>3*, 1>4** | 2>4^ |
| Marijuana use | .20 | .11 | .12 | .08 | 13.00** | 1>2*,1>3^, 1>4*** | |
| Hard drug use | .09 | .05 | .04 | .02 | 11.01* | 1>3^,1>4** | 2>4* |
| No. of delinquent acts | 1.41 (.20) | 1.27 (.15) | 1.20 (.13) | 0.84 (.09) | 27.10*** | 1>4*** | 2>4***, 3>4*** |
| Academic aspirations and peer relationships | |||||||
| Academic aspirations | .21 | .36 | .46 | .60 | 11.00* | 1<3*, 1<4** | 2<4^ |
| No. of close friends | 5.66 (.38) | 6.10 (.30 | 5.78 (.29) | 6.06 (.28) | 3.25 | -- | -- |
| Social status | 0.85 (.07) | 0.96 (.05) | 0.90 (.05) | 0.99 (.05) | 10.16* | 1<2*, 1<4** | 3<4* |
Note. Each model included race, parent education, and the T1 outcome measure as covariates. Predicted means (standard errors) are presented for continuous outcomes, predicted probabilities/counts are presented for binary/count outcomes. If the omnibus test was statistically significant, all pairwise comparisons between classes were tested; comparisons between classes significant at p<.10 are shown in the last column of the table.
^ p<.10,
* p<.05,
** p<.01,
*** p<.001.
Table 4.
Effects of latent class membership on outcome measures among boys (n=1648).
| Outcome | Class 1 | Class 2 | Class 3 | Class 4 | Omnibus, Χ2(3) |
Post-hoc comparisons to Class 1 |
All other post-hoc pair-wise comparisons |
|---|---|---|---|---|---|---|---|
| Cross-Context Aggressor- Victims |
Peer Aggressor- Victims |
Cross-Context Physical Victims |
Uninvolved | ||||
| Internalizing | |||||||
| Depressive symptoms | 1.52 (.33) | 1.39 (.15) | 1.27 (.17) | 1.20 (.13) | 4.29 | -- | -- |
| Anxiety | 1.63 (.31) | 1.77 (.13) | 1.86 (.14) | 1.63 (.12) | 5.10 | -- | -- |
| Body image | 2.64 (.20) | 2.37 (.07) | 2.46 (.08) | 2.43 (.06) | 4.10 | -- | -- |
| Externalizing | |||||||
| Heavy alcohol use | .19 | .22 | .23 | .12 | 19.00*** | -- | 2>4***, 3>4*** |
| Cigarette use | .14 | .20 | .24 | .14 | 7.78^ | -- | -- |
| Marijuana use | .15 | .14 | .17 | .11 | 4.50 | -- | -- |
| Hard drug use | .29 | .18 | .15 | .09 | 10.96* | 1>4** | 2>4* |
| No. of delinquent acts | 1.91 (.47) | 1.18 (.16) | 1.32 (.20) | 1.00 (.13) | 14.25** | 1>2*, 1>4** | 2>4^, 3>4* |
| Academic aspirations and peer relationships | |||||||
| Academic aspirations | .26 | .34 | .40 | .31 | 1.16 | -- | -- |
| No. of close friends | 7.35 (.68) | 6.69 (.33) | 6.46 (.39) | 6.91 (.30) | 3.39 | -- | -- |
| Social status | 0.86 (.10) | 0.95 (.06) | 0.88 (.07) | 0.93 (.05) | 1.77 | -- | -- |
Note. Each model included race, parent education, and the T1 outcome measure as covariates. Predicted means (standard errors) are presented for continuous outcomes, predicted probabilities/counts are presented for binary/count outcomes. If the omnibus test was statistically significant, all pairwise comparisons between classes were tested; comparisons between classes significant at p<.10 are shown in the last column of the table.
^p<.10,
*p<.05,
**p<.01,
***p<.001.
Associations between interpersonal violence patterns and outcomes among girls
Cross-context aggressor victims (Class 1).
Mixed evidence for our hypothesis was found for girls. Consistent with expectations, among girls, the predicted probability of heavy alcohol use at follow-up was significantly higher for girls in the cross-context aggressor victims class compared to girls in each of the other classes. For other outcomes, associations were statistically significant and in the expected direction for some comparisons but not others, with the greatest number of effects found when comparing the cross-context aggressor victims class to the uninvolved class. In particular, being in the cross-context aggressor victims class vs. the uninvolved class (Class 4) was significantly associated with: greater depressive symptoms; poorer body image; increased likelihood of involvement in marijuana, cigarette, and hard drug use; greater delinquency; and lower academic aspirations and social status. Girls who were cross-context aggressor victims were also more likely to report marijuana use and had lower social status at follow-up than peer aggressor victims and were significantly more likely to report cigarette smoking and lower college aspirations than verbal dating aggressor victims (Class 3).
Other comparisons.
Girls who were peer aggressor victims (Class 2) did not significantly differ from verbal dating aggressor victims (Class 3) across any of the outcomes examined. However, these two violence classes differed from the uninvolved class on several outcomes. Girls in the peer (Class 2) and verbal dating (Class 3) aggressor victims classes reported greater anxiety and depressive symptoms, poorer body image, and higher levels of delinquency at follow-up compared to girls in the uninvolved class (Class 4). Girls who were peer aggressor victims (Class 2) were more likely to report hard drug use at follow-up than uninvolved (Class 4) girls. Girls who were verbal dating aggressor victims (Class 3) had lower social status at follow-up compared to uninvolved (Class 4) girls.
Associations between interpersonal violence patterns and outcomes among boys
Cross-context aggressor victims (Class 1).
Among boys, far fewer associations were found than for girls with findings also providing mixed evidence for our hypothesis. In particular, consistent with expectations, boys in the cross-context aggressor victims class reported greater involvement in delinquency at follow-up compared to boys in both the peer aggressor victims (Class 2) and uninvolved (Class 4) classes and reported greater hard drug use at follow-up compared to uninvolved boys. No other significant associations were found when comparing boys in the cross-context aggressor victims class to boys in each of the other classes across any of the other outcomes.
Other comparisons.
No associations were found when comparing boys who were peer aggressor victims (Class 2) to those who were cross-context physical victims (Class 3). However, as with the girls, these two violence classes differed from the uninvolved class on several outcomes. Boys in the peer aggressor victims (Class 2) and cross-context physical victims (Class 3) classes were significantly more likely to report heavy alcohol use at follow-up than uninvolved boys (Class 4). Boys who were peer aggressor victims (Class 2) were also more likely to report hard drug use at follow-up than uninvolved boys (Class 4). Further, boys who were cross-context physical victims (Class 3) reported greater levels of delinquency at follow-up compared to boys in the uninvolved class (Class 4).
Alternate model analysis
Simulation research suggests that stepwise latent-class analyses that employ the maximum-likelihood (ML) approach used in the current study can be sensitive to violations of the assumption of normality for continuous outcomes. Thus, for each of the outcomes that were treated as continuous in the current study we conducted sensitivity analysis to assess whether results held when using a weighted analysis approach proposed by Bolck, Croon, and Hagenaars (referred to as the BCH approach; Bolck et al. 2004; Vermunt 2010), which has been found to be robust against violations of normality assumptions (Bakk and Vermunt 2016). This analysis found that results did not substantively differ when using the BCH approach, suggesting findings were robust to our choice of modeling approach.
Discussion
Numerous studies suggest that involvement in peer and/or dating violence leads to negative outcomes for youth (Arseneault et al. 2010; Chen et al. 2016; Connolly 2017; Copeland et al. 2013; Foshee et al. 2016; Nahapetyan et al. 2014). However, most extant research on violence outcomes has focused on identifying the unique effects of experiencing a particular type and form of violence (e.g., physical dating violence) victimization or perpetration, thus failing to account for overlap and heterogeneity in the types and forms of violence that youth experience and engage in that may be key to understanding differential risk for negative consequences. The current study addresses this gap by examining associations between patterns of peer and dating aggression and victimization, assessed separately for boys and girls, and a range of potential negative outcomes key in adolescent development. Overall, the findings demonstrate substantial variation in negative outcomes across different patterns of peer and dating violence involvement and, consistent with expectations, suggest that involvement in peer and dating aggression and victimization confers the greatest risk for negative sequelae, although results differed for girls and boys and on the outcome and comparison groups being examined.
Our overarching hypothesis was that youth who were cross-context aggressor victims would be at greater risk for negative outcomes compared to youth involved in other patterns of interpersonal violence. Consistent with this expectation, being in the cross-context aggressor victims class vs. the uninvolved class predicted negative outcomes across all but one of the variables examined among girls and, among boys, predicted increased risk of hard drug use and delinquency involvement. Several associations were also identified when comparing those in the cross-context aggressor victims class to other violence-involved classes, particularly for girls. Most notably, among girls, those in the cross-context aggressor victims class were significantly more likely to report heavy alcohol use involvement at follow-up (29% predicted probability) compared to girls in both the peer aggressor victims (15% predicted probability) and verbal dating aggressor victims (17% predicted probability) classes. Further, girls in the cross-context aggressor victims class were distinguished from those in other violence classes by elevated rates of cigarette and marijuana use and lower academic aspirations and social status, though associations varied for different comparison groups. Among boys, those in the cross-context aggressor victims group reported greater delinquency at follow-up compared to those in the peer aggressor victims class and, notably, the magnitude of hard drug use was very high for this class (predicted probability of 29%).
While these findings provide some support for the notion that cross-contextual violence involvement confers particularly high risk for negative developmental consequences, results suggest that being in the other violence-involved classes also predicted negative outcomes among both girls and boys. This was particularly noticeable for girls; compared to girls in the uninvolved class, girls in both the peer and verbal dating aggressor-victims classes were at increased risk for a range of negative outcomes, with consistent effects for both classes on internalizing outcomes and delinquency involvement. Given that both of these classes were characterized by involvement in less severe/frequent forms of violence, these findings suggest that involvement in any type/form of violence can have harmful effects for girls, particularly with respect to internalizing outcomes. Further, this finding is consistent with previous research that has found that verbal (psychological) dating abuse has negative consequences independent of involvement in physical abuse (Foshee et al. 2013; Exner-Cortens et al. 2013).
More broadly, we note that our overall pattern of findings suggest that girls may be at greater risk than boys for experiencing a greater number and range of negative outcomes as a result of interpersonal violence involvement. This is evidenced in the fact that the overall test of differences in means across classes was statistically significant for 10 of the 11 outcomes examined among girls; whereas, among boys, associations were identified for only 3 of the 11 outcomes. As noted above, research on sex differences in the consequences of adolescent peer and dating violence is inconsistent (Connolly 2017; Exner-Cortens et al. 2013; Foshee et al. 2013; Foshee et al. 2016). However, some research focused on the consequences of violence victimization has similarly found that girls may be at greater risk than boys for experiencing an increased range and number of negative outcomes (e.g., Carbone-López et al. 2006; Gruber and Fineran 2008; Thompson et al. 2006). Researchers have speculated that this may be because girls are socialized to maintain and safeguard interpersonal relationships and are more likely to engage in self-blame after abusive behavior occurs, making conflict in these contexts particularly stressful for girls as compared to boys (Carbone-Lopez et al. 2010; Thompson et al. 2006).
Some research suggests that girls and boys may react to conflict-induced emotional stress differently, with girls more likely to internalize and boys more likely to externalize stress reactions (Leadbeater et al. 1995; Maschi et al. 2008). Consistent with the notion that boys cope with stress by externalizing their behavior, we found that violence involvement was primarily related to delinquency and substance use outcomes among boys although, notably, we also found associations with these outcomes among girls. Further, we found that involvement in violence, regardless of pattern, was associated with increased anxiety, depressive symptoms, and poor body image among girls, whereas no association with these internalizing outcomes was found for boys.
Among girls, being in the cross-context aggressor victims class and verbal dating aggressor victims class vs. the uninvolved class was associated with decreased social status at follow-up; no association between violence class membership and social status was found for boys. These findings may be explained by sex and developmental differences in relations among different forms of aggression and social status indices. In particular, our study assessed “overt” (e.g., physical, verbal) rather than “covert” relational (e.g., rumor spreading, social exclusion) forms of aggression. Researchers have suggested that overt forms of aggression may lead to increases in social status during childhood but are increasingly less tolerated by peers as children grow older. For girls in early to mid-adolescence (the grade range assessed in the current study), this relationship may reverse directions such that involvement in overt forms of violence may lead to lower social status (as measured by network centrality). This may be because girls’ involvement in overt aggression is viewed by peers as particularly non-normative (and thus something that would harm social status; Waasdorp et al. 2013).
The current study had a number of strengths. The indicators of violence involvement clearly distinguished dating from peer violence and enabled patterns to be distinguished along multiple theoretical dimensions (e.g., form, severity, victimization-perpetration overlap). Potential outcomes were measured across multiple developmental domains key to setting the stage for success in adulthood. Further, we used an analytic approach that accounted for sex differences, measurement error, and temporality of associations.
There were also several study limitations. In particular, we are not able to know for certain that involvement in a particular pattern of violence caused change in the outcome variables. Although longitudinal compared to cross-sectional designs better control for timing of events, they cannot account for all possible confounding variables. Therefore, although our findings may reflect a causal relationship between violence pattern membership and adverse developmental outcomes in both male and female individuals, it is also possible that the relationship is spurious. Relatedly, only two time-points of data were used and outcomes were assessed after a six-month lag, this may have limited our ability to detect effects on outcomes that manifest across longer time-periods. On the other hand, Collin and Graham (2002) note that associations between dynamic variables like the ones we examine in the current study can decay over longer time-periods; thus, use of a short time-lag may have increased our likelihood of detecting effects. More research is needed to replicate and extend the findings of the current study to determine whether the effects of violence class membership are sustained and/or whether new effects emerge over longer follow-up periods.
There are also generalizability and measurement limitations associated with the study. The study was conducted in three predominantly rural counties, limiting the generalizability of findings to urban areas and to the national population. With the exception of the peer status variable, all data were assessed by adolescent self-report and thus subject to the potential for social desirability and single-reporter bias. Further, our assessment of aspects of peer relationships that could be affected by violence involvement was limited to two variables (number of close friends, peer status); other aspects of these relationships could be affected by violence (e.g., relationship quality, peer support). Finally, we note that it was beyond the scope of the current study to assess potential moderators of the relationship between violence patterns and negative outcomes; such research is needed given that studies suggest that reactivity to violence exposure may differ depending on the presence of individual and contextual risk and resilience factors (e.g., parental warmth; social support; Bowes et al. 2010; Holt and Espelage 2005).
Conclusion
The current study fills an important gap in the literature by exploring whether and how distinct patterns of peer and dating violence victimization and perpetration are associated with developmental outcomes during adolescence. The main findings of the study are: (1) youth who are involved in both peer and dating violence as aggressors and victims are particularly at risk for negative impacts; (2) but youth involved in any pattern of violence suffer some negative consequences; and (3) across all patterns of violence involvement, girls, in particular, are at risk for negative impacts across a range of developmental domains. These results underscore the importance of implementing prevention efforts that impact multiple forms of violence. As noted by the Centers for Disease Control and Prevention (CDC), such efforts should: start early in the life-course, thus optimizing the likelihood of long-term impact; target populations at greatest risk; and address shared risk and protective factors (e.g., social connections, family factors, and youth problem solving skills; CDC 2016). Indeed, a small but growing number of programs for adolescents have been found to effectively impact both peer and dating violence including SafERTeens (Cunningham et al. 2013), Safe Dates (Foshee et al. 2005), and Teen Choices (Levesque et al. 2016). Results also suggest that service providers who work with violence-involved youth should be aware that involvement in both dating and peer violence is associated with increased risk for a variety of negative outcomes, particularly for girls, and thus should screen broadly for mental health outcomes, substance use disorders, and impacts on social relationships, so that these outcomes can be addressed.
References
- Allison PD (2001). Missing data. Thousand Oaks, CA: Sage Publications Inc. [Google Scholar]
- Angold A, Costello EJ, Messer SC, & Pickles A (1995). Development of a short questionnaire for use in epidemiological studies of depression in children and adolescents. International Journal of Methods in Psychiatric Research, 5(4), 237–249. [Google Scholar]
- Arseneault L, Bowes L, & Shakoor S (2010). Bullying victimization in youths and mental health problems:’Much ado about nothing.’ Psychological Medicine, 40(5), 717–729. [DOI] [PubMed] [Google Scholar]
- Asparouhov T, & Muthén B (2014). Auxiliary variables in mixture modeling: Three-step approaches using M plus. Structural Equation Modeling: A Multidisciplinary Journal, 21(3), 329–341. [Google Scholar]
- Bakk Z, & Vermunt JK (2016). Robustness of stepwise latent class modeling with continuous distal outcomes. Structural Equation Modeling: A Multidisciplinary Journal, 23(1), 20–31. [Google Scholar]
- Bolck A, Croon MA, & Hagenaars JA (2004). Estimating latent structure models with categorical variables: One-step versus three-step estimators. Political Analysis, 12, 3–27. [Google Scholar]
- Bonacich P (1987). Power and centrality: A family of measures. American Journal of Sociology, 92, 1170–1182. [Google Scholar]
- Bossarte RM, Simon TR, & Swahn MH (2008). Clustering of adolescent dating violence, peer violence, and suicidal behavior. Journal of Interpersonal Violence, 23(6), 815–833. [DOI] [PubMed] [Google Scholar]
- Bowes L, Maughan B, Caspi A, Moffitt TE, & Arsenault L (2010). Families promote emotional and behavioral resilience to bullying: Evidence of an environmental effect. Journal of Child Psychology and Psychiatry, 51, 809–817. [DOI] [PubMed] [Google Scholar]
- Brook JS & Newcomb MD (1995) Childhood aggression and unconventionality: Impact on later academic achievement, drug use, and workforce involvement. Journal of Genetic Psychology, 156(4). 393–410. [DOI] [PubMed] [Google Scholar]
- Brumbach BH, Figueredo AJ, Ellis BJ (2009). Effects of harsh and unpredictable environments in adolescence on development of life history strategies: a longitudinal test of an evolutionary model. Human Nature, 20(1), 25–51. [DOI] [PMC free article] [PubMed] [Google Scholar]
- Carbone-Lopez K, Esbensen FA, & Brick BT (2010). Correlates and consequences of peer victimization: Gender differences in direct and indirect forms of bullying. Youth violence and juvenile justice, 8(4), 332–350. [Google Scholar]
- Carbone-López K, Kruttschnitt C, & Macmillan R (2006). Patterns of intimate partner violence and their associations with physical health, psychological distress, and substance use. Public Health Reports, 121(4), 382–392. [DOI] [PMC free article] [PubMed] [Google Scholar]
- Centers for Disease Control and Prevention. (2016). Preventing multiple forms of violence: A strategic vision for connecting the dots. Division of Violence Prevention, National Center for Injury Prevention and Control, Centers for Disease Control and Prevention. Retrieved from https://www.cdc.gov/violenceprevention/pdf/strategic_vision.pdf.
- Chen MS, Reyes HLM, & Foshee VA (2016). Dating abuse: prevalence, consequences, and predictors In R Levesque RJ (Ed.), Encyclopedia of Adolescence (pp. 1–21). New York, NY: Springer. [Google Scholar]
- Choi HJ, Weston R, & Temple JR (2017). A three-step latent class analysis to identify how different patterns of teen dating violence and psychosocial factors influence mental health. Journal of Youth and Adolescence, 46(4), 854–866. [DOI] [PubMed] [Google Scholar]
- Copeland WE, Wolke D, Angold A, & Costello EJ (2013). Adult psychiatric outcomes of bullying and being bullied by peers in childhood and adolescence. JAMA Psychiatry, 70(4), 419–426. [DOI] [PMC free article] [PubMed] [Google Scholar]
- Connolly EJ (2017). Sex differences in childhood bullying victimization and trajectories of substance use from adolescence to adulthood. Journal of Drug Issues, 47(1), 25–49. [Google Scholar]
- Cunningham RM, Whiteside LK, Chermack ST, Zimmerman MA, Shope JT, Bingham CR, . . . Walton MA (2013). Dating violence: Outcomes following a brief motivational interviewing intervention among at-risk adolescents in an urban emergency department. Academic Emergency Medicine, 20(6), 562–569. [DOI] [PMC free article] [PubMed] [Google Scholar]
- Exner-Cortens D, Eckenrode J, & Rothman E (2013). Longitudinal associations between teen dating violence victimization and adverse health outcomes. Pediatrics, 131(1), 71–78. [DOI] [PMC free article] [PubMed] [Google Scholar]
- Farrell AD, King EM, White KS, & Valois RF (2000). The structure of self-reported aggression, drug use, and delinquent behaviors during early adolescence. Journal of Clinical Child Psychology, 29, 282–292. [DOI] [PubMed] [Google Scholar]
- Finkelhor D, Ormond RK, & Turner HA (2007). Polyvictimization: A neglected component in child victimization. Child Abuse and Neglect, 31, 7–26. [DOI] [PubMed] [Google Scholar]
- Foshee VA, Bauman KE, Ennett ST, Suchindran C, Benefield T, & Linder GF (2005). Prevention Science, 6(3), 245–258. [DOI] [PubMed] [Google Scholar]
- Foshee VA, Gottfredson NC, Reyes HLM, Chen MS, David-Ferdon C, Latzman NE, ... & Ennett ST (2016). Developmental outcomes of using physical violence against dates and peers. Journal of Adolescent Health, 58(6), 665–671. [DOI] [PMC free article] [PubMed] [Google Scholar]
- Foshee VA, Reyes HLM, Gottfredson NC, Chang LY, & Ennett ST (2013). A longitudinal examination of psychological, behavioral, academic, and relationship consequences of dating abuse victimization among a primarily rural sample of adolescents. Journal of Adolescent Health, 53(6), 723–729. [DOI] [PMC free article] [PubMed] [Google Scholar]
- Foshee VA (1996). Gender differences in adolescent dating abuse prevalence, types and injuries. Health Education Research, 11(3), 275–286. [Google Scholar]
- Garthe RC, Sullivan TN, & Behrhorst KL (2018). A latent class analysis of early adolescent peer and dating violence: associations with symptoms of depression and anxiety. Journal of Interpersonal Violence. [DOI] [PubMed] [Google Scholar]
- Gruber JE, & Fineran S (2008). Comparing the impact of bullying and sexual harassment victimization on the mental and physical health of adolescents. Sex Roles, 59(1–2), 1–13. [Google Scholar]
- Hamby S & Grych J (2013). The web of violence: Exploring connections among different forms of interpersonal violence and abuse. New York: Springer. [Google Scholar]
- Hamilton SF, Hamilton MA, & Pittman K (2004). Principles of youth development In Hamilton SF and Hamilton MA (Eds), The youth development handbook: Coming of age in American communities (pp. 3–22). Thousand Oaks; SAGE Publications. [Google Scholar]
- Haynie DL, Farhat T, Brooks-Russell A, Wang J, Barbieri B, & Iannotti RJ (2013). Dating violence perpetration and victimization among US adolescents: prevalence, patterns, and associations with health complaints and substance use. Journal of Adolescent Health, 53(2), 194–201. [DOI] [PMC free article] [PubMed] [Google Scholar]
- Haynie DL, Nansel T, Eitel P, Crump AD, Saylor K, Yu K, & Simons-Morton B (2001). Bullies, victims, and bully/victims: Distinct groups of at-risk youth. The Journal of Early Adolescence, 21(1), 29–49. [Google Scholar]
- Holt MK & Espelage DL (2005). Social support as a moderator between dating violence and depression/anxiety among African American and Caucasian adolescents. School Psychology Review, 34(3), 309–328. [Google Scholar]
- Johnson MP, & Leone JM (2005). The differential effects of intimate terrorism and situational couple violence: Findings from the National Violence Against Women Survey. Journal of Family Issues, 26(3), 322–349. [Google Scholar]
- Kann L, McManus T, Harris WA, Shanklin SL, Flint KH, Hawkins J, … Zaza S (2016). Youth Risk Behavior Surveillance—United States, 2015. MMWR Surveillance Summaries, 65(6), 1–174. [DOI] [PubMed] [Google Scholar]
- Leadbeater BJ, Blatt SJ, & Quinlan DM (1995). Gender-linked vulnerabilities to depressive symptoms, stress, and problem behaviors in adolescents. Journal of Research on Adolescence, 5(1), 1–29. [Google Scholar]
- Levesque DA, Johnson DL, Welch CA, Prochaska JM, Paiva AL (2016). Teen dating violence prevention: Cluster randomized trial of Teen Choices, an online stage-based program for healthy, non-violent relationships. Psychology of Violence, 6(3), 421–432. [DOI] [PMC free article] [PubMed] [Google Scholar]
- Maschi T, Morgen K, Bradley C, & Hatcher SS (2008). Exploring gender differences on internalizing and externalizing behavior among maltreated youth: Implications for social work action. Child and Adolescent Social Work Journal, 25(6), 531–547. [Google Scholar]
- Moody J (2000). SPAN: SAS Programs for Analyzing Networks. University of North Carolina at Chapel Hill. [Google Scholar]
- Moore SE, Norman RE, Sly PD, Whitehouse AJ, Zubrick SR, & Scott J (2014). Adolescent peer aggression and its association with mental health and substance use in an Australian cohort. Journal of Adolescence, 37(1), 11–21. [DOI] [PubMed] [Google Scholar]
- Nahapetyan L, Orpinas P, Song X, & Holland K (2014). Longitudinal association of suicidal ideation and physical dating violence among high school students. Journal of Youth and Adolescence, 43(4), 629–640. [DOI] [PubMed] [Google Scholar]
- Petersen AC, Schulenberg JE, Abramowitz RH, Offer D, & Jarcho HD (1984). A self-image questionnaire for young adolescents (SIQYA): Reliability and validity studies. Journal of Youth and Adolescence, 13(2), 93–111. [DOI] [PubMed] [Google Scholar]
- Reyes HLM, Foshee VA, Chen MS, & Ennett ST (2017). Patterns of dating violence victimization and perpetration among Latino youth. Journal of Youth and Adolescence, 46(8), 1727–1742. [DOI] [PMC free article] [PubMed] [Google Scholar]
- Reyes HLM, Foshee VA, Chen MS, & Ennett ST (2018). Patterns of adolescent aggression and victimization: Sex differences and correlates. Journal of Aggression, Maltreatment & Trauma. 10.1080/10926771.2018.1466843 [DOI] [PMC free article] [PubMed] [Google Scholar]
- Reynolds CR, & Richmond BO (1979). Factor structure and construct validity of ‘What I think and feel’: The revised children’s manifest anxiety scale. Journal of Personality Assessment, 43(3), 281–283. [DOI] [PubMed] [Google Scholar]
- Sterba SK (2014). Handling missing covariates in conditional mixture models under missing at random assumptions. Multivariate Behavioral Research, 49(6), 614–632. [DOI] [PubMed] [Google Scholar]
- Thompson MP, Kingree JB, Desai S (2004). Gender Differences in Long-Term Health Consequences of Physical Abuse of Children: Data From a Nationally Representative Survey. American Journal of Public Health, 94(4), 599–604. [DOI] [PMC free article] [PubMed] [Google Scholar]
- Waasdorp TE, Baker CN, Paskewich BS, & Leff SS (2013). The association between forms of aggression, leadership, and social status among urban youth. Journal of Youth and Adolescence, 42(2), 263–274. [DOI] [PMC free article] [PubMed] [Google Scholar]
- Wasserman S & Faust K (1994). Network Analysis. Cambridge, England: Cambridge University Press. [Google Scholar]
- Wolke D, & Lereya ST (2015). Long-term effects of bullying. Archives of Disease in Childhood, 100(9), 879–885. [DOI] [PMC free article] [PubMed] [Google Scholar]
- Whiteside LK, Ranney ML, Chermack ST, Zimmerman MA, Cunningham RM, & Walton MA (2013). The overlap of youth violence among aggressive adolescents with past-year alcohol use—A latent class analysis: Aggression and victimization in peer and dating violence in an inner-city emergency department sample. Journal of Studies on Alcohol and Drugs, 74(1), 125–135. [DOI] [PMC free article] [PubMed] [Google Scholar]
- Vermunt JK (2010). Latent class modeling with covariates: Two improved three-step approaches. Political Analysis, 18(4), 450–469. [Google Scholar]