Abstract
Optical coherence tomography (OCT) and scanning laser ophthalmoscopy (SLO) are complementary imaging modalities, the combination of which can provide clinicians with a wealth of information to detect retinal diseases, monitor disease progression, or assess new therapies. Adaptive optics (AO) is a tool that enables correction of wavefront distortions from ocular aberrations. We have developed a multimodal adaptive optics system (MAOS) for high resolution multifunctional use in a variety of research and clinical applications. The system integrates both OCT and SLO imaging channels into an AO beam path. The optics and hardware were designed with specific features for simultaneous SLO/OCT output, for high fidelity AO correction, for use in humans, primates, and small animals, and for efficient location and orientation of retinal regions-of-interest. The MAOS system was tested on human subjects and rodents. The design, performance characterization, and initial representative results from the human and animal studies are presented and discussed.
Introduction
Scanning laser ophthalmoscopy (SLO) and optical coherence tomography (OCT) are important clinical imaging modalities in ophthalmology [1, 2]. SLO is a more traditional imaging technique where scanning light scattered back from the eye is detected to produce en-face images. The SLO uses a confocal arrangement to provide contrast enhancement via rejection of scattered light, as well as moderate depth sectioning (determined by the confocal range gate), which in the eye is ~200–300 µm, or roughly the thickness of the retina. Fluorescence detection of emitted retinal fluorophores adds the capability to discriminate molecular constituents [3, 4]. OCT is an interferometric approach that yields exceedingly good axial resolution (< 10 µm) compared to traditional imaging techniques like fundus photography or SLO. The output of OCT is generally a cross-sectional B-scan (width vs. depth), and B-scans can be accumulated into a three-dimensional volume (C-scan) for viewing in any orientation. OCT is not amenable to fluorescence detection because of the heterodyne nature of the low coherence signal detection (i.e., requirement for coherent spectral interference).
Both OCT and SLO have recently been aided by adaptive optics (AO), which senses and compensates for sample wavefront distortion [5–11]. AO improves lateral resolution and depth-of-focus to near diffraction-limited focus. Recent progress includes mapping the rod photoreceptor mosaic [12], imaging and tracking blood cell dynamics in the foveal capillary ring [13, 14], in vivo two-photon AO imaging [15], and measurement of cone reflectance fluctuations with respect to the diurnal cycle [16–17].
SLO and OCT are currently complementary techniques. OCT integrated slices that mimic SLO en-face scans can be re-created from OCT data cubes only at low resolution in the absence of eye motion, or with methods to correct eye motion [18]. Increases in Fourier domain OCT device acquisition speeds may eventually allow entire OCT data cubes to be collected and processed at video rates (~tens of Hz). High speed, high resolution OCT data cubes will provide identical information as SLO images only as long as high signal-to-noise ratios (SNR) can be achieved at the low integration times necessary for high-speed OCT and the target (e.g., photoreceptor, retinal pigment epithelium cell) can be discriminated in the presence of speckle, a coherent phenomenon that limits OCT resolution. Collecting a data cube with 500×500 lateral pixels at 15 cubes per second (cps) requires a 3.75 MHz line rate and a 0.26-µs integration time. Reduction of line rates down to currently achievable rates of 100–200 kHz means a reduction in either the number of lateral pixels (e.g., 100×100 at 15 cps) or the data cube rate (e.g., 500×500 at 0.6 cps). Image averaging, which requires multiple scans and longer overall acquisition times, is the customary manner to reduce the influence of speckle and other noise sources. If and until OCT technology becomes rapid enough to acquire high resolution data cubes at video rates, SLO and OCT will provide different retinal views, a capability which we can exploit.
Though speckle, SNR, confocality, and scattering all play a role in the relative appearance of OCT or SLO images of the same target, another important factor is the scanning orientation with respect to the target, largely because of lateral eye motion. AOSLO is able to produce images of the cone photoreceptor mosaic with relatively ease at modest acquisition rates because of the orientation of the target in the same plane as the fast scanning axis. AO-OCT only recently achieved this for smaller retinal patches with high-speed or transversal scanning approaches [10, 11, 17]. Likewise, measurement of retinal layer thickness in the presence of high levels of eye motion is relatively robust because the layer thickness gradients are small in the slow scanning transverse axes. Conversely, when a retinal target has an edge that is perpendicular to the slow scanning axes (e.g., vessels, ONH margin, etc.), motion errors can be more problematic.
SLO and OCT have been combined before in the same multimodal instrument [19–20], most notably in the Heidelberg Spectralis [21], which exploits the additional information to serve such functions as eye tracking, in combination with (auto-) fluorescence, SLO, and OCT. We have previously configured an adaptive optics system with OCT and SLO channels, though because the OCT channel used a swept source approach, SLO/OCT synchronization was more difficult and simultaneous imaging was not performed [22]. The optical design for the current system is built upon, and follows from, designs and features of previously reported systems [23, 24]. The novelty of the design reported in this paper is the adaptation for simultaneous SLO/OCT imaging, the use of multiple beam configurations, as well as enhancements in timing and processing. What remains constant from the previous multimodal AO system development and implementation are the backbone of the original optical layout, with wide field ocular access, woofer-tweeter configuration, and full integration of line scanning ophthalmoscope (LSO) [25] and retinal tracker (RT) [26].
The instrument we have developed, called the multimodal adaptive optics system (MAOS), was designed for a variety of research and clinical uses, including human subject testing for disease diagnosis and quantification of structural characteristics associated with small animal models [27]. We describe the system design and configuration – with specific emphasis on new features and upgrades, present measurements on humans and small animals to demonstrate system performance, and discuss some design trade-offs and other limitations for particular applications. MAOS is a powerful tool for high resolution interrogation of the human and animal retina and its diseases and abnormalities.
Materials and Methods
Optics
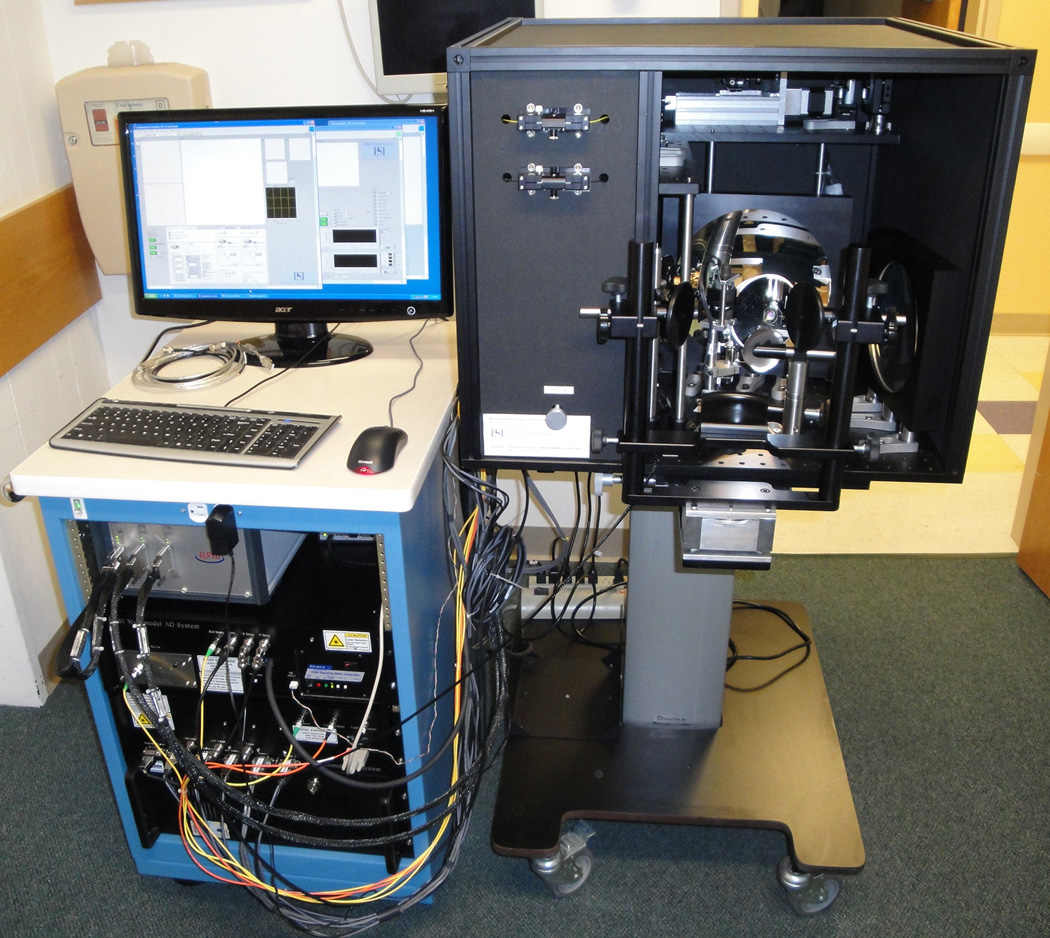
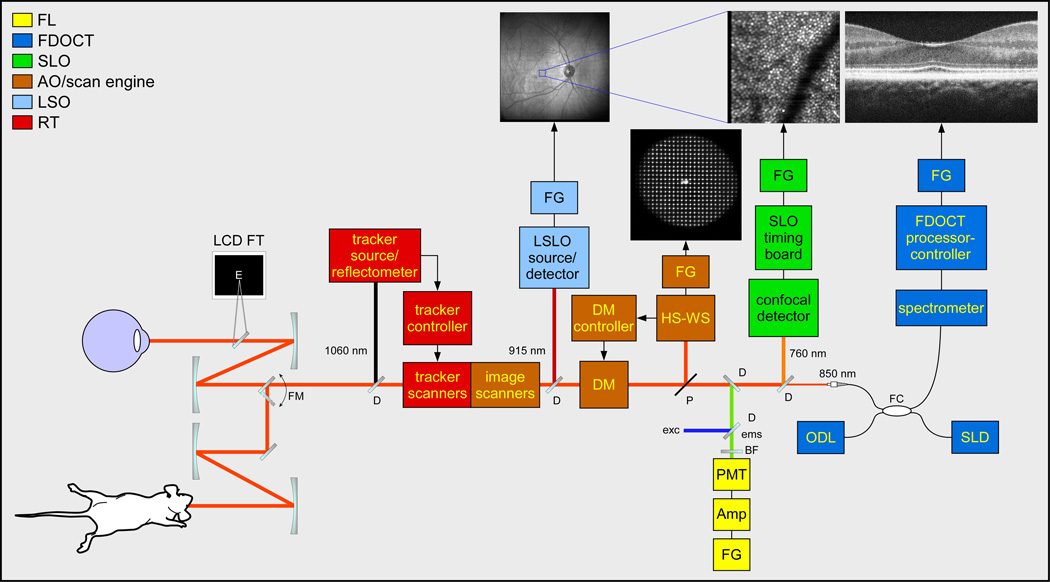
The multimodal adaptive optics system was designed with several functional constraints. First and foremost, the instrument had to be clinical portable. This means some necessary trade-offs in terms of system and patient stability and the potential use of motion mitigation gear (e.g., bite bars, etc.). The MAOS imager contains all optics on a relatively small table tethered to a half-height instrumentation cart (Fig. 1). Second, the system was designed to acquire AO-SLO and AO-OCT videos simultaneously. The design challenge to achieve this was made easier by the fact that the OCT channel was spectrometer-based rather than previous swept source-based designs [22] and thus had considerably more timing configurability. Simultaneous SLO/OCT imaging was achieved by moving the SLO resonant scanner (RS) to the last pupil conjugate before the detection arms and with the introduction of the OCT beam proximal to this conjugate. Third, the system was designed to image human subjects in pre-clinical or clinical studies and animal subjects, particularly small animals such as rodents, in research studies. This was accomplished with a novel optical arrangement whereby a single optical relay is switched to change the output beam diameter from 7.5 mm useful for imaging humans and other primates to 2.5 mm useful for imaging rodents. The functional block diagram for the system is shown in Fig. 2. This is similar to the functional diagram presented previously [22], though some key differences are highlighted in the brief description that follows. MAOS includes a wide-field line scanning ophthalmoscope (LSO) and retinal tracker (RT), which enhance clinical capability. As these components have been extensively reported, including for similar integration into alternate AO systems [22–26], their design and performance will not be discussed beyond a cursory description below.
Fig. 1.
Photograph of the Multimodal Adaptive Optics System.
Fig. 2.
MAOS retinal imager functional block diagram. LCD FT: simulus/fixation target, FM: flip mount, D: dichroic beamsplitter, FG: framegrabber, DM: deformable mirror, HS-WS: Hartmann-Shack wavefront sensor, P: pellicle beamsplitter, PMT: photomultiplier tube, Amp: pre-amp, BF: barrier filter, exc/ems: excitation/emission light, FC: fiber coupler, ODL: optical delay line, SLD: superluminescent diode. Standard wavelength set is shown; other versions with alternate wavelength sets have been built.
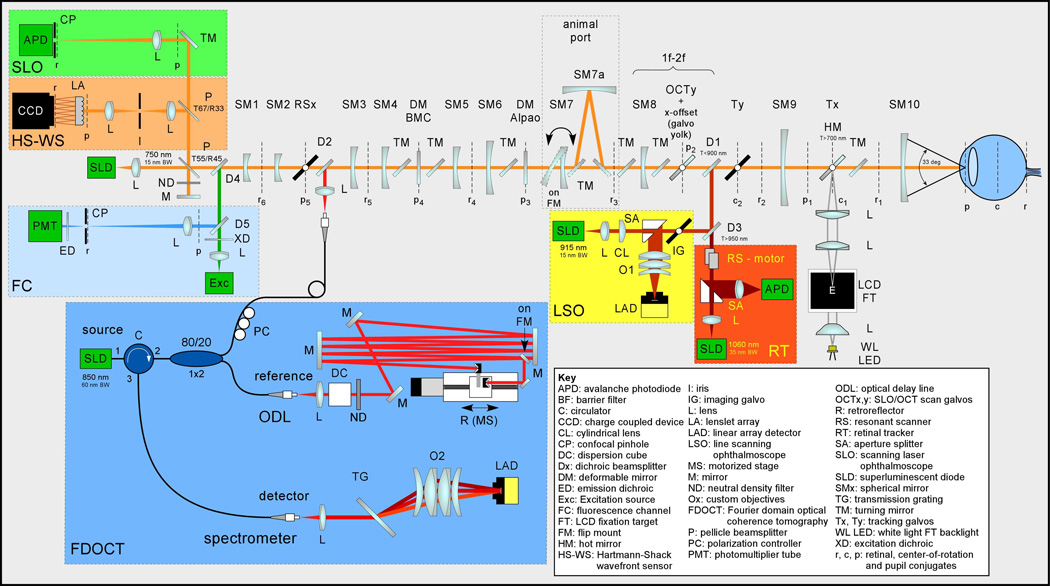
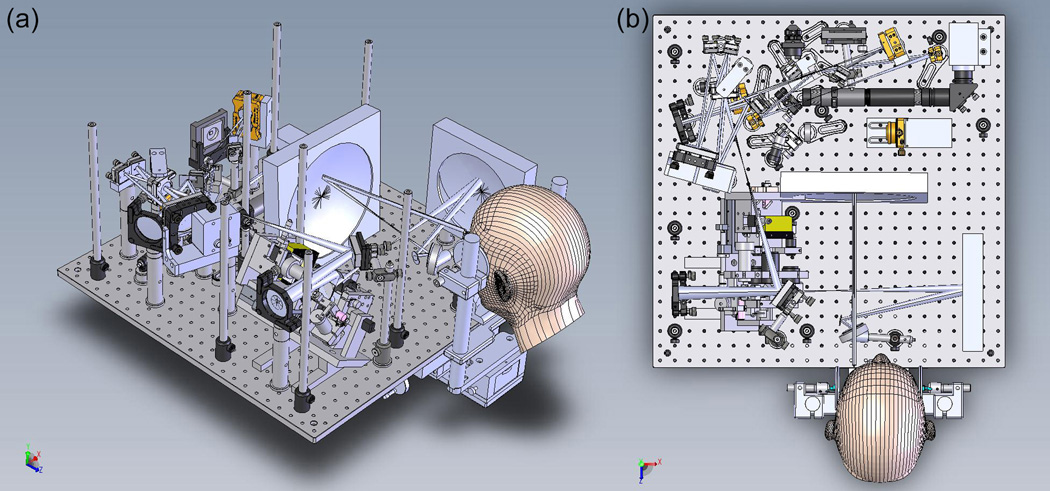
The unfolded optical setup for MAOS is shown in Fig. 3. Figure 4 shows the opto-mechanical model: Zemax optical ray-trace model imported into SolidWorks mechanical model, which was used during system construction. While the standard wavelength set is shown (SLO: 760 nm, OCT: 850 nm, LSO: 950 nm, RT: 1050 nm), other alternate sets have been designed and deployed clinically for specific applications. For example, one system uses an OCT source at 1050 nm for enhanced penetration into the choroid [28]. This set also has the added benefit that LSO images acquired at 850 nm have significantly improved performance compared to those acquired at 950 nm due to proximity to water absorption lines and detector peak sensitivity.
Fig. 3.
Unfolded optical schematic for the MAOS imager.
Fig. 4.
Integrated Solidworks-Zemax opto-mechanical model of MAOS. (a) Isometric view. (b) Top view. Small platforms mounted above the main optical table for the OCT optical delay line and spectrometer are not shown. Fluorescence detection channel is not included in this version.
The primary optical beam path consists of ten spherical mirrors to relay pupil and retinal conjugates to appropriate components. All moving elements (scanners, deformable mirrors) are placed at pupil conjugates. All detectors are placed at retinal conjugates. The LSO and RT are integrated into the primary beam path in front of the AO and scanning components but behind the front mirror relay (SM9 and SM10) that provides wide field optical access to the eye.
The AO components include two deformable mirrors (DM) and a Hartmann-Shack wavefront sensor (HS-WS). The DMs are configured in a woofer-tweeter arrangement, with a high actuator count mirror (Boston Micromachines Inc.) for high-order aberration correction and a high stroke mirror (Alpao or Imagine Eyes Mirao) for correction of larger lower-order aberrations. The HS-WS is comprised of a lenslet array and CCD camera (Uniq Vision Inc.). A lens relay is used in front of the HS-WS to block reflections from out-of-plane objects (e.g., the cornea). The HS-WS is calibrated to a reference wavefront (plane wave) generated on the backside of the first beamsplitter. The reference wavefront is directed to the HS-WS with a mirror and attenuated with an ND filter. Alternately, a point source at a known distance can be directed into the optical setup through this beamsplitter. Both approaches have been used with approximately equal effectiveness for WS calibration, though re-directing the reflection of the input imaging beam light back into the WS requires careful management of its Gaussian beam profile, which is superimposed on the spot pattern.
The SLO reflectance image is generated with a confocal pinhole and an APD detector. The SLO fluorescence channel includes filters (XD, ED) and a dichroic beamsplitter (D4) to direct visible excitation light to the retina and collect visible emission light from the retinal fluorophores (e.g., A2E in lipofuscin). A photomultiplier tube (PMT) is used for detection. The SLO reflectance and fluorescence channels typically have the same sized pinhole, though a large pinhole can be used in the fluorescence channel to detect the weak retinal fluorescence signals (e.g., retinal autofluorescence). The FDOCT channel includes fiber interferometer (circulator and 1×2 coupler), optical delay line (ODL), and transmission grating-based spectrometer. An LCD fixation target allows flexible presentation of a variety of static or dynamic targets to the subject.
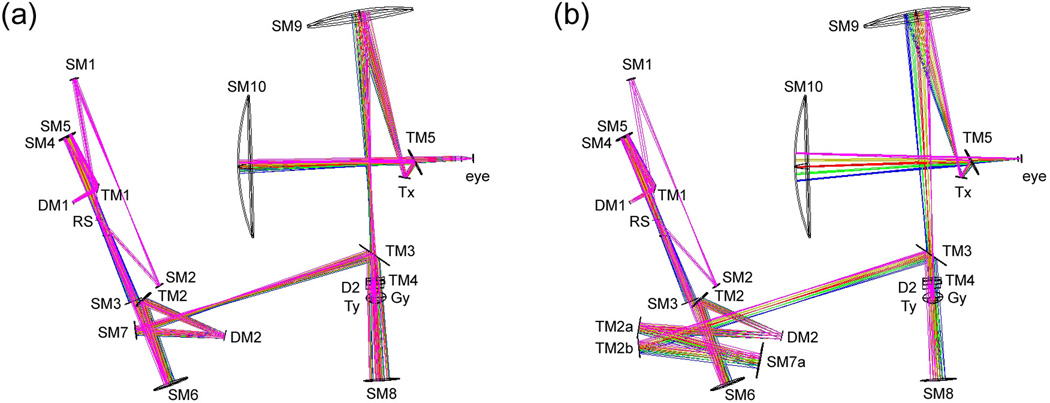
The MAOS optics include two beam configurations, the optical models of which are shown in Fig. 5. The first configuration (Fig. 5a) uses SM7 for illumination source magnification. This produces a 7.5-mm output beam diameter at the pupil for short depth-of-focus (DOF) adaptive optics imaging in humans and large primates. The second configuration (Fig. 5b) uses SM7a, with a 3× larger radius of curvature, to produce a 2.5-mm output beam diameter at the pupil. This configuration can be used to image smaller animals such as rodents. Alternatively, the second configuration can be used in humans to produce longer DOF imaging, which may be more useful for certain OCT imaging applications. To easily switch between configurations without re-alignment, SM7 is mounted on a flip mount. When flipped up, the beam is directed to SM7a with a pair of turning mirrors (TM2a and TM2b) to accommodate its 3-fold increase in path length. In order to compensate for the change in sample path length, a mirror mounted to a second flip mount is added to the delay line to create two OCT reference path lengths for the two configurations (see Fig. 3).
Fig. 5.
Zemax optical model illustrating large (a) and small (b) beam diameter configurations. SM7 is affixed to a flip mount and removed from the beam path to access the alternate TM2a/SM7a path.
Instrumentation, Scanning, and Timing
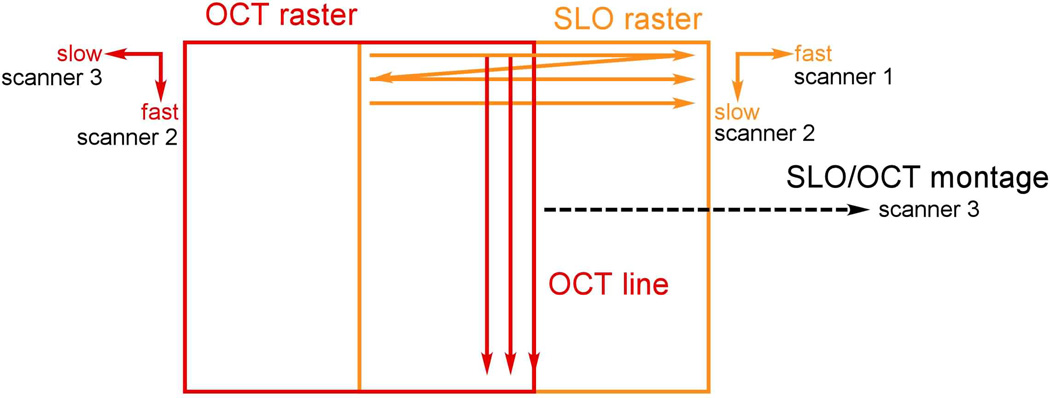
As introduced above, simultaneous SLO/OCT imaging is achieved with a unique ordering of optical elements in the primary beam path, whereby the high speed SLO RS is placed at the last pupil conjugate. The OCT beam is introduced in front of the RS and both beams use the same two scanners to produce images and offsets for raster or montage generation as shown in Fig. 6. The high-speed SLO horizontal scan is created with the RS. The SLO and OCT vertical scans are created with a galvanometer (the SLO slow axis is the OCT fast axis). The OCT B-scan line is aligned (optically) to the center of the SLO raster. An OCT raster and SLO montage are created simultaneously with a second galvanometer. Because the drive waveform for this scanner requires lower rates for slow scanning and thus can accommodate a larger mass, we have designed a yolk assembly to mount the first galvanometer to the second, thereby pivoting in both axis with a single mirror. (Dual axis scanning mirrors exist but the angular range is more limited than required here.) This scanning arrangement locks the SLO image and OCT B-scan rates, which has the advantage that the SLO and OCT images are always perfectly registered to the same retinal location, even in the presence of eye motion. However, this necessarily slows down the OCT frame rate below maximum achievable rates for most linear detectors, even when the SLO fly-back is used as described below.
Fig. 6.
Simultaneous SLO/OCT scanning arrangement. The fast SLO scanner 1 is a resonant scanner. Scanners 2 and 3 are galvanometers. The SLO raster and OCT line are created simultaneously with scanner 2, as are the OCT raster and SLO montage with scanner 3.
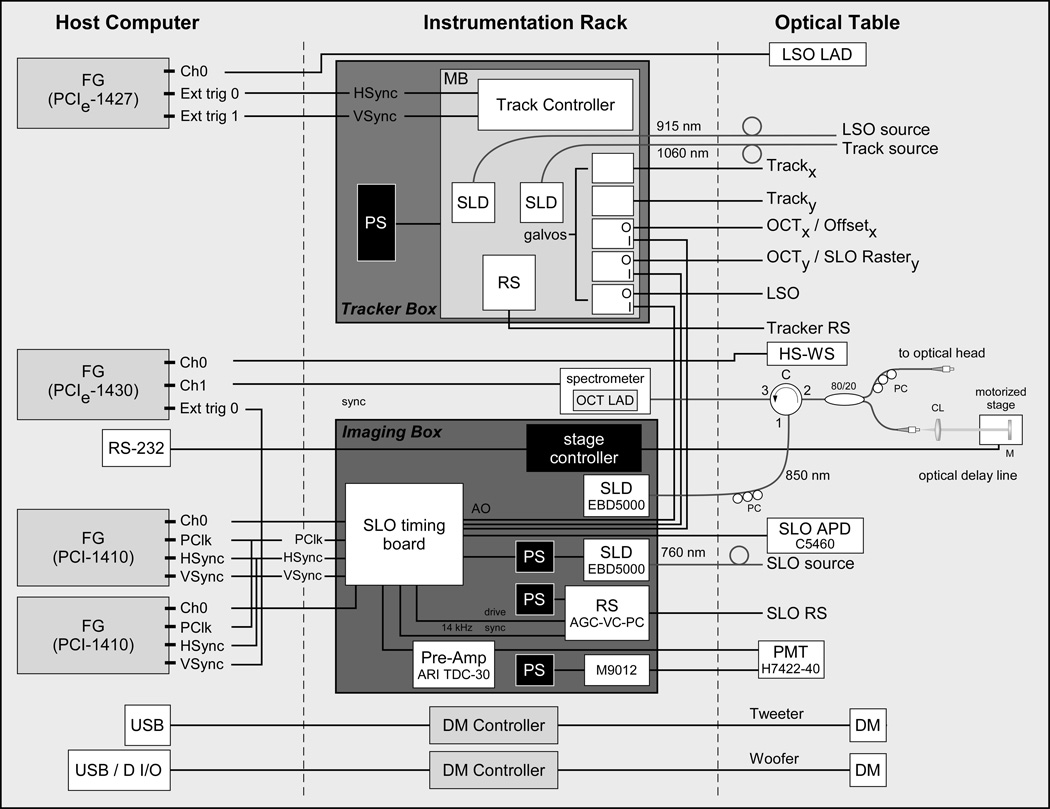
The instrumentation layout, similar to that used in other systems, is shown in Fig. 7, and most components are described elsewhere [21–25]. Briefly, the instrumentation is composed of 3–4 framegrabbers depending upon whether a fluorescence channel is included, two electronics boxes, and the DM controllers, which are controlled from the computer with USB interface (except when configured for the Alpao DM, which uses an Adlink digital I/O board to drive the DM). The instrumentation includes three custom electronics boards designed and built by PSI for tracker closed-loop control, tracker system interface, and SLO timing. One instrumentation box houses all the RT hardware, including sources, galvanometers, and tracker dual-axis resonant scanners. The other instrumentation box houses the SLO and OCT imaging hardware, including OCT stage controller, SLO RS, SLO source, and fluorescence channel PMT drive electronics. The SLO timing board generates waveforms and timing signals for all the hardware, including non-linear pixel clock (for automatic SLO image dewarping) and blanking signals for the SLO analog framegrabber, galvanometer waveforms, and voltage signals to control the SLO image size (i.e., RS amplitude), SLO and OCT beam power, and the PMT gain via computer interface [21].
Fig. 7.
MAOS instrumentation diagram. See text or Figs. 2–3 for abbreviations.
MAOS timing and processing upgrades include operation at double-speed SLO/OCT rates (i.e., using SLO forward and fly-back scans for imaging), graphical processor unit (GPU) OCT processing (including phase), and GPU wavefront sensor centroiding.
The SLO RS used in this system has a resonant frequency of ~14.5 kHz, and SLO images (1000×1024 pixels) are created using the forward and fly-back sweeps at ~28 Hz. Double rate waveforms and timing signals from the SLO timing board are used so that the vertical galvanometer steps twice for each SLO cycle and the OCT camera operates at twice the line rate (~29 kHz). Each OCT B-scan has 1024 A-scans. The LSO and WS camera timing is also driven from the SLO timing board and so the SLO (both reflectance and fluorescence images), OCT, LSO, and WS images are all synchronized at ~28 Hz. The system can also be easily adjusted to image strips (by varying the SLO RS amplitude), other pixel dimensions, etc., though the SLO image height always matches the number of OCT A-scans in a B-scans (that is, the OCT image width). Because linear detectors are currently available that have maximum line rates that exceed 100 kHz, the potential also exists to configure the OCT channel to over-sample the SLO image (e.g., collect 5–10 A-scans for every SLO horizontal sweep). This could be used, for example, to perform real-time averaging for speckle reduction or to collect OCT strips for greater coverage of the region of interest in the presence of eye motion. To accomplish this requires re-configuration of the OCT scanner and camera timing waveforms, which is the subject of a future investigation.
The OCT processing chain and the wavefront sensor spot centroiding are both performed simultaneously on a graphical processor unit (GPU) video card (NVIDIA family) operating on the CUDA computing platform. The GPU processing replaced the FPGA-based OCT processing board previously developed, while the processing steps are otherwise identical [29]. OCT images with 1024 A-scans can be processed on the GPU in ~5 ms for potential frame rates exceeding 200 fps. Moreover, OCT phase images can also be created simultaneously with only an additional 2–3 ms processing time per frame. Thus the OCT processing and display rate are limited by the linear detector (or system image acquisition) speed alone. The wavefront sensor spot centroiding is performed on the GPU in order to increase AO closed loop rates to just under the WS frame rate of 28 fps. Moving a large portion of the OCT and WS processing from the CPU to the video card GPU also conserves system resources for other functionality related to collection, processing, and saving videos from all four (five if the fluorescence channel is included) imaging channels. The video card also drives two system high definition monitors and the LCD-based fixation target.
Human and Animal Subjects
Data from a small number of human and animal subjects is presented to illustrate system capabilities. A study was approved by the Investigation Review Board at Children's Hospital Boston (CHB) to image subjects with a history of retinopathy of prematurity (ROP) and control subjects. Data from only the control subjects with no retinal disease is presented. Tropicamide (1%) was administered to one or both eyes of the subjects for pupil dilation and accommodation paralysis. In some tests a bite bar was used. An LCD-based fixation target is projected to the retina collinear to and parfocal with the imaging beams.
Sprague-Dawley albino rats were used in several different studies and only the results of a few are presented to demonstrate the secondary beam configuration. Before all experimental procedures, the animals were anesthetized with an intraperitoneal injection of ~75 mg/kg ketamine and 10 mg/kg xylazine and their pupils dilated with a combination of 2.5% phenylephrine hydrochloride and 1% cyclopentolate hydrochloride. All procedures in this study were approved by the Animal Care and Use Committee at CHB and were performed in accordance with the ARVO Statement for the Use of Animals in Ophthalmic and Vision Research.
Imaging Procedure
The multimodal AO system provides adjustable scanning parameters for imaging human and animal subjects. The horizontal axis of the SLO raster scan is adjustable from 0.5 deg. to 3 deg., while the SLO vertical axis (and OCT B-scan length) can be adjusted up to the size of the front-end optics (~33 deg.), which is also the size of the LSO image. In the normal mode of operation, SLO raster scans and OCT B-scans are continuously acquired at one retinal eccentricity. In the montage or scanning mode, the SLO raster scan is panned across the retina, also producing an OCT raster scan made up of individual B-scans. Fly-back and snake scanning schemes are used for montage mode.
In a typical imaging session, the pupil of the subject is aligned to the instrument using the LSO and HS-WS images, then the AO and RT control loops are initiated (if using AO compensation and actively tracking, respectively), and then the SLO, OCT, LSO, and HS-WS videos are acquired simultaneously. The imaging protocol depends upon the study but may include a larger raster scan of the macula (10×10 deg.), followed by smaller raster scans (2×2 deg.) at various eccentricities or centered on various retinal targets.
Results
The multimodal AO system can be flexibly configured for large scans to map the macula or small scans to resolve retinal cells such as photoreceptors. Several smaller scans (1 and 2 deg.) from different retinal targets of human subjects are shown in Fig. 8. Figure 8(a) shows a 1-deg. scan across the fovea where the cone density is highest and the cone diameter is smallest. Figures 8(b) and (c) show scans with predominantly cone photoreceptors at approximately the same 5-deg. eccentricity. A 1-deg. scan with a mixture of rods and cones at ~10-deg. eccentricity is shown in Fig. 8(d). The MAOS was not optimized to resolve rod photoreceptor, particularly in terms of light collection efficiency, which is necessarily degraded with the inclusion of OCT, LSO, and RT channels, and pinhole size with respect to the Airy disc size (i.e., confocality). Rod photoreceptors could not be resolved in all subjects. Nevertheless, their resolution in some subjects demonstrates reasonable AO performance for many research and clinical applications. In Fig. 8(e), the woofer focus was pulled up to the nerve fiber layer, where individual fibers could be resolved within the bundle.
Fig. 8.
High resolution AOSLO retinal images from the multimodal AO retinal imager. (a) 1-deg. fovea scan (Note the dense cone packing in the fovea, lower left), (b) 2-deg. macular scan at ~5-deg. eccentricity, (c) 1-deg. macular scan at ~5-deg. eccentricity, (d) 1-deg. scan at ~10 deg. eccentricity showing a mixture of cones and rods, and (e) 2 deg. scan of nerve fibers and bundles (focus pulled to inner retina).
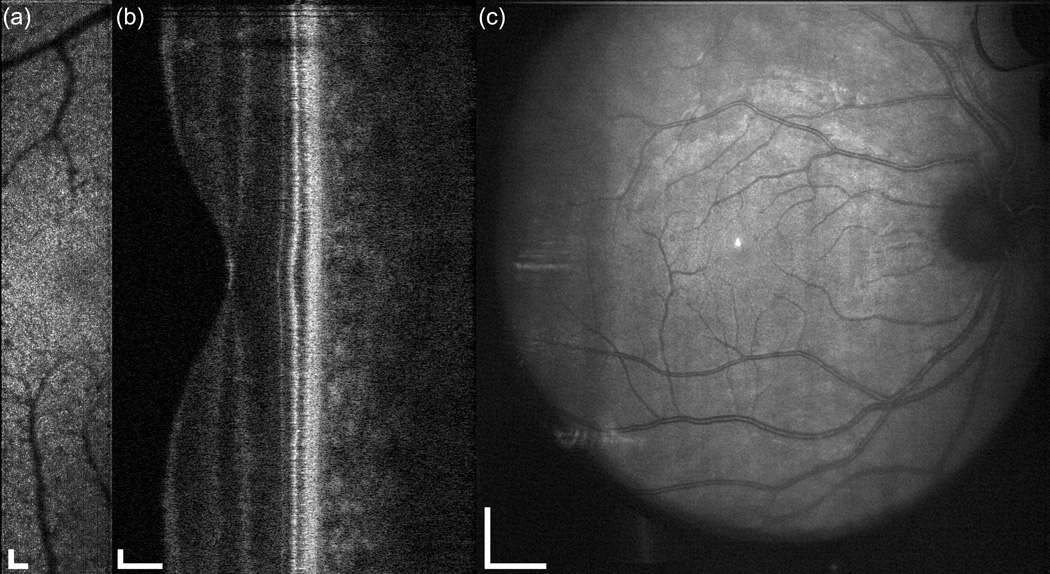
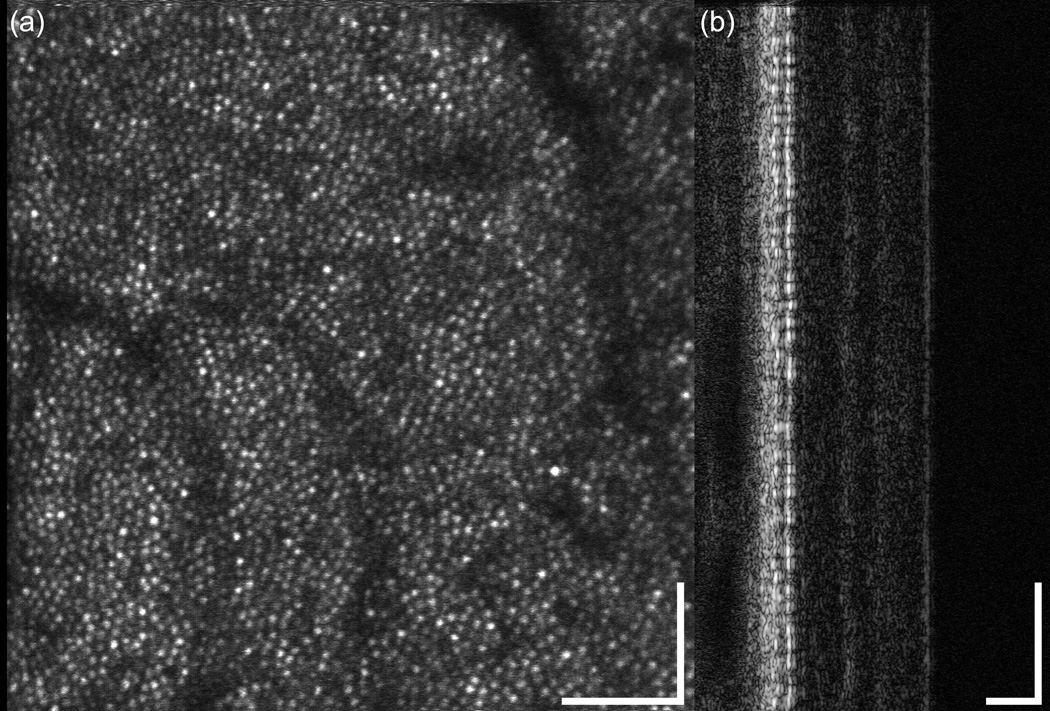
The multimodal AO system output includes SLO, OCT, LSO, and HS-WS videos. The HS-WS videos are generally examined only to determine the quality of the AO correction. However, the other three imaging channels together provide a significant amount of information for the clinician/researcher. In Fig. 9 and the accompanying video, the scan was configured for 10 deg. along the vertical axis and 2 deg. in the horizontal axis for the SLO channel. The OCT raster size was set to 10 deg. Figure 9 shows a single frame from the raster video. Because a small fraction of the OCT return light reflects off of the dichroic beamsplitter (D1 in Fig. 3), the OCT beam can be seen in the LSO image (Fig. 9c). The OCT beam appears stationary as a spot rather than a line in the LSO image because the two channels are synchronous. Figure 10 shows the stitched montage of scanned frames from the SLO output shown in Fig. 9. This scan type shown in Figs. 9–10 is meant as a screening tool: while individual cone photoreceptors can be resolved, the mosaic is not clear enough to map density, yet the overall health of the retina and the presence or absence of irregularities can be determined. The scan size can then be easily adjusted to zoom into individual retinal patches to examine the photoreceptor mosaic or other features. In Fig. 11 and the accompanying video, the SLO scan size is set to 2 deg. square and the OCT B-scan is taken from a position corresponding to the center of the SLO raster. As previously mentioned, because they use the same beam path, the OCT and SLO scans are always perfectly registered to one another. The cone photoreceptor mosaic, which is clearly seen in the SLO (Fig. 10a), can also be resolved in the appropriate layers of the OCT B-scan.
Fig. 9.
Demonstration of simultaneous output of the multimodal AO retinal imager using larger field for a 38 year old emmetropic subject without retinal disease. (a) AOSLO, (b) AO-SDOCT, and (c) wide-field LSO images. The OCT scan length is 10 deg., the SLO field size is 2×10 deg., and the LSO image is ~30 deg. Scale bar is 100 µm for SLO and OCT and 1 mm for LSO.
Fig. 10.
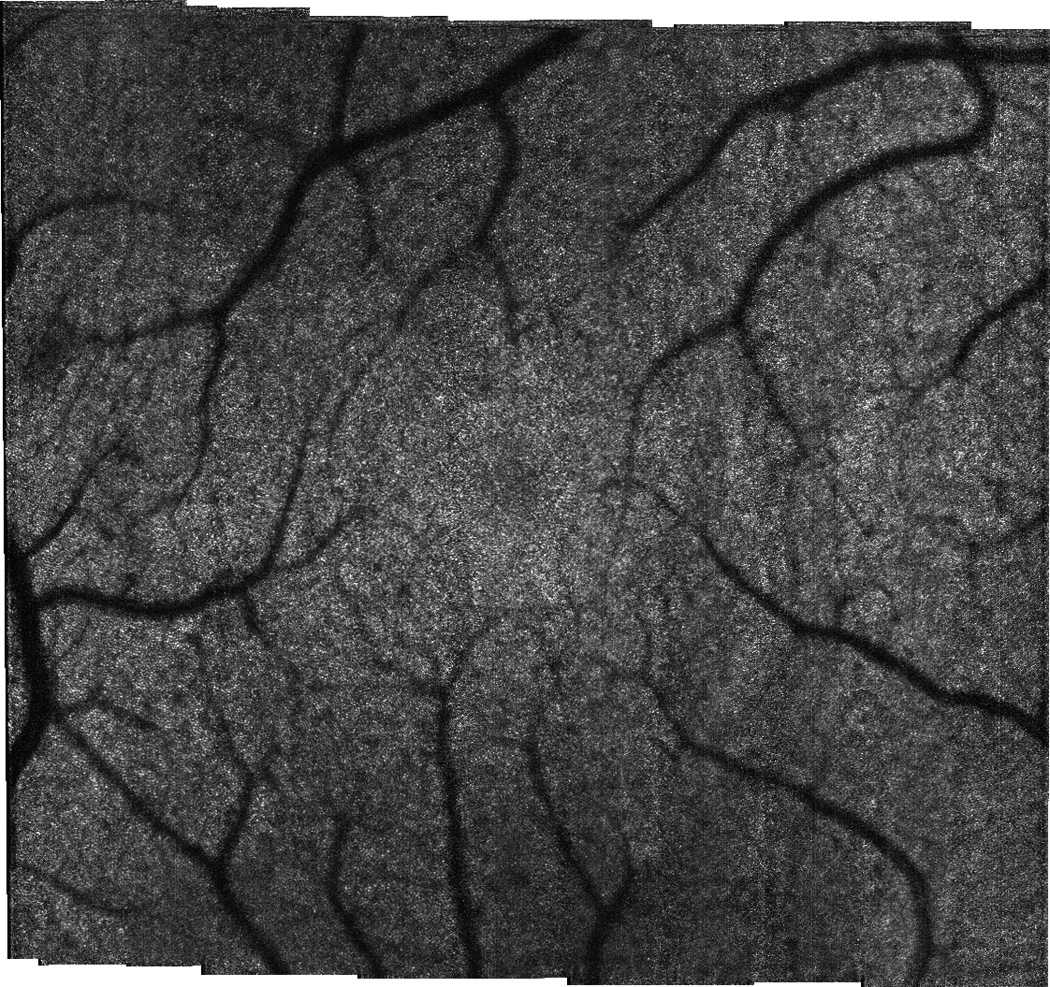
Stitched montage from 2×10 deg. scan shown in Fig. 9. Montage size is 10×10 deg.
Fig. 11.
Demonstration of simultaneous output of the multimodal AO retinal imager (for the primary AO imaging channels) for small field. (a) AOSLO, (b) AO-SDOCT. OCT scan length is 2 deg and SLO field size is 2×2 deg. Scale bar is 100 µm.
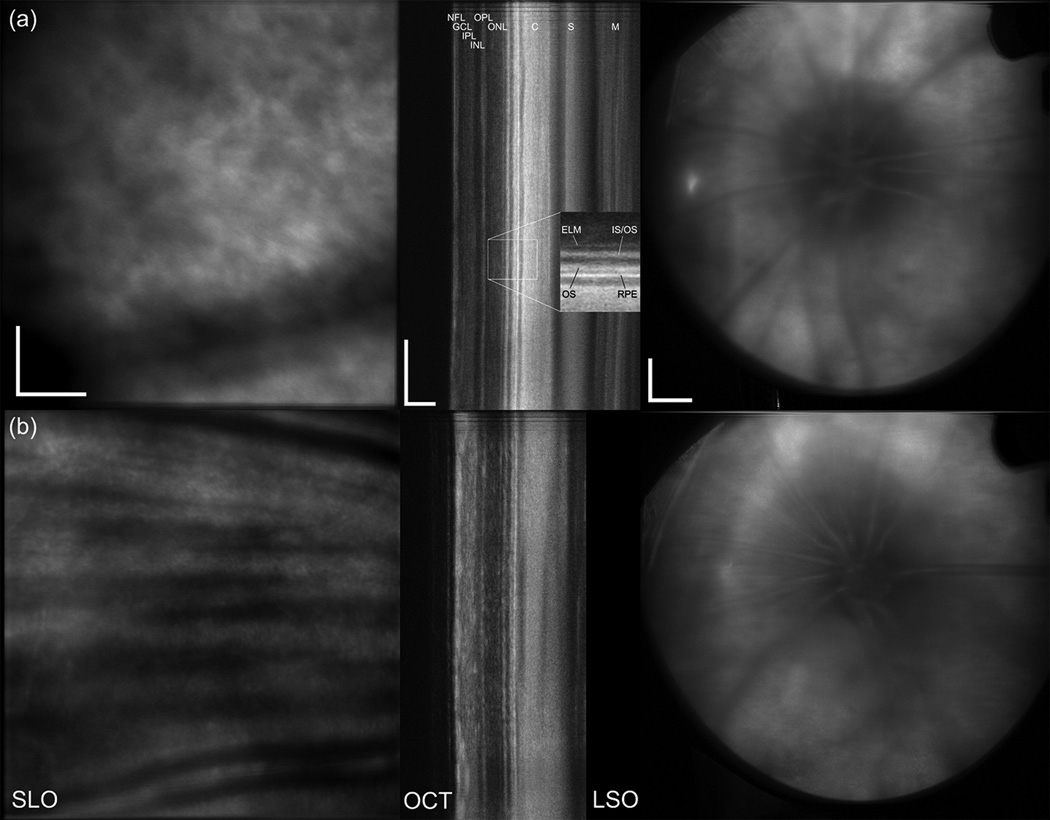
Examples of the multimodal AO output from rats are shown in Fig. 12 and the accompanying videos. The output beam diameter of the secondary port is 2.5 mm and therefore, in terms of pupil diameter, the port is better suited to mice (~1–2 mm) than rats (~4–5 mm). Also, the clarity of the cornea in the rat was often partially degraded, a side effect of the anesthesia. There also were differences in image quality between the control rats and the ROP model. For these reasons the AO correction was thought to be sub-optimal. However, the AO correction still made modest improvements in image appearance and allowed the focus to be pulled through retinal layers. The upper row (Fig. 12a) shows the output from a rat with the focus set on the photoreceptor layer. The bottom row (Fig. 12b) shows the output from a rat with the focus set on the NFL. All major retinal layers could be resolved and segmented and are indicated in Fig. 12a. Partially aided by the fact that the albino rats have no melanin in the retinal pigment epithelial (RPE) layer, the light penetration is extremely deep, and in some rats we could see through the choroid and sclera. The majority (99%) of rat photoreceptors are rods, which are apparent in the stippled pattern in Fig. 12(a). The individual photoreceptors can only be resolved in very small patches (several photoreceptors) in the SLO images of the control rats. The vessels and nerve fiber bundles can be seen in Fig. 12(b), as well as erythrocytes flowing through capillaries in the accompanying videos.
Fig. 12.
Multimodal output in albino rats. (a) System focus set to the PR/RPE complex. (b) System focus set to the NFL. Shown from left to right are the SLO, OCT, and LSO images acquired simultaneously. Scale bar is 100 µm for SLO and OCT and 1 mm for LSO. NFL: nerve fiber layer, GCL: ganglion cell layer, IPL: inner plexiform layer, INL: inner nuclear layer, OPL: outer plexiform layer, ONL: outer nuclear layer, ELM: external limiting membrane, IS/OS: inner/outer segment junction, OS: outer segments, RPE: retinal pigment epithelium, C: choroid, S: sclera, M: muscle. Inset of (a) shows 2× zoomed region of PR/RPE complex.
Discussion
The multimodal AO system is a powerful research and clinical platform for high resolution imaging of cells and fine structure in the retina. It includes simultaneous AO-corrected SLO/OCT imaging and perfect registration between modes; dual-DM operation for high fidelity AO correction; an auxiliary LSO imager for global orientation, feature identification, as well as advanced techniques such as Doppler flowmetry [27]; two pupil configurations for a variety of subject species; active retinal tracking; a fluorescence SLO channel; high-speed GPU processing of OCT and WS images; and a LCD-based fixation target. The software interface includes automated montaging and other features that enhance clinical operability.
We have demonstrated high resolution, AO-corrected imaging in both human and small animal eyes from the same device with two different imaging configurations. In humans, we imaged cone and rod photoreceptors, nerve fibers bundles, capillaries, and other targets. In rats, we resolved photoreceptors, individual nerve fiber bundles, erythrocytes flowing through capillaries and acquired OCT images with deep penetration into the sclera.
Simultaneous SLO/OCT imaging leads to perfect registration between these modes, and this can be used, for example, to precisely align A-scans (with single SLO lines) or cross-sectional B-scans (with SLO frames) to build up an OCT C-scan corrected for motion [27]. The system collects, displays, and stores SLO (1000×1024 pixels), OCT (1024×1024 pixels), LSO (1024×1024 pixels), and WS (1024×1024 pixels) videos simultaneously at ~28 Hz, where the rate is confined by the SLO resonant scanner rate, even using forward and fly-back sweeps. The MAOS A-scan rate (~29 kHz) is slower than many high-speed research OCT systems (>100 kHz), and indeed is slower than the maximum potential speed of our linear array camera. Thus in the MAOS implementation, we have slowed the OCT image speed to match the maximum SLO image speed. While this sacrifice of OCT speed may create some difficulties, most notably with respect to eye motion, it also creates new opportunities and applications. There are also potential schemes to increase OCT speed while maintaining simultaneous imaging, such as acquisition of multiple OCT lines per SLO frame.
It was particularly important to manage trade-offs in a system as complex as the MAOS. For example, to achieve optimal imaging performance in humans for rod photoreceptor mosaic imaging, we may not necessarily have chosen to add OCT/LSO channels, accommodate wide-field imaging, or design a compact optical layout. Each of these components can slightly degraded SLO performance, through loss of throughput or increased system aberrations. We made these choices because the integrated system has capabilities that far exceed a single SLO imager.
There has been considerable interest in small animal retinal imaging because of the wide availability of small animal models for human diseases. Transgenic models have been developed for many ocular diseases, including macular degeneration, glaucoma, diabetic retinopathy, and inherited retinal diseases such as retinitis pigmentosa [30–33]. Histological studies of disease progression or investigation drug therapies using small animals often require large numbers of animals to gain information on cellular changes at each time point. In vivo imaging can provide longitudinal information on disease progression or regression without using a large numbers of animals and their associated sources of statistical susceptibility.
Because the rodent eye has one of the highest numerical apertures of any mammal (up to ~0.5), it has the potential to provide imaging resolution superior to that achieved in humans. However, small animal AO imaging is particularly challenging because of the unique anatomical and optical features of the rodent eye. The rodent eye has a large lens that encompasses ~2/3 of the volume of the eye, poor ocular optics, a difficult tear film layer, and an extremely high optical power (compared to humans) [34]. Not only does poor ocular optics necessitate higher-order aberration correction with adaptive optics, but the high optical power means that any imaging system must have ~40D or more of focus correction to image through the layers of the rodent retina. Despite an eye that has an effective focal length that is a fraction of humans, the rodent retina has comparably-sized cellular features (rod and cone photoreceptors, ganglion cells, etc.). This creates both advantages and disadvantages for AO imaging. High NA optics coupled with human-sized cellular targets creates an opportunity for in vivo resolution of features not accessible in the human eye. However, for wavefront sensing using an equivalently sampled pupil (for the MAOS there is a 3-fold difference between the pupils for the two configurations), the relatively high NA of the rat eye causes targets from multiple retinal axial planes to blur individual WS spots. If the WS were to be configured with lower density sampling across the rodent pupil in order to compensate for this, higher-order AO correction could not be achieved [35]. This dilemma has spurred some researcher to pursue a low coherent approach to wavefront sensing, where axial plane selectivity can create both high pupil sampling densities as well as tight, easily centroided WS spots [36]. Despite these limitations, several groups have demonstrated small animal AO imaging, successfully resolving GFP-labeled microglia and other retinal features [37–39].
In the MAOS, the alternate imaging configuration with reduced pupil diameter can be used either for long DOF imaging in humans, where AO correction would be less effective than if the full pupil was illuminated, or for small animal imaging. The 2.5-mm beam diameter is probably better suited for imaging mice than rats. Also, for the reasons discussed in the preceding paragraph, the WS sampling density was more suited for humans than rats. Despite these design trade-offs, the system performed reasonably well in rats with the alternate configuration (Fig. 12). Individual erythrocytes could be resolved flowing through capillaries. Individual photoreceptors were resolved, although a continuous rod photoreceptor mosaic was not, probably because the 2.5-mm configuration sampled approximately half of the rat pupil and thus AO correction was not optimal. Further study in the mouse eye is required to fully characterize the MAOS capabilities for small animal imaging.
This paper indicates the extensive amount of information that can be extracted from the high resolution images and videos obtained from the MAOS. Future thrusts aim to reduce system complexity for routine clinical use and improve automated analysis tools for extraction of quantitative metrics. On-going studies at several ophthalmic clinics, research hospitals, and universities will define new avenues of investigation and further demonstrate MAOS capabilities.
Acknowledgments
This work was supported by NIH grants EY018986 (Hammer), EY020308 (Akula), EY010597 (Fulton), and S10RR025605 (Fulton). Physical Sciences Inc., The Hospital for Sick Kids, and the University of Waterloo also supported system development. We thank Jennifer Norris and Alfredo Dubra for help with image registration. We thank Melanie Campbell, Carol Westall, Tom Wright, and Marsha Kisilak for valuable suggestions.
References
- 1.Webb RH, Hughes GW, Delori FC. Confocal scanning laser ophthalmoscope. Appl. Opt. 1987;26:1492–1499. doi: 10.1364/AO.26.001492. [DOI] [PubMed] [Google Scholar]
- 2.Huang D, Swanson EA, Lin CP, Schuman JS, Stinson WG, Chang W, Hee MR, Flotte T, Gregory K, Puliafito CA, Fujimoto JG. Optical coherence tomography. Science. 1991;254:1178–1181. doi: 10.1126/science.1957169. [DOI] [PMC free article] [PubMed] [Google Scholar]
- 3.Delori FC. Spectrophotometer for noninvasive measurement of intrinsic fluorescence and reflectance of the ocular fundus. Appl. Opt. 1994;33:7439–7452. doi: 10.1364/AO.33.007439. [DOI] [PubMed] [Google Scholar]
- 4.Gray DC, Merigan W, Wolfing JI, Gee BP, Porter J, Dubra A, Twietmeyer TH, Ahamd K, Tumbar R, Reinholz F, Williams DR. In vivo fluorescence imaging of primate retinal ganglion cells and retinal pigment epithelial cells. Opt. Express. 2006;14:7144–7158. doi: 10.1364/oe.14.007144. [DOI] [PubMed] [Google Scholar]
- 5.Liang J, Williams DR, Miller DT. Supernormal vision and high-resolution retinal imaging through adaptive optics. J. Opt. Soc. Am. A. 1997;14:2884–2892. doi: 10.1364/josaa.14.002884. [DOI] [PubMed] [Google Scholar]
- 6.Roorda A, Romero-Borja F, Donnelly WI, Queener H, Hebert T, Campbell M. Adaptive optics scanning laser ophthalmoscopy. Opt. Express. 2002;10:405–412. doi: 10.1364/oe.10.000405. [DOI] [PubMed] [Google Scholar]
- 7.Chui TP, Song H, Burns SA. Adaptive-optics imaging of human cone photoreceptor distribution. J. Opt. Soc. Am. A. 2008;25:3021–3029. doi: 10.1364/josaa.25.003021. [DOI] [PMC free article] [PubMed] [Google Scholar]
- 8.Hermann B, Fernández EJ, Unterhuber A, Sattmann H, Fercher AF, Drexler W, Prieto PM, Artal P. Adaptive-optics ultrahigh-resolution optical coherence tomography. Opt. Lett. 2004;29:2142–2144. doi: 10.1364/ol.29.002142. [DOI] [PubMed] [Google Scholar]
- 9.Zawadzki RJ, Jones SM, Olivier SS, Zhao M, Bower BA, Izatt JA, Choi S, Laut S, Werner JS. Adaptive-optics optical coherence tomography for high-resolution and high-speed 3D retinal in vivo imaging. Opt. Express. 2005;13:8532–8546. doi: 10.1364/opex.13.008532. [DOI] [PMC free article] [PubMed] [Google Scholar]
- 10.Torti C, Povazay B, Hofer B, Unterhuber A, Carroll J, Ahnelt PK, Drexler W. Adaptive optics optical coherence tomography at 120,000 depth scans/s for non-invasive cellular phenotyping of the living human retina. Opt. Express. 2009;17:19382–19400. doi: 10.1364/OE.17.019382. [DOI] [PMC free article] [PubMed] [Google Scholar]
- 11.Kocaoglu OP, Lee S, Jonnal RS, Wang Q, Herde AE, Derby JC, Gao W, Miller DT. Imaging cone photoreceptors in three dimensions and in time using ultrahigh resolution optical coherence tomography with adaptive optics. Biomed. Opt. Express. 2011;2:748–763. doi: 10.1364/BOE.2.000748. [DOI] [PMC free article] [PubMed] [Google Scholar]
- 12.Dubra A, Sulai Y, Norris JL, Cooper RF, Dubis AM, Williams DR, Carroll J. Noninvasive imaging of the human rod photoreceptor mosaic using a confocal adaptive optics scanning ophthalmoscope. Biomed. Opt. Express. 2011;2:1864–1876. doi: 10.1364/BOE.2.001864. [DOI] [PMC free article] [PubMed] [Google Scholar]
- 13.Tam J, Tiruveedhula P, Roorda A. Characterization of single-file flow through human retinal parafoveal capillaries using an adaptive optics scanning laser ophthalmoscope. Biomed. Opt. Express. 2011;2:781–793. doi: 10.1364/BOE.2.000781. [DOI] [PMC free article] [PubMed] [Google Scholar]
- 14.Chui TYP, Zhong Z, Song H, Burns SA. Foveal avascular zone and its relationship to foveal pit shape. Optom. Vis. Sci. 2012;89:602–610. doi: 10.1097/OPX.0b013e3182504227. [DOI] [PMC free article] [PubMed] [Google Scholar]
- 15.Hunter JJ, Masella B, Dubra A, Sharma R, Yin L, Merigan WH, Palczewska G, Palczewski K, Williams DR. Images of photoreceptors in living primate eyes using adaptive optics two-photon ophthalmoscopy. Biomed. Opt. Express. 2011;2:139–148. doi: 10.1364/BOE.2.000139. [DOI] [PMC free article] [PubMed] [Google Scholar]
- 16.Jonnal RS, Besecker JR, Derby JC, Kocaoglu OP, Cense B, Gao W, Wang Q, Miller DT. Imaging outer segment renewal in living human cone photoreceptors. Opt. Express. 2010;18:5257–5270. doi: 10.1364/OE.18.005257. [DOI] [PMC free article] [PubMed] [Google Scholar]
- 17.Pircher M, Kroisamer JS, Felberer F, Sattmann H, Götzinger E, Hitzenberger CK. Temporal changes of human cone photoreceptors observed in vivo with SLO/OCT. Biomed. Opt. Express. 2011;2:100–112. doi: 10.1364/BOE.2.000100. [DOI] [PMC free article] [PubMed] [Google Scholar]
- 18.Kraus MF, Potsaid B, Mayer MA, Bock R, Baumann B, Liu JJ, Hornegger J, Fujimoto JG. Motion correction in optical coherence tomography volumes on a per A-scan basis using orthogonal scan patterns. Biomed. Opt. Express. 2012;3:1182–1199. doi: 10.1364/BOE.3.001182. [DOI] [PMC free article] [PubMed] [Google Scholar]
- 19.Wolf-Schnurrbusch UE, Enzmann V, Brinkmann CK, Wolf S. Morphologic changes in patients with geographic atrophy assessed with a novel spectral OCT-SLO combination. Invest. Ophthalmol. Vis. Sci. 2008;49:3095–3099. doi: 10.1167/iovs.07-1460. [DOI] [PubMed] [Google Scholar]
- 20.Zawadzki RJ, Jones SM, Pilli S, Balderas-Mata S, Kim DY, Olivier SS, Werner JS. Integrated adaptive optics optical coherence tomography and adaptive optics scanning laser ophthalmoscope system for simultaneous cellular resolution in vivo retinal imaging. Biomed. Opt. Express. 2011;2:1674–1686. doi: 10.1364/BOE.2.001674. [DOI] [PMC free article] [PubMed] [Google Scholar]
- 21.Rosen RB, van Velthoven MEJ, Garcia PMT, Cucu RG, de Smet MD, Muldoon TO, Gh Podoleanu A. Ultrahigh-Resolution Combined Coronal Optical Coherence Tomography Confocal Scanning Ophthalmoscope (OCT/SLO) : A pilot study. Spektrum Augenheilkunde. 2007;21:17–28. [Google Scholar]
- 22.Mujat M, Ferguson RD, Patel AH, Iftimia N, Lue N, Hammer DX. High resolution multimodal clinical ophthalmic imaging system. Opt. Express. 2010;18:11607–11621. doi: 10.1364/OE.18.011607. [DOI] [PMC free article] [PubMed] [Google Scholar]
- 23.Ferguson RD, Zhong Z, Hammer DX, Mujat M, Patel AH, Deng C, Zou W, Burns SA. Adaptive optics SLO with integrated wide-field retinal imaging and tracking. J. Opt. Soc. Am. A. 2010;27:A265–A277. doi: 10.1364/JOSAA.27.00A265. [DOI] [PMC free article] [PubMed] [Google Scholar]
- 24.Burns SA, Tumbar R, Elsner AE, Ferguson RD, Hammer DX. Large Field of View, Modular, Stabilized, Adaptive-Optics-Based Scanning Laser Ophthalmoscope. J. Opt. Soc. Am. A. 2007;24:1313–1326. doi: 10.1364/josaa.24.001313. [DOI] [PMC free article] [PubMed] [Google Scholar]
- 25.Hammer DX, Ferguson RD, Ustun TE, Bigelow CE, Iftimia NV, Webb RH. Line-scanning laser ophthalmoscope. J. Biomed. Opt. 2006;11:041126. doi: 10.1117/1.2335470. [DOI] [PubMed] [Google Scholar]
- 26.Hammer DX, Ferguson RD, Bigelow CE, Iftimia NV, Ustun TE, Burns SA. Adaptive optics scanning laser ophthalmoscope for stabilized retinal imaging. Opt. Express. 2006;14:3354–3367. doi: 10.1364/oe.14.003354. [DOI] [PMC free article] [PubMed] [Google Scholar]
- 27.Hammer DX, Ferguson RD, Mujat M, Biss DP, Iftimia NV, Patel AH, Plumb E, Campbell M, Norris JL, Dubra A, Chui TYP, Akula JD, Fulton AB. Manns F, Soderberg PG, Ho A, editors. Advanced Capabilities of the Multimodal Adaptive Optics Imager. Ophthalmic Technologies XXI, SPIE Proc. 2011;7885:78850A-1. [Google Scholar]
- 28.Nadler Z, Wollstein G, Nevins JE, Ishikawa H, Kagemann L, Sigal IA, Ferguson RD, Hammer DX, Schuman JS. Three-Dimensional Morphological Evaluation of Lamina Cribrosa. Ophthalmol. 2012 submitted. [Google Scholar]
- 29.Ustun TE, Iftimia NV, Ferguson RD, Hammer DX. Real-time processing for Fourier domain optical coherence tomography using a field programmable gate array. Rev. Sci. Instrum. 2008;79:114301. doi: 10.1063/1.3005996. [DOI] [PMC free article] [PubMed] [Google Scholar]
- 30.Won J, Shi LY, Hicks W, Wang J, Hurd R, Naggert JK, Chang B, Nishina PM. Mouse model resources for vision research. J. Ophthalmol. 2011;2011:391384. doi: 10.1155/2011/391384. [DOI] [PMC free article] [PubMed] [Google Scholar]
- 31.McKinnon SJ, Schlamp CL, Nickells RW. Mouse models of retinal ganglion cell death and glaucoma. Exp. Eye Res. 2009;88:816–824. doi: 10.1016/j.exer.2008.12.002. [DOI] [PMC free article] [PubMed] [Google Scholar]
- 32.Rakoczy EP, Ali Rahman IS, Binz N, Li CR, Vagaja NN, de Pinho M, Lai CM. Characterization of a mouse model of hyperglycemia and retinal neovascularization. Am. J. Path. 2010;177:2659–2670. doi: 10.2353/ajpath.2010.090883. [DOI] [PMC free article] [PubMed] [Google Scholar]
- 33.Greenwald DL, Cashman SM, Kumar-Singh R. Mutation-independent rescue of a novel mouse model of retinitis pigmentosa. Gene Ther. 2012 Jul 19; doi: 10.1038/gt.2012.53. [DOI] [PMC free article] [PubMed] [Google Scholar]
- 34.Li G, Zwick H, Stuck B, Lund DJ. On the use of schematic eye models to estimate retinal image quality. J. Biomed. Opt. 2000;5:307–314. doi: 10.1117/1.430001. [DOI] [PubMed] [Google Scholar]
- 35.García de la Cera E, Rodríquez G, Llorente L, Schaeffel F, Marcos S. Optical aberrations in the mouse eye. Vis. Res. 2006;46:2546–2553. doi: 10.1016/j.visres.2006.01.011. [DOI] [PubMed] [Google Scholar]
- 36.Tuohy S, Gh. Podoleanu A. Depth-resolved wavefront aberrations using a coherence-gated Shack-Hartmann wavefront sensor. Opt. Express. 2010;18:3458–3476. doi: 10.1364/OE.18.003458. [DOI] [PubMed] [Google Scholar]
- 37.Alt C, Lin CP. In vivo quantification of microglia dynamics with a scanning laser ophthalmoscope in a mouse model of focal laser injury. In: Manns F, Soderberg PG, Ho A, editors. Ophthalmic Technologies XXII, SPIE Proc. Vol. 8209. 2012. p. 820907. [Google Scholar]
- 38.Biss DP, Sumorok D, Burns SA, Webb RH, Zhou Y, Bifano TG, Côté D, Veilleux I, Zamiri P, Lin CP. In vivo fluorescent imaging of the mouse retina using adaptive optics. Opt. Lett. 2007;32:659–661. doi: 10.1364/ol.32.000659. [DOI] [PMC free article] [PubMed] [Google Scholar]
- 39.Geng Y, Dubra A, Yin L, Merigan WH, Sharma R, Libby RT, Williams DR. Adaptive optics retinal imaging in the living mouse eye. Biomed. Opt. Express. 2012;3:715–734. doi: 10.1364/BOE.3.000715. [DOI] [PMC free article] [PubMed] [Google Scholar]


