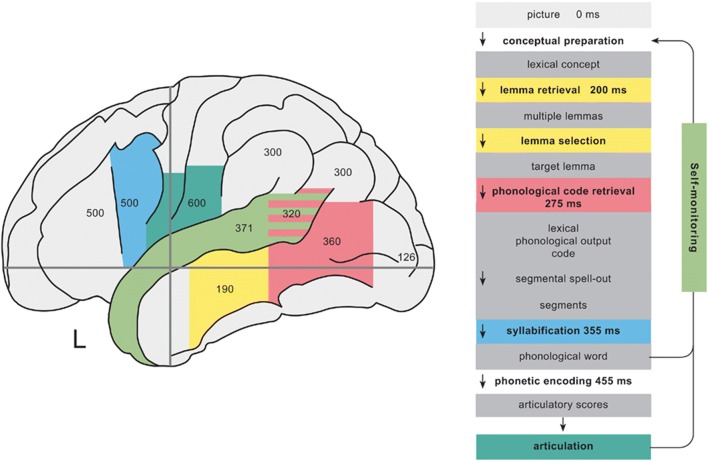
Fig. 1.
Stages of speech production according to Indefrey’s [3] model. The color-coded table to the right summarizes the stages of processing in speech production and time course in response to an image stimulus. The color-coded image to the left displays regions implicated in each stage of processing along with peak activation times observed experimentally in milliseconds [3]. Figure reused with permission from Ref. [3]

