

Abstract
The histone deacetylase inhibitor belinostat is eliminated through glucuronidation by UGTIAI. Polymorphisms that reduce UGTIAI function could result in increased belinostat exposure and toxicities. We wanted to determine which single-nucleotide polymorphisms alter belinostat exposure and toxicity. In a phase I trial (belinostat over 48 hours in combination with cisplatin and etoposide), belinostat (400, 500, 600, or 800 mg/m2/24h, 48-hour continuous infusion) was administered to patients with cancer in combination with cisplatin and etoposide (n = 25). Patients were genotyped for UGTIAI variants associated with reduced function : UGTIAI *6, UGTIAI *28, and UGTIAI *60. End points were associations between UGTIAI genotype and beli nostat pharmacokinetics (PK), toxicities, and global protein lysi ne acetylation (AcK). Belinostat AUC was increased (P = .003), and t ½ increased (P = .0009) i n UGTIAI *28 and UGTI AI *60 carriers who received more than 400 mg/m2/24 h. The incidence of grades 3–4 thrombocytopenia (P = .0081 ) was associated with UGTIAI polymorphisms. The US Food and Drug Administration-approved package insert recommends dose adjustment of belinostat for UGTIAI *28. However, our data suggest dose adjustment is also necessary for UGTIAI *60. UGTIAI polymorphisms were associated with increased systemic belinostat exposure, increased AcK, and increased incidence of toxicities, particularly at doses > 400 mg/m2/24h.
Keywords: belinostat, UGTIAI, pharmacogenomics, pharmacokinetics, pharmacodynamics
In 2014, the US Food and Drug Administration approved the histone deacetylase (HDAC) inhibitor belinostat (BELEODAQ, Spectrum Pharmaceuticals, Inc., Henderson, Nevada) for treatment of relapsed or refractory peripheral T-cell lymphoma.1 Belinostat-induced HDAC inhibition is reversible,2 and its elimination half-life (t1/2) is only 1.1 hours. We therefore studied a continuous intravenous infusion (CIVI) of belinostat over 48 hours to prolong exposure in a phase 1 trial in patients with advanced cancer in combination with cisplatin and etoposide (BPE).
We began investigation of belinostat metabolism after a patient in the BPE trial had persistent QTc prolongation. This individual was found to have the highest steady-state plasma concentration (Css) of all study participants. We then identified several polymorphisms for this individual in the uridine diphosphate glucuronosyltransferase 1 family, polypeptide Al ( UGT1A1). Based on this observation, along with emerging preclinical data on belinostat metabolism through UGTlAl,3 we undertook a comprehensive evaluation of UGT1A1 genotyping in patients enrolled in the BPE trial.
Several UGT1A1 polymorphisms decrease gene expression, leading to reduced bilirubin conjugation and hyperbilirubinemia, which, for example, occurs in patients with Gilbert syndrome. The polymorphism generally associated with Gilbert syndrome is UGT1A1*28 (rs8175347), which contains an extra TA repeat (A[TA]7TAA) in the UGT1A1 promoter region4 and is frequently expressed among whites (26%−3l%).5 Furthermore, UGT1A1* 28 in patients treated with irinotecan is associated with increased SN-38 plasma concentrations leading to irinotecan-induced neutropenia,6 and therefore a dose reduction of irinotecan is recommended in patients homozygous for UGT1A1* 28.7 UGT1A1* 60 (3279T>G, rs4124874) is in linkage disequilibrium with UGT1A1* 288 and is another frequent genetic variant in whites (allele frequency; 53%). This variant is associated with reduced glucuronidation and increased bilirubin levels in Japanese patients treated with irinotecan9 and with hematological toxicities in white patients. 10 Similar to UGT1A1* 28 and UGT1A1* 60, UGT1A1* 6 (21 lG>A, rs4148323), with an allele frequency of 10%−23% in Asians,11 is also associated with impaired UGT lAl activity, reduced glucuronidation of SN-38, and irinotecan-induced neutropenia.12
Given its recent approval, there is limited information regarding the clinically important metabolic pathways of belinostat. The belinostat package insert recommends a dose reduction of belinostat to 750 mg/m2 in patients homozygous for UGT1A1* 28 to minimize dose-limiting toxicities.1 However, this recommendation is only supported by 1 preclinical study, reporting that UGTlAl-glucuronidation is the main metabolic pathway of belinostat, and human liver microsomes (HLMs) heterozygous and homozygous for UGT1A1* 28 metabolized belinostat more slowly than wild-type HLMs.3 No clinical study has evaluated the effect of UGT1A1 polymorphisms on the pharmacokinetics (PK) and pharmacodynamics (PD) of belinostat.
Based on this background, we conducted a pharmacogenomic (PG) analysis in which effects of UGT1A1 polymorphisms on systemic belinostat exposure, protein lysine acetylation and toxicities were evaluated in patients with cancer receiving BPE.
Methods
Patients and Treatment
All patients provided written informed consent before study enrollment, and genotyping was approved by the Institutional Review Board of the National Cancer Institute (NCI) in Bethesda, Maryland.
PK, PD, and PG analyses were performed in patients participating in the BPE trial (ClinicalTrials.gov Identifier: NCT00926640) at the NCI. Patients with advanced cancer (n = 25) received belinostat (day 1: 400, 500, 600, or 800 mg/m2/24h as 48-hour continuous intravenous infusion) in combination with cisplatin (60 mg/m2 intravenously on day 2) and etoposide (80 mg/m2 intravenously daily on days 2–4). Patients > 18 years old were included with histologic or cytologic confirmation of cancer for which there is no known standard therapy capable of extending life expectancy. Other main inclusion criteria were Eastern Cooperative Oncology Group (ECOG) performance status 0–2, life expectancy ≥:3 months, absolute neutrophil count : ≥l500/mm3, platelets ≥ 100 000/mm3, total bilirubin ≥ 1.2 mg/dL, aspartate aminotransferase (AST) and alanine transaminase (ALT) ≤ 2.0 x upper limit ofnormal (ULN), creatinine ≤ 1.5 x ULN, or creatinine clearance > 50 mL/min/1.73 m2. Exclusion criteria included treatment with another HDAC inhibitor for at least 2 weeks prior to enrollment, acute or chronic hepatitis, cardiovascular disease (NYHA class III or IV), QTc interval prolongation (> 450 milliseconds) at baseline, or use of concomitant medications associated with QTc interval prolongation.
PK Analysis of Belinostat
PK analysis of belinostat was performed during the first treatment cycle. BPE blood samples were collected before treatment and 30 minutes, 1 hour, and 2 hours after the start of belinostat infusion; on day 2 immediately prior to the start and at the end of cisplatin infusion and 15 minutes, 30 minutes, 1, 2, 4, and 6 hours post-end of cisplatin infusion; on day 3 immediately prior to the start of etoposide infusion and 5, 15, and 30 minutes and 1, 2, 4, 6, 8, and 12 hours post-end of belinostat infusion.
At the Clinical Pharmacology Program Blood Processing Core, blood samples were centrifuged at 1200g for 5 minutes at 4°C. Subsequently, the plasma layer was transferred into 2 cryovials and stored at −80°C until analysis. Belinostat plasma concentrations were measured using a validated ultraperformance liquid chromatography coupled with tandem mass spectrometry (UPLC-MS/MS) assay with a lower limit of quantification of 5 ng/mL. Belinostat was extracted from 100uL of plasma using 1mL of methyl tert-butyl ether, dried down and resuspended before injection into the UPLC-MS/MS system.
A noncompartmental analysis was performed using Phoenix WinNonlin 6.3 (Certara Pharsight, Cary, North Carolina), and the following PK parameters were obtained: area under the plasma concentration-time curve (AUC), maximum plasma concentration (Cmax), total body clearance (CL), and t1/2.
PD Effects in Peripheral Blood Monon uclear Cells
The extent of global protein lysine acetylation (AcK) in peripheral blood mononuclear cells (PBMCs) was used as a surrogate marker for the HDAC inhibiting effects of belinostat. For this purpose, PBMCs were collected prior to belinostat infusion and 12, 36, and 60 hours after the start of infusion. Analysis of AcK was performed by multiparametric flow cytometry using a MACSQuant flow cytometer (Miltenyi Biotec, Bergisch Gladbach, Germany) as described previously,13 after which fold change of AcK postdose relative to predose was calculated.
Toxicities
Incidence of the following belinostat-related toxicities during the first treatment cycle was reported: thrombocytopenia, lymphocytopenia, neutropenia, nausea, vomiting, fatigue, and ∆QTc as a surrogate marker for QTc-prolonging effects of belinostat (∆QTc = mean QTc interval during cycle 1 - QTc interval at baseline).
UGTIAI Genotyping
UGT1A1* 6, UGT1A1* 28, and UGT1A1* 60 genetic variants were determined with fragment analysis or direct sequencing. Details about the used genotyping methods are presented in the Supplemental Methods.
Statistical Considerations
An exact Cochran-Armitage trend test was used for comparisons between dichotomous parameters (eg, grades 0–2/3–4 hematological toxicities, sex) and ordered categorized genotypes (ie, wild type vs heterozygous vs homozygous). Comparisons between continuous parameters (eg, PK parameters, AcK fold change, QTc change, baseline laboratory values) and ordered categorized genotypes were determined using a Jonckheere-Terpstra test for trend. Comparisons between 2 dichotomous parameters were performed with Fisher’s exact test. Hardy-Weinberg equilibrium (HWE) of UGT1A1*28 and UGT1A1* 60 genotypes was tested by the χ2 test (a =.05 was the threshold for statistical significance). The sample size for our study was determined by the number of patients who completed the BPE trial. No separate sample size determination was carried out for this report, because this is based on patients from the BPE study, which was powered to meet other clinical objectives. All P values are 2-tailed and reported without any formal adjustment for multiple comparisons. However, in view of the number of exploratory tests performed, only tests with P < .01 were interpreted as statistically significant, whereas those for which .01 < P < .05 were considered to represent strong trends toward statistical significance. Statistical analyses were carried out with GraphPad Prism 6 (GraphPad Software, Inc., La Jolla, California), SAS version 9.3 (SAS Institute, Cary, North Carolina), and IBM SPSS Statistics 22 (IBM Corp., Armonk, New York).
Results
Demographics and UGTIAI Genotyping
Twenty-five patients were enrolled on the BPE trial. Baseline characteristics and UGTJAJ genotyping results are shown in Table I. In our patient population only 1 patient carried the UGT1A1* 6 variant; thus, this polymorphism was excluded from the PG analysis. UGT1A1* 28 and UGT1A1* 60 genotypes were in HWE (P > .05).
Table I.
Patient Characteristics and Uridine Diphosphate Glucuronosyltransferase I Family, Polypeptide A I (UGTIAI) Genotyping Data From the BPE Trial
| Characteristics | Number of patients or Sex median range |
|---|---|
| Number of patients or | 25 |
| Sex | |
| Male | 15 |
| Female | 10 |
| Age | |
| Body surface area (BSA, m2) | 54.5 (39.8–78.3) |
| ECOG performance status | 1.90 (1.20–2.49) |
| 0 | 1 |
| 1 | 23 |
| 2 | 1 |
| Race | |
| White | 21 |
| African American | 2 |
| Hispanic | 1 |
| Asian | 1 |
| Primary tumor site | |
| Non-small cell lung cancer | 3 |
| Adrenocortical cancer | 2 |
| Cervix | 2 |
| Small cell lung cancer | 6 |
| Pheochromocytoma | 2 |
| Prostate | 2 |
| Endometrium | 1 |
| Pancreas | 1 |
| Mesothelioma | 2 |
| Cancer-prone syndromes | 2 |
| Brain | 1 |
| Not specified | 2 |
| Belinostat dose level (mg/m2/24h) | |
| 400 | 10 |
| 500 | 7 |
| 600 | 6 |
| 800 | 2 |
| Basline laboratory values | |
| Albumin(g/dL) | 3.7 (2.1–4.2) |
| Allakine phosphatase(U/L) | 99 (59–239) |
| Total bilirubin (mg/dL) | 0.3 (0.1–0.6) |
| AST (U/L) | 19 (10–49) |
| ALT(mg/dL) | 28 (8–65) |
| Creatinine (mg/dL) | 0.81 (0.48–1.13) |
| BSA-adjusted creatinine (mL/min)a | 100.6(51.7–222.2) |
| UGT1A1 genotyping results | |
| UGT1A1*6b | |
| UGT1A1*1/*1 | 22 |
| UGT1A1*6/*6 | 0 |
| UGT1A1*6/*6 | 1 |
| UGT1A1*28 | |
| UGT1A1*1/*1 | 11 |
| UGT1A1*1/*28 | 11 |
| UGT1A1*28/*28 | 3 |
| UGT1A1*60c | |
| UGT1A1*1/*1 | 5 |
| UGT1A1*1/*60 | 11 |
| UGT1A1*60/*60 | 7 |
ALT, alanine transaminase; AST, aspartate aminotransferase; ECOG, Eastern Cooperative Oncology Group.
BSA-adjusted creatinine clearance was calculated using the Cockcroft-Gault formula.
Unable to determine UGTIAI*60 genotype in 2 patients.
Unable to determine UGT/A/*60 genotype in 2 patients.
The majority of baseline laboratory values were comparable for genetic variants of UGT1A1* 28, * 60 and combinations of these variants. Only albumin levels significantly trended downward in UGT1A1* 28 carriers compared with UGT1A1* 28 wild types (P =.0022; Supplemental Table Sl). Other liver function tests did not significantly differ across the evaluated UGT1A1 genotypes (P > .01). Overall, patients’ demographics were comparable for the investigated UGT1A1 genotypes, although men tended to be wild type and women tended to be variant in the combined *281* 60 analysis (P =.0079; otherwise P > .01; Supplemental Table Sl). Because the stratified genotypes were generally comparable in regard to baseline liver function and demographics, these parameters were unlikely to be confounding factors in this PG analysis.
Effect of UGTIAI Genetic Variants on Belinostat PK
Table 2 (showing dose-normalized values) and Supplemental Table S2 list averaged and genotype-stratified PK parameters of belinostat during cycle 1. UGT1A1* 28 genetic variants were not associated with belinostat AUC, CL, t1/2 or Cmax (P > .01). However, patients heterozygous and homozygous for UGT1A1* 60 tended to have significantly increased t1/2 compared with UGT1A1* 60 wild types (P = .0077; Supplemental Table S2). No significant associations between belinostat PK and genotype were found in the combined variant analysis of UGT1A1* 28 and UGTJA1* 60 (P > .01; Figure l A-D).
Table 2.
Pharmacokinetic Parameters of Belinostat in the BPE Trial (n = 25) During Cycle I
| PK parameter | Mean (± SD) | |||||||
|---|---|---|---|---|---|---|---|---|
| Dose-normalized AUC (ng · h/mL)mg | 11.26 (± 4.67) | |||||||
| Dose-normalized Cmax (ng/ml/mg) | 0.37 (± 0.17) | |||||||
| UGT1A1*28 | UGT1A1*28 All patients (n = 25) | UGT1A1*28 Excluding 400 mg/m2/24h dose level (n = 15) | ||||||
| PK parameter (median with range) | *1/*1 (n = 11) | *1/*28 (n = 11) | *28/*28 (n= 3) | Pa | *1/*1 (n= 3) | *1/*28 (n = 5) | *281*28 (n = 2) | Pa |
| Dose-normalized AUC (ng • h/mL)/mg | 10.0 (6.2 −17.6) | 10.2 (7.2 −22.5) | 12.7 (4.7 −19.0) | 0.66 | 10.6 (6.2 −17.6) | 11.7 (7.6 −21.7) | 15.8 (12.7 −19.0) | 0.12 |
| Dose-normalized Cmax(ng/mL(/mg) | 0.29 (0.22 −0.53) | 0.34 (0.21 −0.88) | 0.39 (0.17 −0.74) | 0.49 | 0.35 (0.23 −0.53) | 0.34 (0.21 −0.56) | 0.57 (0.39 −0.74) | 0.51 |
| UGT1A1*60b | All patients (n = 23) | Excluding 400 mg/m2/24h dose level (n = 15) | ||||||
| PK parameter (median with range) | *1/*1 (n = 5) | *1/*60 (n = 11) | *60/*60 (n = 7) | Pa | *1/*1 (n = 4) | *1/*60 (n = 7) | *601*60 (n = 4) | Pa |
| Dose-normalized AUC (ng • h/mL)/mg) | 8.4 (6.2 −0.0037 | 11.7 (7.6 −22.5) | 11.2 (4.7 −21.7) | 0.18 | 7.9 (6.2 −10.0) | 11.7 (7.6 −17.6) | 15.8 (11.2 −21.7) | 0.0037 |
| Dose-normalized Cmax(ng/mL)/mg) | 0.26 (0.23 −0.068 | 0.35 (0.21 −0.88) | 0.34 (0.17 −0.74) | 0.67 | 0.25 (0.23 −0.42) | 0.35 (0.21 −0.53) | 0.48 (0.29 −0.74) | 0.068 |
| UGT1A1*28 UGT1A1*60 combined (all dose levels, n = 23b) | ||||||||
| PK parameter (median with range) | *28 WT + *60 WT (n= 4) | *28 WT/HT + *60 WT/HT (n = 12) | *28 WT/HT + *60 VAR (n = 4) | *28 VAR + *60 VAR(n = 3) | Pa | |||
| Dose-normalized AUC (ng • h/mL)/mg | 7.9 (6.2 – 10.0) | 11.4 (7.6 – 22.5) | 9.7 (7.8 – 21.7) | 12.7 (4.7 – 19.0) | 0.23 | |||
| Dose-normalized Cmax(ng/mL/mg) | 0.25 (0.23 – 0.42) | 0.35 (0.21 – 0.88) | 0.32 (0.22 – 0.56) | 0.39 (0.17 – 0.74) | 0.56 | |||
| UGT1A1*28 and UGT1A1*60 combined (excluding 400 mg/m2/24 h dose level, n = 15) | ||||||||
| PK parameter (median with range) | *28 WT + *60 WT (n= 4) | *28 *WT/HT + *60 WT/HT (n = 7) | *28 WT/HT + *60 VAR (n = 2) | *28 VAR + *60 VAR (n = 2) | Pa | |||
| Dose-normalized AUC (ng • h/mL)/mg | 7.9 (6.2 – 10.0) | 11.7 (7.6 – 17.6) | 16.5 (11.2 – 21.7) | 15.8 (12.7 – 19.0) | 0.0030 | |||
| Dose-normalized Cmax(ng/mL/mg) | 0.25 (0.23 – 0.42) | 0.35 (0.21 – 0.53) | 0.43 (0.29 – 0.56) | 0.57 (0.39 – 0.74) | 0.061 | |||
WT, wild type; HT, heterozygous; VAR, homozygous; PK, pharmacokinetics.
P values obtained using the Jonckheere-Terpstra test for trend (α = .01 required for statistical significance).
Unable to determine UGTIAI * 60 genotype in 2 patients.
Figure 1.
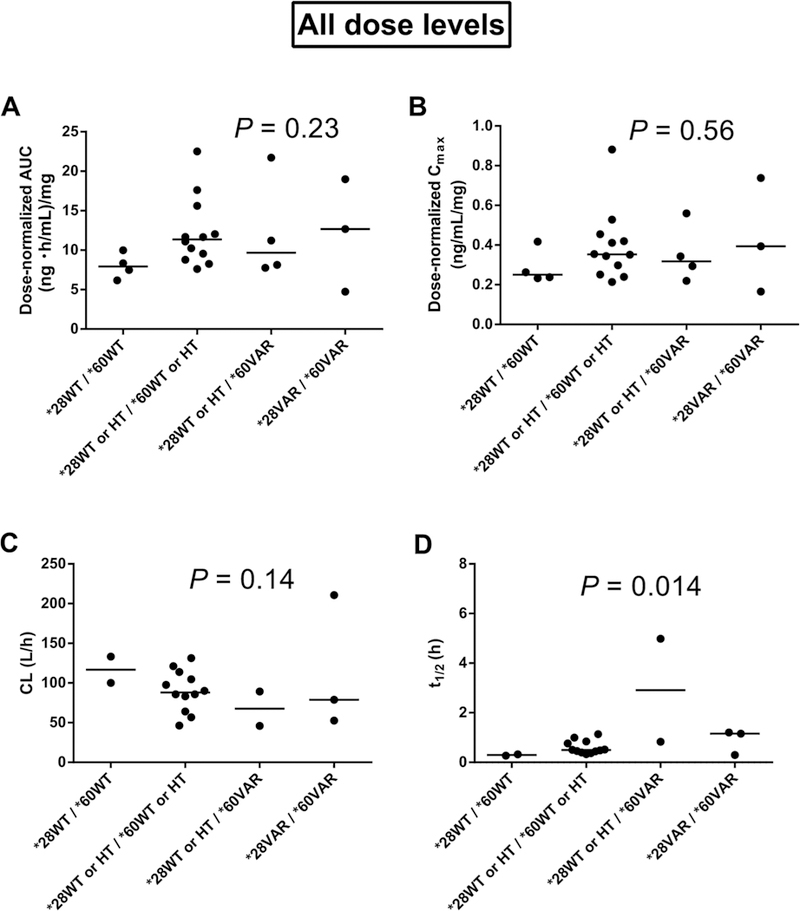
Effects of combined variants of uridine diphosphate glucuronosyltransferase I family, polypeptide A I (UGTIAI)*28 and *60 on belinostat pharmacokinetics for all dose levels in the trial of belinostat (400, 500, 600, or 800 mg/m2/24 h, 48-hour continuous infusion) in combination with cisplatin and etoposide. (A) UGT IA I vs dose-normalized area under the plasma concentration-time curve (AUC, n = 23). (B) UGTIAI vs dose normalized maximum plasma concentration (Cmax, n = 23). (C) UGTIAI versus total body clearance (CL, n = 19). (D) UGTIAI versus elimination halflife (t1/2, n = 19). P values were obtai ned using the Jonckheere-Terpstra test for trend (α =.0I required for significance). WT, wild type; HT, heterozygous; VAR, homozygous.
Because effects of the UGT1A1 genotype on the risk of irinotecan-induced neutropenia are greater at high irinotecan doses, 14 15 we hypothesized that the UGT1A1 effects on belinostat PK and toxicities could also be dose dependent. Therefore, associations between UGT1A1 genotype and belinostat PK were reanalyzed after exclusion of patients at the lowest belinostat dose level of 400mg/m2/24h (n = 10). Now, dose-normalized AUC (P =.003 ; Figure 2A) and t 112 (P = .0009; Figure 2D) were significantly increased in carriers of UGT1A1* 28 and/or UGT1A1* 60, whereas a decreasing trend of CL was found in these patients (P = .023; Figure 2C). Also dose-normalized Cmax tended to be increased in these patients (P = .061; Figure 2B). Evaluation of the separate effects of UGT1A1* 28 and UGT1A1* 60 on belinostat PK showed that dose-normalized AUC (P = .0037; Table 2) and t1/2 (P = .0017; Supplemental Table S2) were significantly increased in carriers of UGT1A1* 60 variants. In addition, a strong decreasing trend was observed for belinostat CL in these patients (P = 0.02), and a nonsignificant increase in absolute AUC (P =.025; Supplemental Table S2) and Cmax was found (dosenormalized: P = .068, Table 2; absolute: P = .034, Supplemental Table S2). These findings suggest that at daily doses > 400mg/m2 UGT1A1* 60 has a greater effect on belinostat PK than on UGT1A1* 28.
Figure 2.
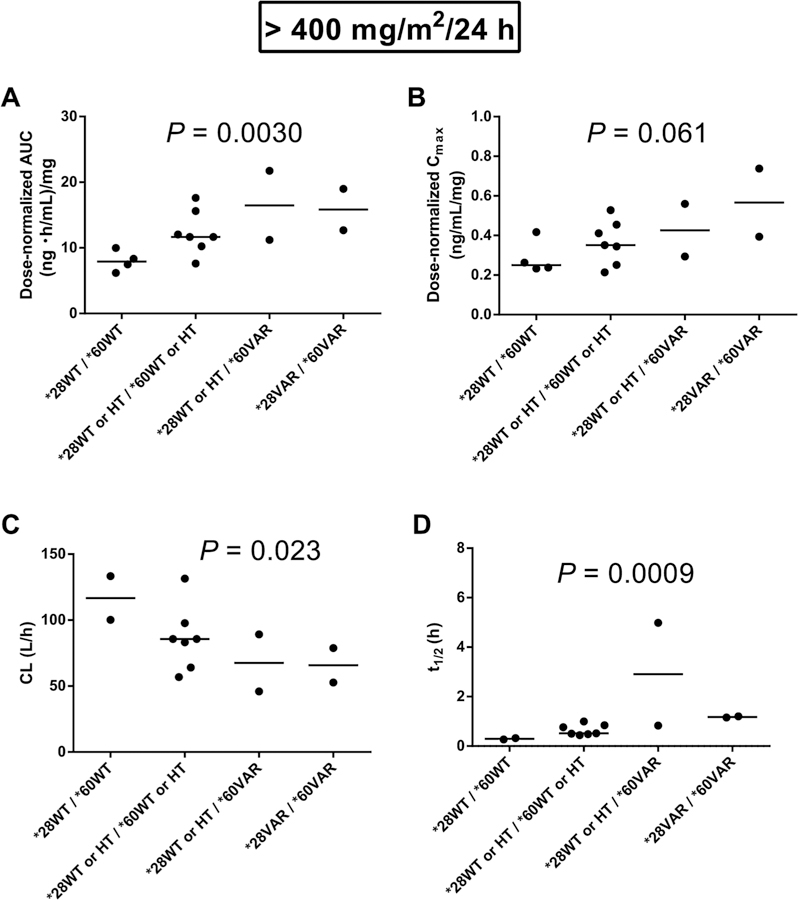
Effect of combined variants of uridine diphosphate glucuronosyltransferase I family polypeptide A I (UGTIAI)* 28 and 60* on belinostat pharmacokinetics after exclusion of the 400mg/m2/24h does level in the trial of belinostat (400,500,600, or 800 mg/m2/24h, 48 hour continuous influsion in combination with cisplatin and etoposide. (A) UGTIAI vs does-normalized area under the plasma concentration-time curve (AUC) excluding 400mg/m2/24h (n=15). (B) UGTIAI versus does-normalized maximum plasma concentration (Cmax) excluding 400 mg/m2/24h (n=15). (C) UGTIAI versus total body clearance (CL) excluding 400mg/m2/24h(n=13). (D) UGTIAI versus elimination half-life (t1/2) excluding 400mg/m2/24h (n=13). P values were obtained using the jonckheere-Terpstra test for trend (α=.01 required for significance). WT, wild type; HT, heterozygous; VAR, homozygous.
Effects of UGTIAI Genotype on AcK in PBMCs
As a surrogate marker for the acetylating effects of belinostat, AcK fold change in PBMCs 12, 36, and 60 hours after the start of infusion relative to predose was calculated. As expected, belinostat administration induced global protein acetylation in PBMCs, and AcK fold change was highest 36 hours after the start of infusion (Figure 3A). Figures 3B-D show AcK fold change at this point in PBMCs stratified per genotype (UGT1A1* 28, UGT1AJ1* 60, and both variants combined). AcK fold change in PBMCs tended to be increased in carriers of UGT1A1* 28 alone (P = .075; Figure 3B) and in combination with UGT1A1* 60 (P = .094; Figure 3D), the latter suggesting that higher belinostat plasma concentrations lead to greater HDAC inhibition in these patients. AcK fold changes were not significantly associated with genotype after exclusion of the 400 mg/m2/24 h dose level (data not shown).
Figure 3.
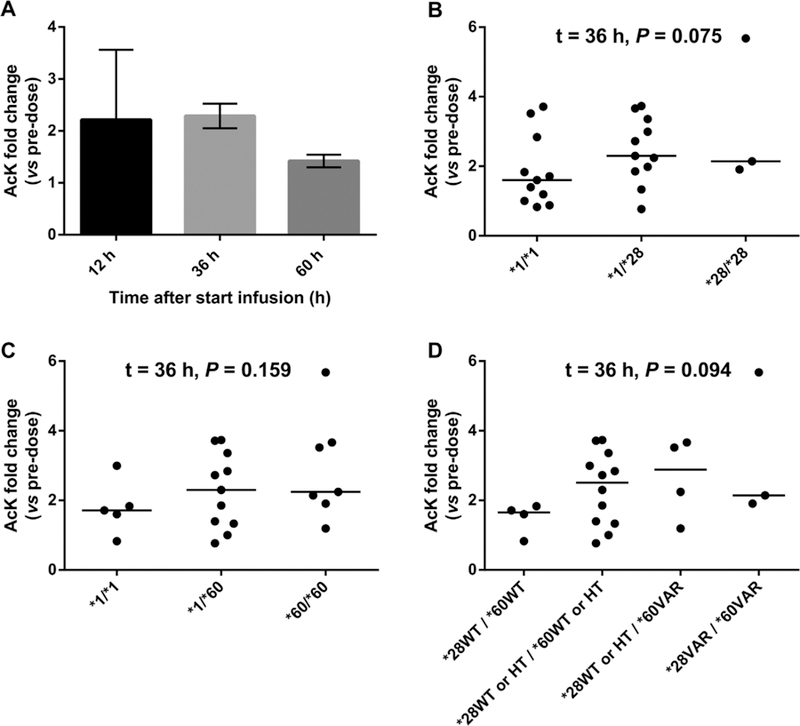
Effects of uridine diphosphate glucuronosyltransferase I family, polypeptide A I (UGTIAI) genotype status on the fold change (relative to predose) of global protein lysine acetylation (AcK) i n peripheral blood mononuclear cells (PBMCs) in patients receivi ng belinostat (400, 500, 600, or 800 mg/m2/24 h, 48-hour continuous infusion) in combination with cisplatin and etoposide. (A) Average (± standard deviation) AcK fold change i n PBMCs 1 2, 36, and 60 hours post-start of beli nostat infusion. (B) Effect of UGTIAI *28 on AcK fold change in PBMCs (n = 25). (C) Effect of UGTIAI *60 on AcK fold change i n PBMCs (n = 23). (D) Combined effect of UGTIAI *28 and UGTIAI *60 on AcK fold change i n PBMCs (n = 23). P values were obtained using the Jonckheere-Terpstra test for trend (α =.0 I required for significance). WT, wild type; HT, heterozygous; VAR, homozygous.
UGTIAI Genotype Versus Beli nostat-Related Toxicities
Table 3 shows associations between UGTJAJ genotype and the incidence of belinostat-related toxicities. Patients carrying 1 or 2 *28 alleles tended to have a progressively increased risk for grades 3–4 neutropenia (P = .045) and thrombocytopenia (P = .038), and ∆QTc values were marginally nonsignificantly increased compared with UGT1A1* 28 wild types (P = .075). The UGT1A1* 28 genotype did not significantly affect the incidence of grades 3–4 lymphocytopenia, nausea, vomiting, and fatigue (P > .01). UGT1A1* 60 was significantly associat ed with an increased incidence of grades 3–4 thrombocytopenia (P = .0072). No other significant associations with toxicities were found for this genotype (P > .01). Combined analysis of UGT1A1* 28 and UGT1A1* 60 showed a significant association between genotype and grades 3–4 thrombocytopenia (P = .0081) and a trend toward an increased risk for grades 3–4 neutropenia (P = .063). Supplemental Table S3 shows the incidence of the 2 most significant toxicities, thrombocytopenia and neutropenia, by genotype (UGT1A1* 28, UGT1A1* 60, and both mutations combined) and by belinostat dose (400, 500, 600, or 800 mg/m2/24h).
Table 3.
Relationship Between Uridine Diphosphate Glucuronosyltransferase I Family, Polypeptide A I (UGTIAI) Genotype and Toxicities During Cycle I in the BPE Trial
| UGT1A1*28 | UGT1A1*60a | ||||||||||||||||||||||||||||||
|---|---|---|---|---|---|---|---|---|---|---|---|---|---|---|---|---|---|---|---|---|---|---|---|---|---|---|---|---|---|---|---|
| Genotype | Grade | Pb | Grade | Pb | |||||||||||||||||||||||||||
| 0 – 2 (n) | 3 – 4 (n) | 0 – 2 (n) | 3 – 4 (n) | ||||||||||||||||||||||||||||
| Lymphocytopenia | |||||||||||||||||||||||||||||||
| *1/*1 | 4 | 7 | 0.75 | *1/*1 | 1 | 4 | 0.76 | ||||||||||||||||||||||||
| *1/*28 | 2 | 9 | *1/*60 | 4 | 7 | ||||||||||||||||||||||||||
| *28/*28 | 1 | 2 | *60/*60 | 1 | 6 | ||||||||||||||||||||||||||
| Neutropenia | |||||||||||||||||||||||||||||||
| *1/*1 | 8 | 3 | 0.045 | *1/*1 | 4 | 1 | 0.088 | ||||||||||||||||||||||||
| *1/*28 | 6 | 5 | *1/*60 | 7 | 4 | ||||||||||||||||||||||||||
| *28/*28 | 0 | 3 | *60/*60 | 2 | 5 | ||||||||||||||||||||||||||
| Thrombocytopenia | |||||||||||||||||||||||||||||||
| *1/*1 | 8 | 3 | 0.038 | *11*1 | 5 | 0 | 0.0072 | ||||||||||||||||||||||||
| *1/*28 | 5 | 6 | *1/*60 | 5 | 6 | ||||||||||||||||||||||||||
| *28/*28 | 0 | 3 | *60/*60 | 1 | 6 | ||||||||||||||||||||||||||
| Grade | Pb | Grade | Pb | ||||||||||||||||||||||||||||
| 0 – 1 (n) | 2 – 3 (n) | 0 – 1 (n) | 2 – 3 (n) | ||||||||||||||||||||||||||||
| Nausea | |||||||||||||||||||||||||||||||
| *1/*1 | 9 | 2 | 0.73 | *1/*1 | 4 | 1 | 0.75 | ||||||||||||||||||||||||
| *1/*28 | 9 | 2 | *1/*60 | 9 | 2 | ||||||||||||||||||||||||||
| *28/*28 | 2 | 1 | *60/*60 | 5 | 2 | ||||||||||||||||||||||||||
| Fatigue | |||||||||||||||||||||||||||||||
| *1/*1 | 8 | 3 | 0.76 | *1/*1 | 3 | 2 | 1.00 | ||||||||||||||||||||||||
| *1/*28 | 7 | 4 | *1/*60 | 8 | 3 | ||||||||||||||||||||||||||
| *28/*28 | 2 | 1 | *60/*60 | 4 | 3 | ||||||||||||||||||||||||||
| Grade | Pb | Grade | Pb | ||||||||||||||||||||||||||||
| 0 (n) | 1– 3 (n) | 0 (n) | 1– 3 (n) | ||||||||||||||||||||||||||||
| Vomiting | |||||||||||||||||||||||||||||||
| *1/*1 | 9 | 2 | 0.44 | *11*1 | 5 | 0 | 1.00 | ||||||||||||||||||||||||
| *1/*28 | 10 | 1 | *1/*60 | 9 | 2 | ||||||||||||||||||||||||||
| *28/*28 | 3 | 0 | *60//*60 | 7 | 0 | ||||||||||||||||||||||||||
| ∆QTc (average QTc in cycle 1 - baseline QTc ) | |||||||||||||||||||||||||||||||
| Median (ms, range) | Pc | Median (ms, range) | Pc | ||||||||||||||||||||||||||||
| *1/*1 | 12 (−16 – 54) | 0.075 | *1/*1 | 15 (12 – 54) | 0.62 | ||||||||||||||||||||||||||
| *1/*28 | 15 (−7 – 45) | *1/*60 | 11 (−7 – 45) | ||||||||||||||||||||||||||||
| *28/*28 | 18 (17 – 49) | *60/*60 | 17 (−15 – 49) | ||||||||||||||||||||||||||||
| Excluding 400 mg/m2/24 h dose level, n=15 | |||||||||||||||||||||||||||||||
| UGT1A1*28 | UGT1A1*60 | ||||||||||||||||||||||||||||||
| Genotype | Grade | Pb | Grade | Pb | |||||||||||||||||||||||||||
| 0 – 2 (n) | 3 – 4 (n) | 0 – 2 (n) | 3 – 4 (n) | ||||||||||||||||||||||||||||
| Lymphocytopenia | |||||||||||||||||||||||||||||||
| *1/*1 | 2 | 6 | 1.00 | *1/*1 | 0 | 4 | 0.68 | ||||||||||||||||||||||||
| *1/*28 | 0 | 5 | *1/*60 | 2 | 5 | ||||||||||||||||||||||||||
| *28/*28 | 1 | 1 | *60/*60 | 1 | 3 | ||||||||||||||||||||||||||
| Neutropenia | |||||||||||||||||||||||||||||||
| *1/*1 | 7 | 1 | 0.051 | *1/*1 | 3 | 1 | 0.25 | ||||||||||||||||||||||||
| *1/*28 | 4 | 1 | *1/*60 | 7 | 0 | ||||||||||||||||||||||||||
| *28/*28 | 0 | 2 | *60/*60 | 1 | 3 | ||||||||||||||||||||||||||
| Thrombocytopenia | |||||||||||||||||||||||||||||||
| *1/*1 | 7 | 1 | 0.0076 | *1/*1 | 4 | 0 | 0.081 | ||||||||||||||||||||||||
| *1/*28 | 1 | 4 | *1/*60 | 3 | 4 | ||||||||||||||||||||||||||
| *28/*28 | 0 | 2 | *60/*60 | 1 | 3 | ||||||||||||||||||||||||||
| Grade | Pb | Grade | Pb | ||||||||||||||||||||||||||||
| 0 – 1 (n) | 2 – 3 (n) | 0 – 1 (n) | 2 – 3 (n) | ||||||||||||||||||||||||||||
| Nausea | |||||||||||||||||||||||||||||||
| *1/*1 | 6 | 2 | 0.70 | *1/*1 | 3 | 1 | 1.00 | ||||||||||||||||||||||||
| *1/*28 | 4 | 1 | *1/*60 | 6 | 1 | ||||||||||||||||||||||||||
| *28/*28 | 2 | 0 | *60/*60 | 3 | 1 | ||||||||||||||||||||||||||
| Fatigue | |||||||||||||||||||||||||||||||
| *1/*1 | 5 | 3 | 1.00 | *1/*1 | 3 | 1 | 0.30 | ||||||||||||||||||||||||
| *1/*28 | 3 | 2 | *1/*60 | 5 | 2 | ||||||||||||||||||||||||||
| *28/*28 | 1 | 1 | *60/*60 | 1 | 3 | ||||||||||||||||||||||||||
| 0 (n) | 1– 3 (n) | Pb | 0 (n) | 1– 3 (n) | Pb | ||||||||||||||||||||||||||
| Vomiting | |||||||||||||||||||||||||||||||
| *1/*1 | 6 | 2 | 0.37 | *1/*1 | 4 | 0 | 1.00 | ||||||||||||||||||||||||
| *1/*28 | 5 | 0 | *1/*60 | 5 | 2 | ||||||||||||||||||||||||||
| *28/*28 | 2 | 0 | *60/*60 | 4 | 0 | ||||||||||||||||||||||||||
| ∆QTc (average QTc in cycle 1- baseline QTc ) | |||||||||||||||||||||||||||||||
| Median (ms, range) | Pc | Median (ms, range) | Pc | ||||||||||||||||||||||||||||
| *1/*1 | 13 (−15 – 54) | 0.34 | *1/*1 | 19 (12 – 54) | 0.66 | ||||||||||||||||||||||||||
| *1/*28 | 17 (−7 – 45) | *1/*60 | 12 (−7 – 45) | ||||||||||||||||||||||||||||
| *28/*28 | 34 (18 – 49) | *60/*60 | 18 (−15 – 49) | ||||||||||||||||||||||||||||
| UGT1A1*28 and UGT1A1*60 combined, n = 23a | Excluding 400 mg/m2/24 h, n = 15 | ||||||||||||||||||||||||||||||
| Genotype | Grade | Pb | Grade | Pb | |||||||||||||||||||||||||||
| 0–2 (n) | 3 - 4 (n) | 0–2 (n) | 3 - 4 (n) | ||||||||||||||||||||||||||||
| Lymphocytopenia | |||||||||||||||||||||||||||||||
| *28 WT + *60 WT | 0 | 4 | 1.00 | 0 | 4 | 0.34 | |||||||||||||||||||||||||
| *28 WTIHT + *60 WTIHT | 5 | 7 | 2 | 5 | |||||||||||||||||||||||||||
| *28 WT/HT + *60 VAR | 0 | 4 | 0 | 2 | |||||||||||||||||||||||||||
| *28 VAR + *60 VAR | 1 | 2 | 1 | 1 | |||||||||||||||||||||||||||
| Neutropenia | |||||||||||||||||||||||||||||||
| *28 WT + *60 WT | 3 | 1 | 0.063 | 3 | 1 | 0.064 | |||||||||||||||||||||||||
| *28 WT/HT + *60 WT/HT | 8 | 4 | 7 | 0 | |||||||||||||||||||||||||||
| *28 WT/HT + *60 VAR | 2 | 2 | 1 | 1 | |||||||||||||||||||||||||||
| *28 VAR + *60 VAR | 0 | 3 | 0 | 2 | |||||||||||||||||||||||||||
| Thrombocytopenia | |||||||||||||||||||||||||||||||
| *28 WT + *60 WT | 4 | 0 | 0.0081 | 4 | 0 | 0.035 | |||||||||||||||||||||||||
| *28 WT/HT + *60 WT/HT | 6 | 6 | 3 | 4 | |||||||||||||||||||||||||||
| *28 WT/HT + *60 VAR | 1 | 3 | 1 | 1 | |||||||||||||||||||||||||||
| *28 VAR + *60 VAR | 0 | 3 | 0 | 2 | |||||||||||||||||||||||||||
| Grade | Pb | Grade | Pb | ||||||||||||||||||||||||||||
| 0 - 1 (n) | 2 - 3 (n) | 0 - 1 (n) | 2 - 3 (n) | ||||||||||||||||||||||||||||
| Nausea | |||||||||||||||||||||||||||||||
| *28 WT + *60 WT | 3 | 1 | 0.79 | 3 | 1 | 1.00 | |||||||||||||||||||||||||
| *28 WT/HT + *60 WT/HT | 10 | 2 | 6 | 1 | |||||||||||||||||||||||||||
| *28 WT/HT + *60 VAR | 3 | 1 | 1 | 1 | |||||||||||||||||||||||||||
| *28 VAR + *60 VAR | 2 | 1 | 2 | 0 | |||||||||||||||||||||||||||
| Fatigue | |||||||||||||||||||||||||||||||
| *28 WT + *60 WT | 3 | 1 | 0.82 | 3 | 1 | 0.30 | |||||||||||||||||||||||||
| *28 WT/HT + *60 WT/HT | 8 | 4 | 5 | 2 | |||||||||||||||||||||||||||
| *28 WT/HT + *60 VAR | 2 | 2 | 0 | 2 | |||||||||||||||||||||||||||
| *28 VAR + *60 VAR | 2 | 1 | 1 | 1 | |||||||||||||||||||||||||||
| 0 (n) | 1 - 3 (n) | Pb | 0 (n) | 1 - 3 (n) | Pb | ||||||||||||||||||||||||||
| Vomiting | |||||||||||||||||||||||||||||||
| *28 WT + *60 WT | 4 | 0 | 0.76 | 4 | 0 | 1.00 | |||||||||||||||||||||||||
| *28 WT/HT + *60 WT/HT | 10 | 2 | 5 | 2 | |||||||||||||||||||||||||||
| *28 WT/HT + *60 VAR | 4 | 0 | 2 | 0 | |||||||||||||||||||||||||||
| *28 VAR + *60 VAR | 3 | 0 | 2 | 0 | |||||||||||||||||||||||||||
| ∆QTc (average QTc in cycle 1 - baseline QTc ) | |||||||||||||||||||||||||||||||
| Median(ms, range) | Pc | Median (ms, range) | Pc | ||||||||||||||||||||||||||||
| *28 WT + *60 WT | 19 (12 – 54) | 0.93 | 19 (12 – 54) | 0.79 | |||||||||||||||||||||||||||
| *28 WT/HT + *60 WT/HT | 11.5 (−7 – 45) | 12 (−7 – 45) | |||||||||||||||||||||||||||||
| *28 WT/HT + *60 VAR | 11 (−15 – 17) | 1 (−15 – 17) | |||||||||||||||||||||||||||||
| *28 VAR + *60 VAR | 18 (17 – 49) | 34 (18 – 49) | |||||||||||||||||||||||||||||
WT, wild type; HT, heterozygous; VAR. homozygous.
n = 23; unable to determine UGTIAI * 60 genotype in 2 patients.
P values were obtained using the Cochran-Armitage trend test (α =.01 required for significance).
P values were obtained using Jonckheere-Terpstra test for trend (α =.0 I required for significance).
Exclusion of patients receiving 400 mg/m2/24h resulted in a significant assoc1atlon between the UGT1A1* 28 genotype and severe thrombocytopenia (P = .081). In addition, the incidence of grades 3–4 neutropenia (P = .064) and thrombocytopenia (P = .035) were increased in patients carrying combinations of UGT1A1* 28 and UGT1A1* 60 variants but did not reach statistical significance. The incidence of other toxicities was not significantly affected by genotype after exclusion of the lowest dose level (Table 3).
Discussion
This is the first report on the clinical effects of UGT1A1 polymorphisms on the PK, PD, and toxicities of belinostat. Taken together, the data suggest that, contrary to the package insert,1 both UGT1A1* 28 and UGT1A1* 60 should be ascertained prior to altering belinostat dose and that only patients receiving high doses of belinostat should be genotyped at these loci. Moreover, univariate analysis indicates that UGT1A1* 60 is a much stronger marker for interpatient belinostat pharmacokinetic differences than is UGT1A1* 28. Therefore, future clinical studies should account for both of these genotypes to reduce interpatient variability, and the package insert should be reconsidered because it is based on preclinical data alone.
Specifically, a model accounting for status of both UGT1A1* 28 and UGT1A1* 60 was typically better associated with the pharmacokinetics (eg, 2-fold greater AUC in patients homozygous for both UGT1A1* 28 and UGT1A1* 60), histone acetylation (eg, >2-fold increase of average AcK fold change in UGT1A1* 28- and UGT1A1* 60-homozygous patients) and severe hematological toxicities (eg, 100% of patients homozygous for UGT1A1* 28 and UGT1A1*60 suffered from grades 3–4 neutropenia and thrombocytopenia compared with 0%−25% of wild type patients) than were individual genotypes. We suggest that this was likely caused by both singlenucleotide polymorphisms independently contributing to a reduction in belinostat metabolism that results in greater plasma concentrations and drug exposure. Genotype-phenotype relationships were also strongest in patients receiving 500, 600, or 800 mg/m2/24 h. This finding has been observed by others studying irinotecan 14,15 and suggests that the glucuronidation rate is particularly important in patients receiving higher doses.
Analysis of the separate effects of UGT1A1* 28 and UGT1A1* 60 on belinostat PK indicated that at doses greater than 400 mg/m2/24 h, UGT1A1* 60 appeared to have a greater impact on belinostat PK than did UGT1A1* 28. UGT1A1* 60 variants were also associated with greater risk of severe thrombocytopenia, whereas carriers of UGT1A1* 28 variants had greater risk of ∆QTc prolongation and also experienced greater HDAC inhibition. Because both alleles are coinherited, it was not possible to test their effects in isolation in the present data set; therefore, these findings justify ascertaining both alleles simultaneously.
We therefore developed a population PK/PD model accounting for both the UGT1A1* 28 and UGT1A1* 60 genotypes to simulate optimal belinostat dose to achieve equivalent exposures.16 Based on this model, it was determined that patients who were wild type for both UGT1A1* 28 and UGT1A1* 60 or carriers of 1 copy of UGT1A1* 28 should receive a higher belinostat dose (600 mg/m2/24 h) than patients homozygous for UGT1A1* 28 or those with at least 1 copy of UGT1A1* 60 (400 mg/m2/24 h) to provide equivalent exposures of belinostat. These dose adjustments hopefully reduce the risk of belinostat-related toxicities in patients with impaired clearance of belinostat. The applicability of these dose recommendations will be prospectively evaluated in a genotype-directed expansion of the BPE trial. We expect that the results of this prospective trial will help to adjust the current dosing recommendation in the drug label of belinostat.
The significant UGT1A1 effects on PK and the lack ofa significant genotype-PD association at doses > 400 mg/ m2/24 h suggest that the PBMC data were not a strong biomarker, presumably because of small numbers of patients.16 However, toxicity associations are likely caused by differences in drug inactivation; therefore, the present data suggest that genotype directly affects PK but indirectly affects PD.
Etoposide has an overlapping toxicity profile with belinostat (eg, nausea/vomiting, leukocytopenia, thrombocytopenia) and is also a UGTlAl substrate. Therefore, the role of etoposide in contributing to the increased incidence of thrombocytopenia in patients carrying UGT1A1* 28 and UGT1A1* 60 cannot be completely ruled out. However, in contrast to belinostat, etoposide is metabolized by many more enzymes than UGTlAl, such as CYP3A4 and CYP3A5.17 In fact, etoposide is predominantly (44%) excreted unchanged, and less than 10% of the dose is glucuronidated.18 Therefore, we believe that the increased incidence of thrombocytopenia in UGT1A1 variant carriers was most likely attributable to the use of belinostat.
The dosing schedule of belinostat in the BPE trial (400, 500, 600, or 800 mg/m2/24 h, 48-hour CIVI) differs from standard belinostat administration, which is 1000 mg/m2 given as a 30-minute intravenous infusion on days 1–5 of a 21-day cycle. Therefore, the standard dose is higher, and it is given over a shorter period. The present study detected the UGT1A1-belinostat gene–drug interaction despite this lower dose and the potential confounding effects of etoposide. It is therefore reasonable to expect that the gene-drug interaction is more likely in patients treated with the standard dose, although there are no current data available in humans. This should add further concern that the present drug label, which is not based on clinical observations, includes UGT1A1*28 and not UGT1A1* 60 genotyping data.
In conclusion, this PG analysis showed that UGT1A1*28 and UGT1A1* 60 genotype status affected the risk of hematological toxicities of belinostat in the BPE trial. In addition, the impact of UGT1A1* 60 on belinostat PK was even greater than that of UGT1A1* 28 in this analysis, especially at doses > 400 mg/m2/24 h. Therefore, in addition to assessing UGT1A1* 28 status, UGT1A1* 60 status should also be assessed when making UGT1A1 genotype-based dose adjustments of belinostat to minimize the risk of toxicities.
Supplementary Material
Acknowledgments
Funding
This research was supported by the Intramural Research Program of the National Institutes of Health, National Cancer Institute, Center for Cancer Research.
Footnotes
Declaration of Conflicting Interests
No potential conflicts of interest were disclosed.
Presentation Elsewhere
This study was presented in part at the 2015 Annual Meeting of the American Society for Clinical Pharmacology and Therapeutics, March 3–7, 2015, New Orleans, Louisiana; at the AACR Annual Meeting 2015, April 18–22, 2015, Philadelphia, Pennsylvania; and as abstract (online only) for the 2015 ASCO Annual Meeting, May 29-June 2, 2015, Chicago, Illinois.
References
- 1.Spectrum Pharmaceuticals Inc. Full prescribing information Beleodaq http://www.accessdata.fda.gov/drugsatfda_docs/label/20l4/206256lbl.pdf.
- 2.Steele NL, Plumb JA, Vidal L, et al. A phase I pharmacokinetic and pharmacodynamic study of the histone deacetylase inhibitor belinostat in patients with advanced solid tumors. Clin Cancer Res 2008;14(3):804–810. [DOI] [PubMed] [Google Scholar]
- 3.Wang LZ, Ramirez J, Yeo W, et al. Glucuronidation by UGT1Al is the dominant pathway of the metabolic disposition of belinostat in liver cancer patients. PloS One 2013;8(1):e54522. [DOI] [PMC free article] [PubMed] [Google Scholar]
- 4.Bosma PJ, Chowdhury JR, Bakker C, et al. The genetic basis of the reduced expression of bilirubin UDP-glucuronosyltransferase I in Gilbert’s syndrome. N Engl J Med 1995;333(18):1171–1175. [DOI] [PubMed] [Google Scholar]
- 5.Lee JS, Wang J, Martin M, et al. Genetic variation in UGTI AI typical of Gilbert syndrome is associated with unconjugated hyperbilirubinemia in patients receiving tocilizumab. Pharmacogenet Genomics 2011. ;21(7):365–374. [DOI] [PubMed] [Google Scholar]
- 6.Innocenti F, Undevia SD, Iyer L, et al. Genetic variants in the UDPglucuronosyltransferase 1Al gene predict the risk of severe neutropenia of irinotecan. J Clin Oneal 2004;22(8): 1382–1388. [DOI] [PubMed] [Google Scholar]
- 7.Pfizer. Prescribing information Camptosar http://labeling.pfizer.com/ShowLabeling.aspx?id=533.
- 8.Innocenti F, Grimsley C, Das S, et al. Haplotype structure of the UDP-glucuronosyltransferase 1Al promoter in different ethnic groups. Pharmacogenetics 2002; 12(9):725–733. [DOI] [PubMed] [Google Scholar]
- 9.Sai K, Saeki M, Saito Y, et al. UGTI AI haplotypes associated with reduced glucuronidation and increased serum bilirubin in irinotecan-administered Japanese patients with cancer. Clin Pharmacol Ther 2004;75(6):501–515. [DOI] [PubMed] [Google Scholar]
- 10.Cecchin E, Innocenti F, D’Andrea M, et al. Predictive role of the UGTI AI, UGTI A7, and UGTI A9 genetic variants and their haplotypes on the outcome of metastatic colorectal cancer patients treated with fluorouracil, leucovorin, and irinotecan. J Clin Oneal 2009;27(15):2457–2465. [DOI] [PubMed] [Google Scholar]
- 11.Tzvetkov M, von Ahsen N. Pharmacogenetic screening for drug therapy: from single gene markers to decision making in the next generation sequencing era. Pathology 2012;44(2):166–180. [DOI] [PubMed] [Google Scholar]
- 12.Minami H, Sai K, Saeki M, et al. Irinotecan pharmacokinetics/pharmacodynamics and UGT1A genetic polymorphisms in Japanese: roles of UGT1A1 *6 and ‘28. Pharmacogenet Genomics 2007; 17(7):497–504. [DOI] [PubMed] [Google Scholar]
- 13.Giaccone G, Rajan A, Berman A, et al. Phase II study of belinostat in patients with recurrent or refractory advanced thymic epithelial tumors. J Clin Oneal 2011;29(15):2052–2059. [DOI] [PMC free article] [PubMed] [Google Scholar]
- 14.Hu ZY, Yu Q, Pei Q, Guo C. Dose-dependent association between UGT1Al *28 genotype and irinotecan-induced neutropenia: low doses also increase risk. Clin Cancer Res 2010;16(15): 3832–3842. [DOI] [PubMed] [Google Scholar]
- 15.Hoskins JM, Goldberg RM, Qu P, Ibrahim JG, McLeod HL. UGT1Al *28 genotype and irinotecan-induced neutropenia: dose matters. J Natl Cancer Inst 2007;99( 17):1290–1295. [DOI] [PubMed] [Google Scholar]
- 16.Peer CJ, Goey AK, Sissung TM, et al. UGT1A1 genotypedependent dose adjustment of belinostat in patients with advanced cancers using population pharmacokinetic modeling and simulation. J Clin Pharmacol [DOI] [PMC free article] [PubMed] [Google Scholar]
- 17.Yang J, Bogni A, Schuetz EG, et al. Etoposide pathway. Pharmacogenet Genomics 2009;19(7):552–553. [DOI] [PMC free article] [PubMed] [Google Scholar]
- 18.Bristol-Myers Squibb Company. Package insert Etopophos http://packageinserts.bms.corn/pi/pi_etopophos.pdf.
Associated Data
This section collects any data citations, data availability statements, or supplementary materials included in this article.