Abstract
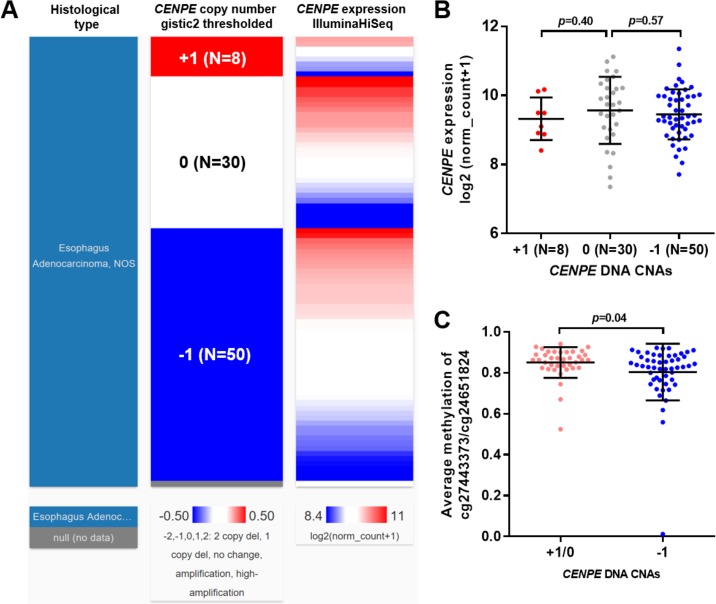
Centrosome-associated protein E (CENPE) is a plus end-directed kinetochore motor protein, which plays a critical role in mitosis. In this in silico study, using data from the Cancer Genome Atlas-Esophageal Carcinoma (TCGA-ESCA), we analyzed the expression profile of CENPE mRNA in esophageal squamous cell carcinoma (ESCC) and adenocarcinoma (EA), its independent prognostic value and the potential mechanisms of its dysregulation in EA. Results showed that both ESCC and EA tissues had significantly elevated CENPE expression compared with their respective adjacent normal tissues. However, Kaplan-Meier survival curves showed that high CENPE was associated with unfavorable OS in EA. Univariate and multivariate analysis confirmed that CENPE expression was an independent indicator of unfavorable OS in EA patients, as a continuous variable (HR: 1.861, 95%CI: 1.235–2.806, p = 0.003) or as categorical variables (HR: 2.550, 95%CI: 1.294–5.025, p = 0.007). However, CENPE expression had no prognostic value in ESCC. Compared with the methylation status in normal samples, 3 CpG sites were hypomethylated (cg27388036, cg27443373, and cg24651824) in EA, among which two sites (cg27443373 and cg24651824) showed moderately negative correlation with CENPE expression. In addition, we also found that although heterozygous loss (-1) was frequent in EA (50/88, 56.8%), it was not necessarily associated with decreased CENPE expression compared with the copy neutral (0) cases. The methylation of the -1 group was significantly lower than that of the +1/0 group (p = 0.04). Based on these findings, we infer that CENPE upregulation in EA might serve as a valuable indicator of unfavorable OS. The methylation status of cg27443373 and cg24651824 might play a critical role in modulating CENPE expression.
Introduction
Esophageal squamous cell carcinoma (ESCC) and adenocarcinoma (EA) are the two major histologic types of malignant esophageal neoplasms [1]. Although ESCC accounts for most (about 90%) of the esophageal neoplasms, the incidence rate of EA has been rising in some western countries due to the growing prevalence of some EA associated risk factors, such as gastroesophageal reflux, smoking and obesity [CENPE]. Since early esophageal cancer may be totally asymptomatic, most of the patients were diagnosed with advanced tumors. The overall 5-year survival rate is lower than 20% in both ESCC and EA in the United States [1].
These two subtypes have distinct origins and molecular mechanisms [2, 3]. ESCC begins in flat cells lining the esophagus, while EA usually occurs just above the esophagogastric junction and begins in the cells of mucus-secreting glands. One recent study showed that ESCC showed stronger molecular similarities to SCCs in other organs, while EA presented a strong molecular resemblance to chromosomally unstable gastric adenocarcinoma [3]. Therefore, although the ESCC and EA have similar 5-year survival rate, it is necessary to explore the specific prognostic indicators in different subtypes of esophageal cancer.
Centrosome-associated protein E (CENPE) is a plus end-directed kinetochore motor protein, which belongs to the kinesin-7 subfamily and plays a critical role in mitosis [4]. CENPE accumulates in the G2 phase of the cell cycle and plays an essential role in transporting pole-proximal chromosomes to the spindle equator during prometaphase [5], the formation of stable kinetochore-microtubule attachment during metaphase [6], and the microtubule plus-end elongation [7]. Knockdown of CENPE results in increased frequency of chromosome misalignment, lagging chromosomes and subsequent delayed mitotic progression in normal cells [8, 9].
In human tissues, CENPE mRNA expression shows a strong association with cell proliferation [10]. CENPE was aberrantly upregulated in multiple types of cancer and was associated with facilitated cell-cycle progression and tumor cell growth, such as in epithelial ovarian cancer [11], prostate cancer [12] and triple-negative breast cancer [13]. However, in esophageal cancer, the expression profile of CENPE mRNA and its prognostic value have not been explored.
In this study, using data from the Cancer Genome Atlas-Esophageal Carcinoma (TCGA-ESCA), we analyzed the expression profile of CENPE mRNA in ESCC and EA, its independent prognostic value in terms of overall survival (OS) and the potential mechanisms of its dysregulation in EA.
Materials and methods
This study was an in silico retrospective analysis based on data from publicly available databases. Thus no ethical approval and patient consent are required.
Secondary analysis using data from TCGA-ESCA
The clinicopathological, genetic and survival data in TCGA-ESCA were obtained by using the UCSC Xena browser (https://xenabrowser.net/). In this dataset, 96 cases of ESCC (with 3 cases of adjacent normal tissues) and 89 cases of EA (with 15 cases of adjacent normal tissues) were included. The information of the patients, such as their age, gender, race, ethnicity, and vital status was available in https://portal.gdc.cancer.gov/projects/TCGA-ESCA. None of the patients received neoadjuvant treatment. The flowchart showing data availability among the patients was given in S1 Fig.
The clinicopathological, survival and genetic data, including age at diagnosis, gender, histologic grade, smoking history, reflux history, Barrett’s esophagus, pathologic stage, history of esophageal cancer, radiation therapy, postoperative drug therapy, residual tumor after primary therapy, primary therapy outcome, recurrence status, living status, OS in days, RNA-seq data of CENPE expression, CENPE DNA copy number alterations (CNAs) (calculated by gene-level thresholded Genomic Identification of Significant Targets in Cancer 2.0 (GISTIC2)) and CENPE DNA methylation (Methylation450k) (measured by Infinium HumanMethylation450 BeadChip) were downloaded. CNAs were defined as homozygous deletion (-2), heterozygous loss (-1), copy-neutral (0), low-level copy gain (+1), high-level amplification (+2).
Immunohistochemistry (IHC) staining of CENPE
Human paraffin-embedded EA/adjacent normal tissue array was purchased from Alenabio (ES781, Xian, China), which includes 13 cases of EA and 10 cases of adjacent normal tissues. Briefly, the tissue array was treated with 3% H2O2 for 10 min to inactivate tissue peroxidases were inactivated. Then, the array was pre-treated with antibody diluent solution containing 1% BSA, followed by 20 min incubation at room temperature with primary antibodies against CENPE (1:100 dilution, 28142-1-AP, Proteintech Group, Wuhan, China). Labeling was accomplished with biotinylated secondary antibodies (SP-9001, ZSGB-BIO, Beijing, China) and DAB kit (ZSGB-BIO), and counterstained with hematoxylin for 5 min. Protein staining score was given by two experienced pathologists, who do not have authorship in this study. The scoring system follows the method recommended by the Human Protein Atlas (HPA), with regard to staining intensity (negative, weak, moderate or strong) and fraction of stained cells (<25%, 25–75% or >75%) [14, 15]. The combination of intensity and fractions is automatically converted into protein expression level scores, which including not detected, low, medium and high.
In silico analysis using cBioPortal for cancer genomics and string
The genes strongly co-expressed with CENPE in EA (Pearson’s r≥0.6 and Spearman’s r≥0.6) were identified using cBioPortal for Cancer Genomics [16]. Then, the potential molecular interactions between these genes were identified using String 10.5 (https://string-db.org/). By setting 0.4 as the minimum required interaction score.
Statistical analysis
Statistical analysis was performed by using GraphPad Prism 6.0 (GraphPad Inc., La Jolla, CA, USA) or SPSS 19.0 software package (SPSS Inc., Chicago, IL, USA). Welch’s unequal variances t-test was performed to examine the difference in CENPE expression or DNA methylation. The association between CENPE expression and the clinicopathological parameters in EA patients was assessed by using the Chi-squared test by two-sided Fisher’s exact test. Kaplan-Meier curves of OS and RFS were generated using GraphPad Prism 6.0. The best cutoff (Youden Index) of CENPE expression/CENPE DNA methylation in receiver operating characteristic curve (ROC) for death and recurrence detection were identified and used as the cutoff in Kaplan-Meier survival curves. Log-rank test was conducted to examine the significance of the difference between the curves. Univariate and multivariate Cox regression models were used to evaluate the prognostic significance of CENPE expression, as category variables or as a continuous variable. Linear regression analysis was performed to assess the correlation between CENPE expression and the methylation of the CpG sites in its DNA. p<0.05 was considered statistically significant.
Results
CENPE was significantly upregulated in both ESCC and EA tissues compared with their respectively adjacent normal tissues
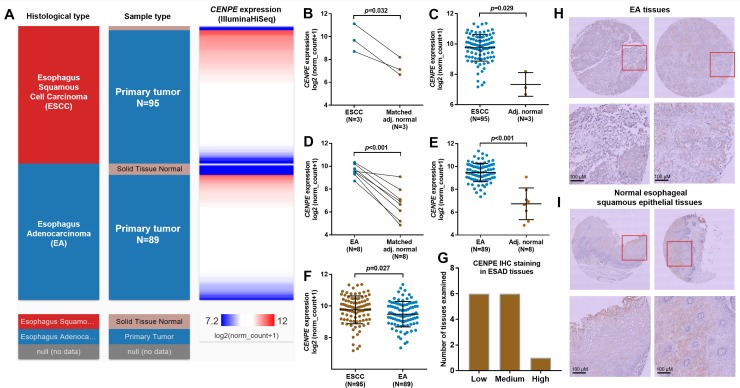
Using RNA-seq data in TCGA-ESCA, we examined the expression profile of CENPE RNA in ESCC and EA tissues compared with their respectively adjacent normal tissues (Fig 1A). Statistical analysis showed that both ESCC and EA tissues had significantly elevated CENPE expression compared with matched adjacent normal tissues (p = 0.032 and p<0.001 respectively) (Fig 1B and 1D). These trends were confirmed between all available cancer tissues and the adjacent normal tissues (p = 0.029 and p<0.001 respectively) (Fig 1C and 1E). Besides, CENPE expression was higher in ESCC tissues than in EA tissues (Fig 1F). Then, using commercially available EA tissue array, we examined the expression of CENPE in 13 cases of EA tissues by IHC staining. Results showed that all the EA tissues had positive CENPE expression, which include 6 low, 6 medium and 1 high expression (Fig 1G). Representative images showed that CENPE had both nuclear and cytoplasm distribution in EA cells (Fig 1H). Although EA does not arise from esophageal squamous epithelial cells, available data in the HPA showed that they have positive CENPE expression [14, 15]. In this study, we confirmed CENPE expression in the normal cells, which help to serve as a positive control of the primary antibody used (Fig 1I).
Fig 1. CENPE was significantly upregulated in both ESCC and EA tissues compared with their respective adjacent normal tissues.
A. A heatmap showing the expression of CENPE in both ESCC and EA tissues and their respective adjacent normal tissues. B-F. Comparison of CENPE expression between ESCC/EA and the matched adjacent normal tissues (B and D), between all ESCC/EA tissues and the adjacent normal tissues (C and E) and between ESCC and EA tissues (F). G. CENPE IHC staining score summary in the 13 cases of EA tissues examined. H-I. Representative images of CENPE staining in EA (H) and normal esophageal squamous epithelial tissues (I).
High CENPE was associated with unfavorable OS in EA, but not in ESCC patients
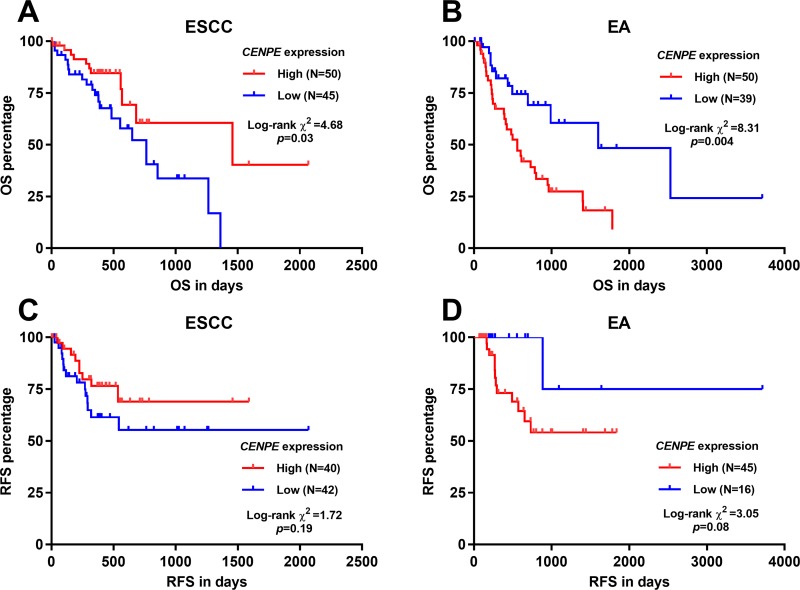
By generating Kaplan-Meier curves of OS, we assessed the association between CENPE expression and OS in ESCC and EA respectively. Results showed that under the best cutoff model, CENPE expression was associated with better OS in ESCC patients (Fig 2A, p = 0.03), but was associated with significantly shorter OS in EA patients (p = 0.004, Fig 2B). However, CENPE expression was not associated with RFS in either ESCC (Fig 2C, p = 0.19) or EA (p = 0.08) (Fig 2D).
Fig 2.
Kaplan-Meier curves of OS/RFS in ESCC (A) and EA (B) patients. ESCC (A and C) and EA (B and D) patients were divided into two groups by the best cutoff of CENPE expression.
CENPE expression was an independent prognostic indicator in terms of OS in EA
Then, we analyzed the association between CENPE expression and the clinicopathological parameters in EA patients (Table 1). Results showed that the high CENPE expression group was associated with a higher ratio of death compared to the low CENPE expression group (28/44 vs. 17/45, p = 0.02) (Table 1). However, no other associations were observed. In univariate analysis, we found that high histologic grade (G3), advanced pathologic stage and CENPE expression (as either a continuous variable or categorical variables) were associated with unfavorable OS in EA patients (Table 2). However, CENPE expression was not a risk factor of OS in ESCC patients in univariate analysis (p = 0.12) (S1 Table). Multivariate analysis confirmed that CENPE expression was an independent indicator of unfavorable OS in EA patients, no matter as a continuous variable (HR: 1.861, 95%CI: 1.235–2.806, p = 0.003) or as categorical variables (HR: 2.550, 95%CI: 1.294–5.025, p = 0.007) (Table 2). However, CENPE expression had no prognostic value in terms of RFS in either EA or ESCC (p = 0.611 and 0.765 respectively) (S2 Table).
Table 1. The association between CENPE expression and clinicopathological parameters in EA patients in TCGA-ESCA.
| Parameters | CENPE expression | p-value | ||
|---|---|---|---|---|
| High (N = 44) | Low (N = 45) | |||
| Age (Mean ± SD) | 66.18±1.73 | 67.51±1.89 | 0.61 | |
| Gender | Female | 6 | 6 | 1.00 |
| Male | 38 | 39 | ||
| Histologic grade | G1/G2 | 14 | 17 | 0.30 |
| G3 | 17 | 11 | ||
| No data | 13 | 17 | ||
| Barrett’s esophagus | No | 26 | 28 | 0.82 |
| Yes | 15 | 13 | ||
| No data | 3 | 4 | ||
| Smoking history | 2/3/4 | 23 | 27 | 0.81 |
| 1 | 12 | 12 | ||
| no data | 9 | 6 | ||
| Reflux history | No | 14 | 19 | 0.35 |
| Yes | 24 | 19 | ||
| No data | 6 | 7 | ||
| Pathologic stage | III/IV | 15 | 19 | 0.34 |
| I/II | 20 | 15 | ||
| Discrepancy/no data | 9 | 11 | ||
| History of esophageal cancer | No | 24 | 25 | 0.71 |
| Yes | 5 | 3 | ||
| No data | 15 | 17 | ||
| Radiation therapy | No | 32 | 36 | 0.73 |
| Yes | 5 | 4 | ||
| No data | 7 | 5 | ||
| Postoperative drug therapy | No | 29 | 37 | 0.11 |
| Yes | 8 | 3 | ||
| No data | 7 | 5 | ||
| Residual tumor | R0 | 29 | 30 | 1.00 |
| R1 | 4 | 4 | ||
| RX/no data | 11 | 11 | ||
| Primary therapy outcome | PD+SD | 3 | 6 | 0.44 |
| CR+PR | 14 | 12 | ||
| no data | 27 | 27 | ||
| Recurrence status | No | 23 | 25 | 0.76 |
| Yes | 7 | 6 | ||
| no data | 14 | 14 | ||
| Living Status | Living | 16 | 28 | 0.02 |
| Dead | 28 | 17 | ||
G1: well differentiated (low grade); G2: moderately differentiated (intermediate grade); G3: poorly differentiated (high grade). Smoking history: 1: lifelong non-smoker; 2: current smoker; 3. Current reformed smoker (for>15 yrs); 4. Current reformed smoker (for≤15 yrs). R0: No residual tumor; R1: Microscopic residual tumor; RX: The presence of residual tumor cannot be assessed. CR: complete response; PR: partial response; SD: stable disease; PD: progressive disease.
Table 2. Univariate and multivariate analysis of OS in EA patients in TCGA-ESCA.
| Parameters | Univariate analysis | Multivariate analysis | ||||||
|---|---|---|---|---|---|---|---|---|
| p | HR | 95%CI (lower/upper) |
p | HR | 95%CI (lower/upper) | |||
| CENPE as a continuous variable | ||||||||
| Age | 0.269 | 0.987 | 0.965 | 1.010 | ||||
|
Gender Female vs Male |
0.963 | 0.976 | 0.345 | 2.755 | ||||
|
Histologic grade G3 vs. G1/G2 |
0.018 | 2.357 | 1.157 | 4.804 | 0.068 | 2.020 | 0.950 | 4.296 |
|
History of esophageal cancer No vs. Yes |
0.907 | 1.062 | 0.392 | 2.875 | ||||
|
Barrett’s esophagus No vs. Yes |
0.873 | 0.949 | 0.503 | 1.794 | ||||
|
Pathologic stages III/IV vs. I/II |
0.002 | 3.353 | 1.579 | 7.119 | 0.001 | 3.854 | 1.753 | 8.475 |
|
Residual tumor No vs. Yes |
0.069 | 0.451 | 0.192 | 1.063 | ||||
|
Reflux History No vs. Yes |
0.759 | 1.114 | 0.560 | 2.215 | ||||
|
Smoking History Yes vs. No |
0.414 | 1.376 | 0.640 | 2.957 | ||||
|
Postoperative drug therapy No vs. Yes |
0.891 | 0.940 | 0.392 | 2.257 | ||||
|
Radiation therapy No vs. Yes |
0.581 | 1.339 | 0.475 | 3.776 | ||||
| Primary therapy outcome success SD+PD vs. CR+PR | 0.645 | 0.737 | 0.202 | 2.696 | ||||
| CENPE expression | 0.011 | 1.639 | 1.118 | 2.403 | 0.003 | 1.861 | 1.235 | 2.806 |
| CENPE as categorical variables | ||||||||
|
Histologic grade G3 vs. G1/G2 |
0.018 | 2.357 | 1.157 | 4.804 | 0.143 | 1.790 | 0.821 | 3.903 |
|
Pathologic stages III/IV vs. I/II |
0.002 | 3.353 | 1.579 | 7.119 | <0.001 | 4.178 | 1.902 | 9.179 |
| CENPE expression High vs. Low | 0.027 | 2.007 | 1.084 | 3.713 | 0.007 | 2.550 | 1.294 | 5.025 |
CENPE expression was negatively correlated with its DNA methylation in EA
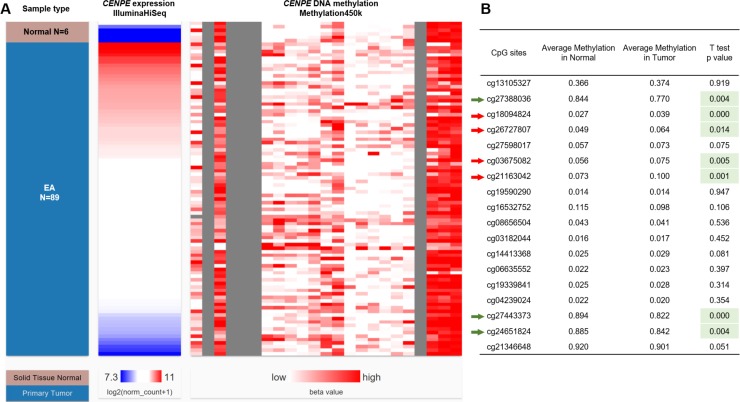
CENPE DNA methylation status of 6 normal samples and 98 EA samples was examined by Infinium HumanMethylation450 BeadChip, which covered 18 CpG sites in CENPE DNA (Fig 3A). Compared with the methylation status in the 6 normal samples, 4 sites (cg18094824, cg26727807, cg03675082 and cg21163042) were hypermethylated (red arrows, Fig 3B), while 3 sites were hypomethylated (cg27388036, cg27443373, and cg24651824) in EA (green arrows, Fig 3B). Noticeably, the overall methylation status of the 4 hypermethylated sites was still relatively low (methylation value ≤0.1) in EA samples (Fig 3B). In comparison, the 3 hypomethylated sites were highly methylated in normal tissues (methylation value >0.84) (Fig 3B).
Fig 3. Comparison of CENPE methylation between EA and the adjacent normal tissues.
A-B. A heatmap (B) and a statistical comparison summary (B) showing the correlation between CENPE expression and the methylation status of the 18 CpG sites in CENPE DNA in EA (N = 89) and adjacent normal tissues (N = 6).
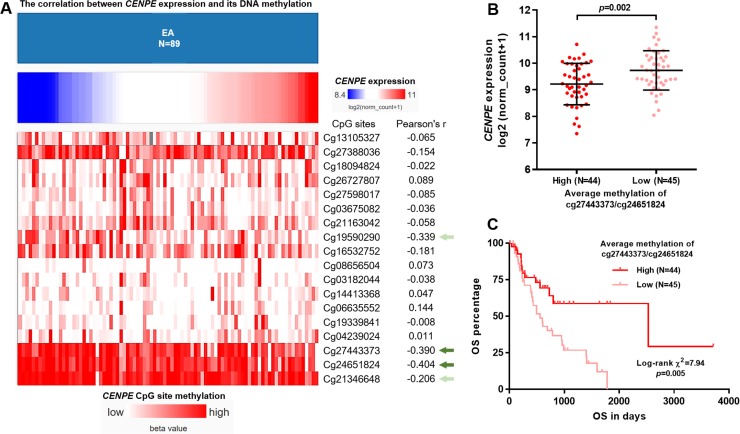
By performing linear regression analysis, we identified the correlation (represented as Pearson’s r-value) between CENPE expression and the methylation status of the 18 CpG sites in EA samples (Fig 4A). Only the methylation level of 4 CpG sites (cg19590290, cg27443373, cg24651824 and cg21346648) were associated with CENPE expression (absolute Pearson’s r≥0.2) (Fig 4A, green arrows). Actually, the methylation level of 4 CpG sites were all negatively correlated with CENPE expression, among which cg27443373 and cg24651824 were the significantly hypomethylated sites compared with normal tissues (Fig 4A, dark green arrows). These findings suggest that these two CpG sites might play a critical role in regulating CENPE transcription in EA. By divided the patients into methylation-high and methylation-low groups, according to the best cutoff of the methylation of cg27443373 and cg24651824, we found that the methylation-low group had significantly higher CENPE expression (Fig 4B, p = 0.002), as well as significantly worse OS (Fig 4C, p = 0.005).
Fig 4. CENPE expression was negatively correlated with its DNA methylation in EA.
A. A heatmap showing the correlation (represented as Pearson’s r-value) between CENPE expression and the methylation status of the 18 CpG sites in CENPE DNA in EA. B. Comparison of CENPE expression between methylation-high and methylation-low groups, according to the median average methylation of cg27443373 and cg24651824. C. Kaplan-Meier curves of OS of methylation-high and methylation-low groups.
CENPE expression in EA was not related to its CNAs
By examining CEPNE DNA CNAs in EA patients with copy number data available (N = 88), we observed that heterozygous loss (-1) was frequent in EA (50/88, 56.8%) (Fig 5A). However, the copy number loss was not necessarily associated with decreased CENPE expression compared with the copy neutral (0) cases (Fig 5B). By checking the average methylation of cg27443373 and cg24651824 between +1/0 and -1 groups, we found that the methylation of the -1 group was significantly lower than that of the +1/0 group (p = 0.04) (Fig 5C). These results suggest that hypomethylation might be an adaptive mechanism to compensate the influence of DNA loss on CENPE expression in EA.
Fig 5. CENPE expression in EA was not related to its CNAs.
A-B. A heatmap (B) and a statistical comparison summary (B) showing the correlation between CENPE expression and the CENPE copy number alterations in EA (N = 88). C. Comparison of the average methylation of cg27443373 and cg24651824, between amplification (+1)/copy neutral (0) cases and heterozygous loss (-1) group.
In silico analysis of the potential molecular actions between CENPE and its co-expressed genes in EA
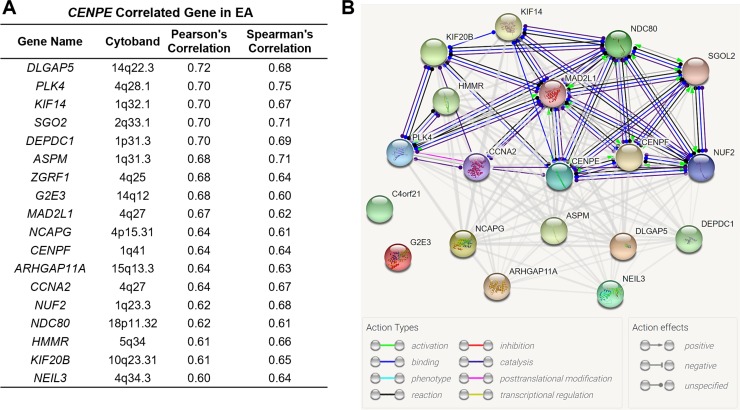
Using the cBioPortal for cancer genomics, we identified 18 genes that were strongly (Pearson's r≥0.6 and Spearmen’s r≥0.6) co-expressed with CENPE in EA (Fig 6A). To explore their potential molecular associations, we performed in silico analysis using String 10.5. Results showed that CENPE might interact with KIF20B, KIF14, MAD2L1, NDC80, SGOL2, CENPF and NUF2 (Fig 6B).
Fig 6. In silico analysis of the potential molecular actions between CENPE and its co-expressed genes in EA.
A. The genes that were strongly (Pearson's r≥0.6 and Spearmen’s r≥0.6) co-expressed with CENPE in EA. B. The potential molecular associations between CENPE and its co-expressed genes.
Discussion
Accurate prognostic prediction has important clinical implications since it provides fundamental information for treatment decisions and follow-up schedule. Usually, patients with favorable prognosis do not need intensive adjuvant therapy or routine follow-up. In comparison, patients with predicted unfavorable prognosis might need intensive adjuvant treatment and follow-up in a higher frequency [17]. In this study, we observed that CENPE was significantly upregulated in both ESCC and EA compared to that in their respective adjacent normal tissues. Kaplan-Meier curves showed that high CENPE expression was associated with poor OS in EA patients. The following univariate and multivariate analysis confirmed that CENPE expression was an independent indicator of unfavorable OS in EA patients, as a continuous variable (HR: 1.861, 95%CI: 1.235–2.806, p = 0.003) or as categorical variables (HR: 2.550, 95%CI: 1.294–5.025, p = 0.007). Based on these findings, we infer that CENPE expression might be a valuable prognostic biomarker in terms of OS in EA patients. However, we did not find significant prognostic value of CENPE expression in terms of RFS in either EA or ESCC patients.
CENPE plays a critical role in the cell-cycle progression from metaphase to anaphase [5, 18]. In breast cancer, CENPE upregulation was strongly and negatively correlated with disease-specific survival [13]. The progression of castration-resistant prostate cancer cells to G2-M phase is heavily dependent on CENPE [12]. Due to its critical regulative effects on cell cycle progression in cancer cells, this gene has been considered as a promising target for anticancer drugs [10, 19]. Inhibition of CENPE expression or selectively inhibiting CENPE motor function results in mitotic arrest due to polar chromosomes and following cell apoptosis [13]. These mechanisms help to explain why CENPE expression was associated with unfavorable survival in EA patients. In this study, we identified the genes that were highly co-expressed with CENPE in EA and also explored their potential molecular interactions. Among these genes, MAD2L1 and CENPF are oncogenes in esophageal carcinoma [20, 21]. CCNA2 is a cell cycle regulatory gene and its dysregulation is associated with esophageal tumorigenesis [22]. However, the potential involvement of these genes in EA and their regulatory network are largely unknown and thus need to be explored in the future.
CENPE expression might be induced under a stressful environment in cancer cells. For example, in triple-negative breast cancer cells, CENPE expression was upregulated after Docetaxel treatment [13]. In castration-resistant prostate cancer cells, the reprogramming of the binding of lysine-specific demethylase 1A (LSD1), which is a histone-modifying enzyme responsible for demethylation of histone H3 lysine 4 (H3K4), results in an increase of AR binding at the CENPE promoter and subsequently enhanced CENPE transcription [12]. These results suggest that epigenetic regulation might be a mechanism of CENPE dysregulation in cancer cells. In fact, epigenetic regulations, such as DNA methylation, histone acetylation, and up-regulation/down-regulation of genes by non-codling RNAs, have been characterized as important epigenetic regulations related to dysregulated tumor suppressors and other growth regulating genes during the progression of EA [23, 24]. In this study, by checking the methylation status of 18 CpG sites in CENPE DNA in EA, we found that three CpG sites with hypomethylated in EA, among which two sites (cg27443373 and cg24651824) showed moderately negative correlation with CENPE expression. Besides, the high methylation group was associated with better OS. In addition, we found that although heterozygous loss (-1) was frequent in EA (50/88, 56.8%), it was not necessarily associated with decreased CENPE expression. The significantly lower level of the average methylation of cg27443373 and cg24651824 in this group provides a plausible explanation of this phenomenon. Based on these findings, we infer that hypomethylation of certain CpG sites in CENPE DNA might be an important epigenetic mechanism of upregulated CENPE in EA.
This study also has some limitations. Firstly, CENPE protein expression in EA samples is lacking. Therefore, based on findings in this study, we can only infer the association between CENPE RNA expression and OS in EA patients. Secondly, we only confirmed the association between methylation and CENPE expression in EA. Therefore, we could not exclude the possible influence of other epigenetic regulations on CENPE expression. In the future, it is meaningful to explore other potential mechanisms modulating CENPE expression, as well as their involvement in the progression of EA.
Conclusion
CENPE upregulation in EA might serve as a valuable indicator of unfavorable OS. The methylation status of cg27443373 and cg24651824 might play a critical role in modulating CENPE expression.
Supporting information
(JPG)
(DOCX)
(DOCX)
Data Availability
All relevant data are within the paper and its Supporting Information files.
Funding Statement
This work was supported by Department of Science and Technology of Sichuan Province, 30504010336, Ming Zeng; Sichuan Academy of Medical Sciences & Sichuan Provincial People’s Hospital, 30305031017P, Ming Zeng. The funders had no role in study design, data collection and analysis, decision to publish, or preparation of the manuscript.
References
- 1.Rustgi A, El-Serag HB. Esophageal carcinoma. N Engl J Med. 2015;372(15):1472–3. 10.1056/NEJMc1500692 . [DOI] [PubMed] [Google Scholar]
- 2.Greenawalt DM, Duong C, Smyth GK, Ciavarella ML, Thompson NJ, Tiang T, et al. Gene expression profiling of esophageal cancer: comparative analysis of Barrett's esophagus, adenocarcinoma, and squamous cell carcinoma. Int J Cancer. 2007;120(9):1914–21. 10.1002/ijc.22501 . [DOI] [PubMed] [Google Scholar]
- 3.Cancer Genome Atlas Research N, Analysis Working Group: Asan U, Agency BCC, Brigham, Women's H, Broad I, et al. Integrated genomic characterization of oesophageal carcinoma. Nature. 2017;541(7636):169–75. 10.1038/nature20805 [DOI] [PMC free article] [PubMed] [Google Scholar]
- 4.Hou S, Li N, Zhang Q, Li H, Wei X, Hao T, et al. XAB2 functions in mitotic cell cycle progression via transcriptional regulation of CENPE. Cell Death Dis. 2016;7(10):e2409 10.1038/cddis.2016.313 [DOI] [PMC free article] [PubMed] [Google Scholar]
- 5.Wood KW, Sakowicz R, Goldstein LS, Cleveland DW. CENP-E is a plus end-directed kinetochore motor required for metaphase chromosome alignment. Cell. 1997;91(3):357–66. . [DOI] [PubMed] [Google Scholar]
- 6.Gudimchuk N, Vitre B, Kim Y, Kiyatkin A, Cleveland DW, Ataullakhanov FI, et al. Kinetochore kinesin CENP-E is a processive bi-directional tracker of dynamic microtubule tips. Nat Cell Biol. 2013;15(9):1079–88. 10.1038/ncb2831 [DOI] [PMC free article] [PubMed] [Google Scholar]
- 7.Vitre B, Gudimchuk N, Borda R, Kim Y, Heuser JE, Cleveland DW, et al. Kinetochore-microtubule attachment throughout mitosis potentiated by the elongated stalk of the kinetochore kinesin CENP-E. Mol Biol Cell. 2014;25(15):2272–81. 10.1091/mbc.E14-01-0698 [DOI] [PMC free article] [PubMed] [Google Scholar]
- 8.Wood KW, Chua P, Sutton D, Jackson JR. Centromere-associated protein E: a motor that puts the brakes on the mitotic checkpoint. Clin Cancer Res. 2008;14(23):7588–92. 10.1158/1078-0432.CCR-07-4443 . [DOI] [PubMed] [Google Scholar]
- 9.Tame MA, Raaijmakers JA, Afanasyev P, Medema RH. Chromosome misalignments induce spindle-positioning defects. EMBO Rep. 2016;17(3):317–25. 10.15252/embr.201541143 [DOI] [PMC free article] [PubMed] [Google Scholar]
- 10.Olziersky AM, Labidi-Galy SI. Clinical Development of Anti-mitotic Drugs in Cancer. Adv Exp Med Biol. 2017;1002:125–52. 10.1007/978-3-319-57127-0_6 . [DOI] [PubMed] [Google Scholar]
- 11.Ju W, Yoo BC, Kim IJ, Kim JW, Kim SC, Lee HP. Identification of genes with differential expression in chemoresistant epithelial ovarian cancer using high-density oligonucleotide microarrays. Oncol Res. 2009;18(2–3):47–56. . [DOI] [PubMed] [Google Scholar]
- 12.Liang Y, Ahmed M, Guo H, Soares F, Hua JT, Gao S, et al. LSD1-Mediated Epigenetic Reprogramming Drives CENPE Expression and Prostate Cancer Progression. Cancer Res. 2017;77(20):5479–90. 10.1158/0008-5472.CAN-17-0496 . [DOI] [PubMed] [Google Scholar]
- 13.Kung PP, Martinez R, Zhu Z, Zager M, Blasina A, Rymer I, et al. Chemogenetic evaluation of the mitotic kinesin CENP-E reveals a critical role in triple-negative breast cancer. Mol Cancer Ther. 2014;13(8):2104–15. 10.1158/1535-7163.MCT-14-0083-T . [DOI] [PubMed] [Google Scholar]
- 14.Human Protein Atlas available from www.proteinatlas.org.
- 15.Uhlen M, Oksvold P, Fagerberg L, Lundberg E, Jonasson K, Forsberg M, et al. Towards a knowledge-based Human Protein Atlas. Nat Biotechnol. 2010;28(12):1248–50. 10.1038/nbt1210-1248 . [DOI] [PubMed] [Google Scholar]
- 16.Cerami E, Gao J, Dogrusoz U, Gross BE, Sumer SO, Aksoy BA, et al. The cBio cancer genomics portal: an open platform for exploring multidimensional cancer genomics data. Cancer Discov. 2012;2(5):401–4. 10.1158/2159-8290.CD-12-0095 [DOI] [PMC free article] [PubMed] [Google Scholar]
- 17.Uemura N, Kondo T. Current advances in esophageal cancer proteomics. Biochim Biophys Acta. 2015;1854(6):687–95. 10.1016/j.bbapap.2014.09.011 . [DOI] [PubMed] [Google Scholar]
- 18.Guo Y, Kim C, Ahmad S, Zhang J, Mao Y. CENP-E—dependent BubR1 autophosphorylation enhances chromosome alignment and the mitotic checkpoint. J Cell Biol. 2012;198(2):205–17. 10.1083/jcb.201202152 [DOI] [PMC free article] [PubMed] [Google Scholar]
- 19.Henderson MC, Shaw YJ, Wang H, Han H, Hurley LH, Flynn G, et al. UA62784, a novel inhibitor of centromere protein E kinesin-like protein. Mol Cancer Ther. 2009;8(1):36–44. 10.1158/1535-7163.MCT-08-0789 [DOI] [PMC free article] [PubMed] [Google Scholar]
- 20.Su P, Wen S, Zhang Y, Li Y, Xu Y, Zhu Y, et al. Identification of the Key Genes and Pathways in Esophageal Carcinoma. Gastroenterol Res Pract. 2016;2016:2968106 10.1155/2016/2968106 [DOI] [PMC free article] [PubMed] [Google Scholar]
- 21.Shiozaki A, Nako Y, Ichikawa D, Konishi H, Komatsu S, Kubota T, et al. Role of the Na (+)/K (+)/2Cl(-) cotransporter NKCC1 in cell cycle progression in human esophageal squamous cell carcinoma. World J Gastroenterol. 2014;20(22):6844–59. 10.3748/wjg.v20.i22.6844 [DOI] [PMC free article] [PubMed] [Google Scholar]
- 22.Mei LL, Wang WJ, Qiu YT, Xie XF, Bai J, Shi ZZ. miR-125b-5p functions as a tumor suppressor gene partially by regulating HMGA2 in esophageal squamous cell carcinoma. PLoS One. 2017;12(10):e0185636 10.1371/journal.pone.0185636 [DOI] [PMC free article] [PubMed] [Google Scholar]
- 23.Kailasam A, Mittal SK, Agrawal DK. Epigenetics in the Pathogenesis of Esophageal Adenocarcinoma. Clin Transl Sci. 2015;8(4):394–402. 10.1111/cts.12242 [DOI] [PMC free article] [PubMed] [Google Scholar]
- 24.Islam F, Tang JC, Gopalan V, Lam AK. Epigenetics: DNA Methylation Analysis in Esophageal Adenocarcinoma. Methods Mol Biol. 2018;1756:247–56. 10.1007/978-1-4939-7734-5_21 . [DOI] [PubMed] [Google Scholar]
Associated Data
This section collects any data citations, data availability statements, or supplementary materials included in this article.
Supplementary Materials
(JPG)
(DOCX)
(DOCX)
Data Availability Statement
All relevant data are within the paper and its Supporting Information files.


