

Abstract
Introduction
Triage systems with limited room for clinical judgment are used by emergency departments (EDs) worldwide. The Copenhagen Triage Algorithm (CTA) is a simplified triage system with a clinical assessment.
Methods
The trial was a non-inferiority, two-center cluster-randomized crossover study where CTA was compared to a local adaptation of Adaptive Process Triage (ADAPT). CTA involves initial categorization based on vital signs with a final modification based on clinical assessment by an ED nurse. We used 30-day mortality with a non-inferiority margin at 0.5%. Predictive performance was compared using Receiver Operator Characteristics.
Results
We included 45,347 patient visits, 23,158 (51%) and 22,189 (49%) were triaged with CTA and ADAPT respectively with a 30-day mortality of 3.42% and 3.43% (P = 0.996) a difference of 0.01% (95% CI: -0.34 to 0.33), which met the non-inferiority criteria. Mortality at 48 hours was 0.62% vs. 0.71%, (P = 0.26) and 6.38% vs. 6.61%, (P = 0.32) at 90 days for CTA and ADAPT. CTA triaged at significantly lower urgency level (P<0.001) and was superior in predicting 30-day mortality, Area under the curve: 0.67 (95% CI 0.65–0.69) compared to 0.64 for ADAPT (95% CI 0.62–0.66) (P = 0.03). There were no significant differences in rate of admission to the intensive care unit, length of stay, waiting time nor rate of readmission within 30 or 90 days.
Conclusion
A novel triage system based on vital signs and a clinical assessment by an ED nurse was non-inferior to a traditional triage algorithm by short term mortality, and superior in predicting 30-day mortality.
Trial registration
Clinicaltrials.gov NCT02698319
Introduction
Background
Triage systems have been implemented in most emergency departments (ED) to minimize crowding and treatment delays that can result in adverse patient outcomes [1, 2]. The purpose of triage is to identify patients that need immediate treatment upon ED presentation and to provide general risk stratification to optimize resource allocation.
There is a variety of triage models in use worldwide mostly based on systematized flow-charts of symptoms and vital signs leaving limited room for clinical judgement [3, 4]. Typical triage systems involve a two-step procedure. First, a standardized set of vital signs (e.g. heart rate, blood pressure etc.) are measured and compared with predetermined limits set for each triage level. Then the ED nurse compares the patient’s chief complaint (e.g. chest pain) to a chart for that symptom listing a set of specific discriminators (e.g. severe pain) along with a corresponding triage level. The final level of the patient is determined by the most urgent of the two triage levels [3].
Traditional triage systems have been implemented without good evidence of a clinically beneficial effect or quality studies indicating their predictive ability [5], and since triage requires both time and resources, they could potentially be of more harm than benefit.
The Copenhagen Triage Algorithm is (CTA) a new triage system designed to simplify risk prediction and to reintroduce clinical judgment as the central part of triage [6]. Here we compare CTA with a traditional triage model in terms of risk prediction and patient outcomes, with a focus on 30-day mortality.
Methods
Study design and setting
This is a two-center, cluster-randomized, cross-over, non-inferiority trial using hospitals as the units of randomization and patients as the units of analysis, in which we compare CTA to a traditional triage system. Herlev Hospital and Bispebjerg Hospital have two equally sized EDs in the Capital Region of Denmark and was recruited to perform the study as they manage 70,000 and 85,000 annual patient visits, respectively [7, 8]. Both centers are 24-hour acute care hospitals offering broad medical, surgical, neurological, level-2 trauma, and ICU services. These hospitals were selected as representative of large scale EDs because they both have a high intake of unselected acute patients of all age classes across both medical and surgical specialties. We introduced CTA in “active” cluster periods, while “control” cluster periods employed the pre-existing triage system. A coin toss was used to decide the allocation of active and control clusters. We gathered baseline data from the chart made for each patient at admission. We collected data on contacts to the secondary health care system including admissions from The Danish National Patient Register, in which every resident of Denmark has a unique identifier that enables individual linkage of administrative registers [9], and we obtained vital status from the Central Personal Register, in which complete data of every death in Denmark is registered. Additional details regarding study design and rationale are described elsewhere [6]. This study was reviewed by the Regional Ethics Committee, which decided that no formal approval was needed according to Danish law.
Selection of participants
We included all patients admitted through the EDs at either of the two participating centers during the study period. We excluded patients presenting in the ED with minor injuries (e.g. sprained ankle or minor cuts/abrasions) as they are triaged as blue (level 5) in both systems which typically precludes measurement of vital signs, as well as readmissions within 90 days of the index admission. This design led to an inclusion rate of close to 100%, as all acutely admitted patients were triaged and the two models were never in use at the same time at any center. However, we also excluded patients admitted directly to their respective departments, including patients younger than 16 years and gynecology and obstetrics patients, as well as patients with major trauma suspected pre-hospital who were admitted to a tertiary center in the region.
Interventions
The Copenhagen Triage Algorithm (CTA) is a new triage system constructed from data collected from 12 000 ED patient visits at a large Danish hospital [10, 11].
The CTA solely consists of a quick score of vital signs followed by a basic clinical assessment by an ED nurse. The final triage level results from a score calculated after measurement of vital signs corresponding to a triage level of 1–4, that is then adjusted by the ED nurse, who can either up-triage (up to 2 steps) or down-triage (1 step) according to clinical assessment with no specific explanation needed. The development of the CTA has previously been described in detail [6].
A local adaption of the Adaptive Process Triage (ADAPT), triage model developed in Sweden in 2006 similar to most other well-known triage models [6, 10, 12, 13], was the standard triage model used in the study. It includes the presenting (or chief) complaint in addition to a list of vital signs with cut-off values corresponding to each triage level. These are both registered, and the final triage level is determined by the most urgent triage level assigned. The two triage systems are illustrated in S1 Fig.
Both triage systems identify five levels of urgency with colors (red, orange, yellow, green, and blue). The least urgent of these (the fifth level) was excluded from this study as it is defined as non-emergent patients (e.g. minor injuries) and includes no indication for measuring vital signs.
Outcomes
The primary aim of the study was to assess whether CTA is non-inferior to ADAPT, as determined by patient outcomes. We also investigate differences in triage distributions and compare the predictive ability of the two algorithms for risk assessment. We define the primary endpoint as all-cause 30-day mortality, and secondary end-points include acute (48 hours) and long-term mortality (90 days) as well as rate of admission to the intensive care unit. Other secondary endpoints were designed to assess patient flow and resource utilization and included waiting time from triage to start of treatment, length of stay and readmission, as well as a post hoc analysis of how many patients left without being seen by a doctor, and in-hospital mortality. We assessed all endpoints in October 2016.
Analysis
Based on earlier work, we estimated that 30-day mortality would be 4.2% at each center [10, 11] and the non-inferiority margin (Δ) was set to 0.5%. This required a sample size of at least 39,820 patient visits in total with a power of 80% and a two-sided confidence interval of 95%.
We evaluated time-to-event data using a semi-parametric procedure fitting a Cox proportional hazard model for marginal effects stratified by cluster. We used receiver operating characteristics (ROC) and area under the curve (AUC) statistics to compare the ability of each model to predict mortality, in these analyses the triage categories were viewed as numeric scores. We used the Youden index and calculated sensitivity, specificity, negative predictive value and positive predictive value for the prediction of 30-day mortality for each triage system. To assess calibration of the triage algorithms we internally validated the predictive abilities using a cross-validation approach using 1000 splits into training and validation set from which we calculated Brier scores. We computed a Forest plot encompassing sensitivity analyses to appraise the safety of CTA across differing demographics. Mortality endpoints were assessed by the intention-to-treat principle, while all statistical analyses regarding prognostic abilities were done per-protocol and excluded patients with no or erroneous triage. Mortality was also compared using Mantel-haenszel Chi square.
Continuous variables are described by median and interquartile range (IQR) and mean with standard deviation (SD). Categorical variables are described by number (n) and percentages (%). The baseline characteristics were compared using chi-square, Student’s t, and Wilcoxon tests. Student’s t-test was used to compare length of stay and chi-square or Fisher’s tests were used where appropriate to compare proportions.
We performed statistical programming in R version 3.3.3 [14] and SAS version 9.4 2002–2012 (SAS institute Inc., Cary, NC, USA).
Ethics approval
The study was presented to the Regional Ethics Committee of Copenhagen (subcommittee D), who determined that no formal approval was needed in accordance with Danish law (H-4-2014-FSP), thus the need for consent was waived. The Danish Data Protection Agency (HEH-2014-118) and the Danish Health and Medicines Authority (3-3013-1119/2). The study is registered on clinicaltrials.gov (NCT02698319).
Trial registration
Our trial was unfortunately registered after initiation due to a simple misunderstanding among the authors. The trial was however registered before the results of the trial were in any way available to the authors and there were no changes made from the original protocol or the published study protocol. The trial is registered at clinicaltrials.gov with the identifier NCT02698319 (https://clinicaltrials.gov/ct2/show/NCT02698319).
Results
A total of 54,117 patient visits were included in the study between March 1st 2015 and January 31st 2016, and we concluded follow-up on May 1st 2016. A total of 1,752 (3.2%) patient visits were excluded due to either erroneous or temporary identification in the ED, and a further 7,018 (13%) patient visits were excluded as readmissions within 90-days of the index admission, resulting in a final study population of 45,347 patient visits. Of these, 23,158 (51%) of these were triaged using CTA, 22,189 (49%) were triaged using ADAPT, and Herlev and Bispebjerg Hospitals had 26,671 and 18,676 patients included in the analysis, respectively (Fig 1). Table 1 and S1–S4 Tables summarize baseline characteristics and vital signs of the study population.
Fig 1. CONSORT diagram.

Table 1. Baseline characteristics divided into triage levels.
Baseline characteristics and vital signs for patients admitted to the emergency department and triaged with two different systems., mean values (Standard deviation) across triage levels, arterial oxygen saturation: median (IQR).
| Copenhagen Triage Algorithm (CTA) n = 23,158 |
Adaptive Process Triage (ADAPT) n = 22,189 |
P | |
|---|---|---|---|
| Triage: Red (most urgent), n (%) | 623 (2.7) | 695 (3.13) | 0.0051 |
| Female, n (%) | 283 (45.4) | 325 (46.8) | |
| Age, years, | 62.6 (21.5) | 62.1 (21.2) | |
| Systolic Blood Pressure, mmHg | 134 (35) | 136 (35) | |
| Heart rate, pr. min | 99 (30) | 106 (32) | |
| Respiratory rate, pr. min | 23 (8) | 24 (9) | |
| Arterial oxygen saturation, % | 97 (93–99) | 96 (92–98) | |
| Temperature, degrees Celsius | 36.8 (1) | 36.9 (1) | |
| Triage: Orange, n (%) | 3,799 (16.4) | 6,438 (29.0) | <0.001* |
| Female, n (%) | 1,865 (49.1) | 3,345 (52.0) | |
| Age, years | 58.4 (21.7) | 56.9 (22.1) | |
| Systolic Blood Pressure, mmHg | 140 (30) | 141 (28) | |
| Heart rate, pr. min | 90 (23) | 88 (22) | |
| Respiratory rate, pr. min | 19 (5) | 18 (4) | |
| Arterial oxygen saturation, % | 97 (95–99) | 97 (96–99) | |
| Temperature, degrees Celsius | 36.7 (1) | 36.8 (1) | |
| Triage: Yellow, n (%) | 8,823 (38.1) | 8,357 (37.7) | 0.34 |
| Female, n (%) | 4,545 (51.5) | 4,315 (51.6) | |
| Age, years | 55.7 (22.0) | 56.4 (22.1) | |
| Systolic Blood Pressure, mmHg | 139 (26) | 138 (25) | |
| Heart rate, pr. min | 87 (19) | 85 (18) | |
| Respiratory rate, pr. min | 18 (3) | 17 (3) | |
| Arterial oxygen saturation, % | 97 (96–99) | 97 (96–99) | |
| Temperature, degrees Celsius | 36.7 (1) | 36.9 (1) | |
| Triage: Green (least urgent), n (%) | 9,403 (40.6) | 6,677 (30.1) | <0.001* |
| Female, n (%) | 4,782 (50.9) | 3,473 (52.0) | |
| Age, years | 56.4 (22.0) | 56.7 (21.6) | |
| Systolic Blood Pressure, mmHg | 139 (23) | 138 (24) | |
| Heart rate, pr. min | 82 (15) | 82 (15) | |
| Respiratory rate, pr. min | 17 (2) | 17 (2) | |
| Arterial oxygen saturation, % | 97 (96–99) | 98 (96–99) | |
| Temperature, degrees Celsius | 36.8 (1) | 36. (1) | |
| Missing triage | 510 (2.2) | 22 (0.10) | <0.001* |
At 30 days, death occurred in 793 (3.42%) patients in the CTA group and in 760 (3.43%) in the ADAPT group (P = 1.00), corresponding to a mortality difference of 0.01% (95% CI -0.336–0.334). The lower boundary of the 95% two-sided confidence interval for the difference between the occurrences of the primary endpoint in the CTA and ADAPT cohorts does not include–Δ (0.5%), therefore this met the pre-specified non-inferiority conditions. We observed no differences in the secondary endpoint of acute mortality (48 hours), in which mortality was 0.62% and 0.71% in patients triaged using CTA and ADAPT, respectively (P = 0.26), corresponding to a difference of -0.086 (95% CI -0.235 to 0.064). Similarly, we observed no differences for long-term mortality (90 days), 6.38% and 6.61%, respectively (p = 0.323), corresponding to a difference of -0.229 (95% CI -0.683 to 0.225). Cumulative incidence for 30-day mortality is plotted in Fig 2 and shows no difference between the two triage algorithms (P = 1.00).
Fig 2. Cumulative incidence plot.
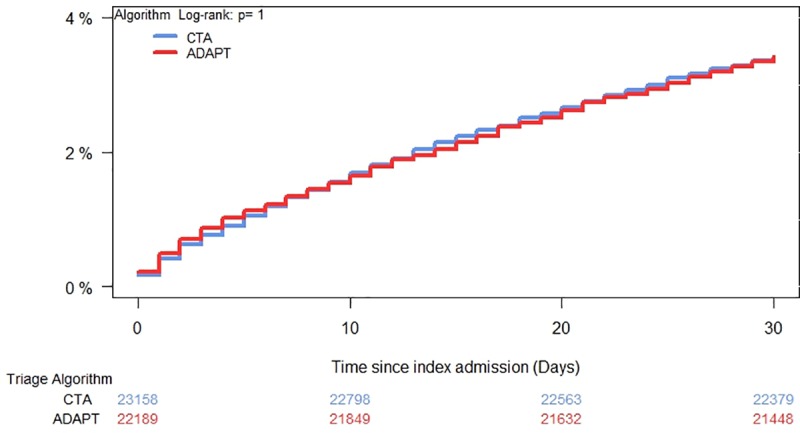
30-day all-cause mortality for patients admitted to the emergency department and triaged with two different systems.
The triage levels of the patients and corresponding cumulative 30-day mortality incidence for each triage level are summarized in Fig 3. Although the CTA group patients triaged at a significantly lower average urgency (P<0.001, Table 1), there was no significant increase in mortality observed among patients in the low-risk groups (3/yellow and 4/green). The moderate-to-high risk patients (2/orange) had a higher 30-day mortality in the CTA group (P<0.001).
Fig 3. Cumulative incidence.

30-day all-cause mortality and distribution of triage levels for patients admitted to the emergency department.
The Receiver Operating Characteristics (ROC) curves indicate that CTA was non-inferior at 1, 2 and 7 days, and superior at 30, 60, and 90 days in predicting mortality relative to ADAPT (S2 Fig). The AUC for mortality at 30 days for CTA was 0.67 (95% CI 0.65–0.69) and 0.64 (95% CI 0.62–0.66) for ADAPT (P = 0.03). At 2 days AUC was 0.79 (95% CI 0.75–0.83) and 0.80 (95% CI 0.76–0.83) for CTA and ADAPT (P = 0.91), and at 90 days the AUC was 0.61 (95% CI 0.59–0.62) and: 0.57 (95% CI 0.56–0.59) for CTA and ADAPT, respectively (P = 0.002). Using the Youden index we found a cut-off of 2.5 yielding a specificity of 0.81 (95% CI 0.81–0.82), sensitivity of 0.44 (0.41–0.48), positive predictive value of 0.077 (0.071–0.083) and negative predictive value of 0.98 (0.98–0.98) for CTA. The corresponding values for ADAPT was a specificity of 0.69 (95% CI 0.68–0.69), sensitivity of 0.52 (0.49–0.52), positive predictive value of 0.055 (0.052–0.059) and negative predictive value of 0.98 (0.97–0.98). Further, the Brier scores of CTA and ADAPT were 0.032 and 0.033 respectively, both corresponding to acceptable performance.
A Forest plot revealed no significant differences between triage algorithms in risk categorized by sex, age group or medical/surgical patients (Fig 4). A sensitivity analysis that included vital signs, age, and sex showed consistent results and no added risk among patients in the CTA arm for mortality at 30 days (HR 1.05, 95% CI 0.92–1.20) or 90 days (HR 0.98, 95% CI 0.89–1.09) and showed a slight but significantly lower risk using CTA at 48 hours (HR 0.92, 95% CI 0.91–0.93). Notably, sensitivity analyses on the primary endpoint of 30-day mortality stratified by triage level revealed an increased risk in levels 1–3 in the triage comparison, indicating that CTA is superior in identifying patients at risk of short term death (S3 Fig).
Fig 4. Forest plot for 30-day all-cause mortality for patients admitted to the emergency department.

Secondary end-points of various flow measures showed no significant differences between the two systems with regards to rate of admission to the intensive care unit at 0.86% and 0.82% (P = 0.59), average length of stay at 2.6 and 2.6 days (P = 0.32) and readmissions within 30 days at 7.61% and 7.23% (P = 0.10) or 90 days at 13.5% and 13.3% (P = 0.52) for CTA and ADAPT respectively. Similarly, there was no difference in waiting time from triage to treatment in either ED with waiting time at Bispebjerg Hospital at 67 min and 66 min (P = 0.50) and at Herlev Hospital at 40 min and 38 min (P = 0.50) for CTA and ADAPT, respectively.
We assessed an additional per-protocol cohort that excluded patients with no or erroneous triage (n = 532 (1.17%)). The 30-day mortality was 3.40% (n = 770) in patients triaged with CTA (n = 22,648), compared to 3.42% (n = 759) in patients triaged with ADAPT (n = 22,167), a difference of 0.024 (95% CI -0.360–0.312), HR 0.99 (95% CI 0.93–1.06).
In post hoc analyses we found no significant differences in in hospital mortality at 137 (0.60%) and 136 (0.64) (p = 0.58) or proportion of patients who left without being seen by a doctor 166 (0.73%) and 147 (0.70%) (P = 0.68) for CTA and ADAPT.
Discussion
This is the first randomized study that evaluates different triage systems in relation to clinical endpoints. We find that the Copenhagen Triage Algorithm (CTA), a new and simpler triage algorithm with an emphasis on basic clinical assessment, is non-inferior to a systematic triage algorithm in determining patient outcomes. CTA produced a significantly lower level of triage on average and performed significantly better at predicting mortality risk in a large and unselected cohort of ED patients. There were no significant differences with regards to measures of patient flow.
These results indicate that the simpler CTA algorithm may safely replace more cumbersome systematic triage systems without a risk of harming patients. CTA could potentially lessen the resources used on triage.
A potential problem with any randomized trial of triage could be the positive impact of over-triage. It is possible that classifying more patients as Red or Orange (the most acutely ill patients) could lead to a lower mortality simple by more immediate treatment of those patients. However, this was not the case in this study, as CTA has significantly fewer patients triaged Orange while still being non-inferior to ADAPT on all-cause mortality. The reasons for this could be that fewer patients classified as acutely ill lead to lesser crowding in the ED.
We observed a significantly higher mortality rate among patients triaged as Orange using CTA than ADAPT. This is not because of differences in care, as the two systems have the same treatment algorithm (e.g. maximum waiting time to see a doctor). More likely it is because fewer low-risk patients were misclassified as Orange and instead correctly classified as Green or Yellow (less acutely ill). This can be seen by the significantly increased number of Green patients in the CTA cohort as compared to ADAPT, while the mortality rate of the Green patients remained the same.
We used a local adaption of the internationally used ADAPT system as the comparison triage system in this study. Like most other triage systems, the ADAPT system determines estimated urgency using a list of vital signs (e.g. heart rate) and a series of flow-charts describing chief complaints (e.g. dyspnea) [6], and assigns a color that determines the patient’s urgency in seeing a physician. ADAPT is largely similar to most other widely used triage models, including the Manchester Triage System, The Canadian Triage and Acuity Scale, and the Australasian Triage Scale [3, 4, 15, 16], both in terms of composition and distribution of patients at each triage level [17, 18] as well as mortality rates within these categories [6]. The follow-up intervals, procedures and overall terminology was the same in both CTA and ADAPT to ensure that the two systems were directly comparable.
Specific symptoms are well-known predictors of disease and prognosis [17, 19] but attempts to quantify and list these in triage often lead to challenges, including trouble grading the severity of the symptoms as well as difficulty characterizing every possible symptom or symptom combination, and there is little evidence or agreement across triage systems [20]. Lending more weight to a basic clinical assessment could potentially eliminate these problems as seen in the CTA, in which the ED nurse had the ability to reclassify patients as more urgent (up to 2 levels) or less urgent (1 level) with no explanation required. Most triage models, including ADAPT, permit ED nurses to reclassify patients as more urgent, but few incorporate the clinical assessment as an integral part of the algorithm despite recent data supporting the use of clinical assessment even by relatively untrained staff [21, 22]. An exception is the Emergency Severity Index where the ED nurse separates the acutely ill (level 1 and level 2) from the remaining patients (levels 3–5) which are then sorted based on resource utilization [23].
The determination of the outcome measures that most accurately evaluate a triage system remains an open question. The ideal gold standard for comparison is a well-validated model, but all current triage systems were implemented prior to validation [5, 20]. A useful clinical outcome should be independent from the results of triage, and the patient’s triage category could affect hospitalization or admittance to the intensive care unit (ICU) [24] (e.g. the patient was triaged as acutely ill and was therefore admitted to the ICU), making those outcomes less useful. Mortality rate was chosen as the primary end-point of this study for this reason. We also report other more patient flow related outcome measures, e.g. admittance to the ICU, patient length of stay as well as the number of patients that left the ED without being seen by a doctor. Other factors that could be considered for an evidence-based triage model include the effect on crowding [2] and model reliability as determined by inter- and intra-rater agreement [15, 20] as well as the triage system’ ability to predict other markers of acute illness such as team activation and radiological examinations or specific procedures and treatments (e.g. thrombolysis).
Strengths and limitations
The large and unselected nature of the cohort, including both medical and surgical patients of all ages is a strength of this study. However, individual randomization is not practical with an intervention like triage for several reasons. First, continuously switching between triage models could slow down the flow of the ED, which would cause crowding and putting the patients at risk. Second, such a setup runs the risk of bias, since nurses may default to one triage model over the other during busy times.
We chose cluster-randomization to avoid this. Cluster-randomized design introduces dependence between individual units sampled, which is largely alleviated by the cross-over in the study, and relies on a similar patient inclusion during both parts of the study. We ensured this by determining the total study period by the number of included patients rather than by time. We further note that the sensitivity and subgroup analyses performed all showed similar results.
Conclusion
The Copenhagen Triage Algorithm, based on vital signs and a basic clinical assessment by an ED nurse, was non-inferior to a traditional triage algorithm in terms of short term mortality, and was superior at predicting mortality.
Supporting information
(DOCX)
(TIF)
(TIF)
(TIFF)
Baseline characteristics for patients admitted to the emergency department, mean values (Standard deviation), arterial oxygen saturation: median (IQR).
(XLSX)
Baseline characteristics for patients admitted to the emergency department, mean values (Standard deviation), arterial oxygen saturation: median (IQR).
(XLSX)
Baseline characteristics for patients admitted to the emergency department, mean values (Standard deviation), arterial oxygen saturation: median (IQR).
(XLSX)
Baseline characteristics for patients admitted to the emergency department, mean values (Standard deviation), arterial oxygen saturation: median (IQR).
(XLSX)
(PDF)
(DOCX)
Acknowledgments
The authors would like to extend their gratitude to the Departments of Clinical Biochemistry at Herlev and Bispebjerg Hospital for professional assistance and support.
The study was purely investigator driven and the funding foundation TrygFonden had no influence on study design, data analysis, interpretation or publication.
Data Availability
This study was completed using third party data from The Danish National Patient Register. As the dataset is still connected to these registries, anonymized patient level data can only legally be accessed upon acceptance from The Danish Data Protection Agency (www.datatilsynet.dk; dt@datatilsynet.dk), the goverment body that regulates the use of Danish registry data. Interested parties can contact the corresponding author (RBH) for further information. We confirm that others, given a suitable project judged by the Danish Data Protection Agency, would be able to access these data in the same manner as the authors. We also confirm that the authors do not have any special access privileges that others would not have.
Funding Statement
This work was supported by TrygFonden (ID 114472), https://www.trygfonden.dk. Funding was received by KI. Role of funding source: The study is funded by TrygFonden. The trial is driven and initiated by the researchers and the funders had no role in study design, data collection and analysis, decision to publish, or preparation of the manuscript.
References
- 1.Carter EJ, Pouch SM, Larson EL. The relationship between emergency department crowding and patient outcomes: a systematic review. Journal of nursing scholarship: an official publication of Sigma Theta Tau International Honor Society of Nursing / Sigma Theta Tau. 2014;46(2):106–15. [DOI] [PMC free article] [PubMed] [Google Scholar]
- 2.Hoot NR, Aronsky D. Systematic review of emergency department crowding: causes, effects, and solutions. Annals of emergency medicine. 2008;52(2):126–36. 10.1016/j.annemergmed.2008.03.014 [DOI] [PMC free article] [PubMed] [Google Scholar]
- 3.Manchester Triage Group. Emergency Triage. 3rd ed: John Wiley & Sons, Ltd.; 2014. [Google Scholar]
- 4.Australian Government—Department of Health and Ageing. Triage Workbook [cited 2016 05/11]. Available from: https://www.health.gov.au/internet/main/publishing.nsf/Content/387970CE723E2BD8CA257BF0001DC49F/$File/Triage%20Workbook.pdf.
- 5.Hardern RD. Critical appraisal of papers describing triage systems. Academic emergency medicine: official journal of the Society for Academic Emergency Medicine. 1999;6(11):1166–71. [DOI] [PubMed] [Google Scholar]
- 6.Hasselbalch RB, Plesner LL, Pries-Heje M, Ravn L, Lind M, Greibe R, et al. The Copenhagen Triage Algorithm: a randomized controlled trial. Scandinavian journal of trauma, resuscitation and emergency medicine. 2016;24(1):123 10.1186/s13049-016-0312-6 [DOI] [PMC free article] [PubMed] [Google Scholar]
- 7.The Capital Region of Denmark. Herlev Hospital Homepage [Available from: https://www.herlevhospital.dk/.
- 8.The Capital Region of Denmark. Bispebjerg Hospital Homepage [Available from: https://www.bispebjerghospital.dk/.
- 9.Schmidt M, Schmidt SA, Sandegaard JL, Ehrenstein V, Pedersen L, Sorensen HT. The Danish National Patient Registry: a review of content, data quality, and research potential. Clinical epidemiology. 2015;7:449–90. 10.2147/CLEP.S91125 [DOI] [PMC free article] [PubMed] [Google Scholar]
- 10.Barfod C, Lauritzen MM, Danker JK, Soletormos G, Berlac PA, Lippert F, et al. The formation and design of the 'Acute Admission Database'- a database including a prospective, observational cohort of 6279 patients triaged in the emergency department in a larger Danish hospital. Scandinavian journal of trauma, resuscitation and emergency medicine. 2012;20:29 10.1186/1757-7241-20-29 [DOI] [PMC free article] [PubMed] [Google Scholar]
- 11.Plesner LL, Iversen AK, Langkjaer S, Nielsen TL, Ostervig R, Warming PE, et al. The formation and design of the TRIAGE study—baseline data on 6005 consecutive patients admitted to hospital from the emergency department. Scandinavian journal of trauma, resuscitation and emergency medicine. 2015;23:106 10.1186/s13049-015-0184-1 [DOI] [PMC free article] [PubMed] [Google Scholar]
- 12.Farrokhnia N, Goransson KE. Swedish emergency department triage and interventions for improved patient flows: a national update. Scandinavian journal of trauma, resuscitation and emergency medicine. 2011;19:72 10.1186/1757-7241-19-72 [DOI] [PMC free article] [PubMed] [Google Scholar]
- 13.Nordberg M, Lethvall S, Castrén M. The validity of the triage system ADAPT. Scandinavian journal of trauma, resuscitation and emergency medicine. 2010;18(Suppl 1):P36–P. [Google Scholar]
- 14.R Core Team. R: A Language and Eviroment for Statistical Computing. 2016.
- 15.FitzGerald G, Jelinek GA, Scott D, Gerdtz MF. Emergency department triage revisited. Emergency medicine journal: EMJ. 2010;27(2):86–92. 10.1136/emj.2009.077081 [DOI] [PubMed] [Google Scholar]
- 16.M JM. The Canadian Triage and Acuity Scale: A Canadian perspective on emergency department triage. Emerg Med (Fremantle). 2003;15(1):6–10. [DOI] [PubMed] [Google Scholar]
- 17.Barfod C, Lauritzen MM, Danker JK, Soletormos G, Forberg JL, Berlac PA, et al. Abnormal vital signs are strong predictors for intensive care unit admission and in-hospital mortality in adults triaged in the emergency department—a prospective cohort study. Scandinavian journal of trauma, resuscitation and emergency medicine. 2012;20:28 10.1186/1757-7241-20-28 [DOI] [PMC free article] [PubMed] [Google Scholar]
- 18.Storm-Versloot MN, Ubbink DT, Kappelhof J, Luitse JS. Comparison of an informally structured triage system, the emergency severity index, and the manchester triage system to distinguish patient priority in the emergency department. Academic emergency medicine: official journal of the Society for Academic Emergency Medicine. 2011;18(8):822–9. [DOI] [PubMed] [Google Scholar]
- 19.Safwenberg U, Terent A, Lind L. The Emergency Department presenting complaint as predictor of in-hospital fatality. European journal of emergency medicine: official journal of the European Society for Emergency Medicine. 2007;14(6):324–31. [DOI] [PubMed] [Google Scholar]
- 20.Farrohknia N, Castren M, Ehrenberg A, Lind L, Oredsson S, Jonsson H, et al. Emergency department triage scales and their components: a systematic review of the scientific evidence. Scandinavian journal of trauma, resuscitation and emergency medicine. 2011;19:42 10.1186/1757-7241-19-42 [DOI] [PMC free article] [PubMed] [Google Scholar]
- 21.Brabrand M, Hallas J, Knudsen T. Nurses and physicians in a medical admission unit can accurately predict mortality of acutely admitted patients: a prospective cohort study. PLoS One. 2014;9(7):e101739 10.1371/journal.pone.0101739 [DOI] [PMC free article] [PubMed] [Google Scholar]
- 22.S Iversen AK, Forberg JL, Schou M, Rasmussen LS, Køber L, Iversen K. Comparison of systematic triage with clinical assessment in prediction of short-term mortality. Scandinavian journal of trauma, resuscitation and emergency medicine. 2015;23(1):1–. [Google Scholar]
- 23.Gilboy N, Tanabe P, Travers D, Rosenau A. Emergency Severity Index (ESI)—A Triage Tool for Emergency Department Care. Version 4 ed2011.
- 24.Wuerz RC, Milne LW, Eitel DR, Travers D, Gilboy N. Reliability and validity of a new five-level triage instrument. Academic emergency medicine: official journal of the Society for Academic Emergency Medicine. 2000;7(3):236–42. [DOI] [PubMed] [Google Scholar]
Associated Data
This section collects any data citations, data availability statements, or supplementary materials included in this article.
Supplementary Materials
(DOCX)
(TIF)
(TIF)
(TIFF)
Baseline characteristics for patients admitted to the emergency department, mean values (Standard deviation), arterial oxygen saturation: median (IQR).
(XLSX)
Baseline characteristics for patients admitted to the emergency department, mean values (Standard deviation), arterial oxygen saturation: median (IQR).
(XLSX)
Baseline characteristics for patients admitted to the emergency department, mean values (Standard deviation), arterial oxygen saturation: median (IQR).
(XLSX)
Baseline characteristics for patients admitted to the emergency department, mean values (Standard deviation), arterial oxygen saturation: median (IQR).
(XLSX)
(PDF)
(DOCX)
Data Availability Statement
This study was completed using third party data from The Danish National Patient Register. As the dataset is still connected to these registries, anonymized patient level data can only legally be accessed upon acceptance from The Danish Data Protection Agency (www.datatilsynet.dk; dt@datatilsynet.dk), the goverment body that regulates the use of Danish registry data. Interested parties can contact the corresponding author (RBH) for further information. We confirm that others, given a suitable project judged by the Danish Data Protection Agency, would be able to access these data in the same manner as the authors. We also confirm that the authors do not have any special access privileges that others would not have.