Abstract
Purpose
Crowding refers to the phenomenon in which objects that can be recognized when viewed in isolation are unrecognizable in clutter. Crowding sets a fundamental limit to the capabilities of the peripheral vision and is essential in explaining performance in a broad array of daily tasks. Due to the effects of glaucoma on peripheral vision, we hypothesized that neural loss in the disease would lead to stronger effects of visual crowding.
Methods
Subjects were asked to discriminate the orientation of a target letter when presented with surrounding flankers. The critical spacing value (scritical), which was required for correct discrimination of letter orientation, was obtained for each quadrant of the visual field. scritical values were correlated with standard automated perimetry (SAP) mean sensitivity (MS) and optical coherence tomography (OCT) retinal nerve fiber layer (RNFL) thickness measurements.
Results
The study involved 13 subjects with mild glaucomatous visual field loss and 13 healthy controls. Glaucomatous eyes had significantly greater (worse) scritical than controls (170.4 ± 27.1 vs. 145.8 ± 28.0 minimum of visual angle, respectively; P = 0.007). scritical measurements were significantly associated with RNFL thickness measurements (R2 = 26%; P < 0.001) but not with SAP MS (P = 0.947).
Conclusions
In glaucoma patients, a pronounced visual crowding effect is observed, even in the presence of mild visual field loss on standard perimetry. scritical was associated with the amount of neural loss quantified by OCT. These results may have implications for understanding how glaucoma patients are affected in daily tasks where crowding effects may be significant.
Keywords: glaucoma, visual crowding, visual function
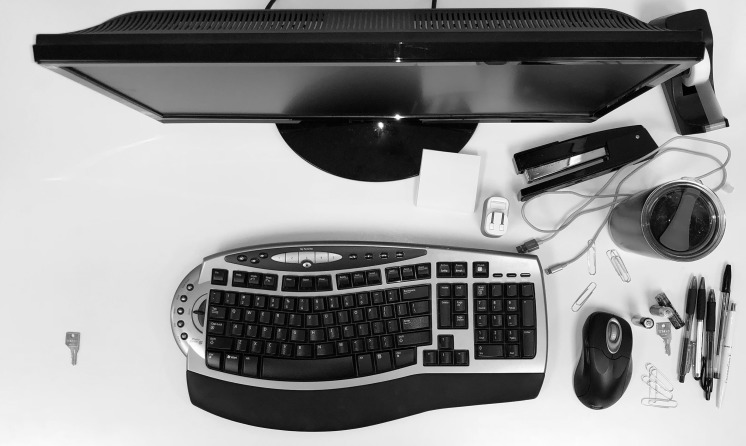
In the peripheral visual field, objects that are clearly identifiable when shown in isolation become impossible to recognize when presented close together. For every location within the visual field, there is a critical spacing (scritical) that must be exceeded for unimpaired recognition (i.e., if the objects are closer together than the scritical) they are perceived as an unidentifiable jumble.1–5 This phenomenon is known as visual crowding and sets a fundamental limit on conscious visual perception. The phenomenon is illustrated in Figure 1, where one can easily perceive the target in isolation (the key on the left), but not in the presence of clutter (the key on the right). Crowding impairs the ability to recognize objects in clutter, and is therefore essential in explaining performance in a broad array of daily tasks, such as visual search and reading.1
Figure 1.
A real-world example of visual crowding. While fixating the middle of the keyboard, note the relative ease of detecting and identifying the key to the left (presented in isolation) versus the key on the right (presented with clutter).
Previous work has shown that the loss of information in the periphery relative to the fovea goes much beyond issues of acuity.6 In fact, reduced peripheral acuity has only a modest effect on visual performance when compared with visual crowding.7 Crowding represents a bottleneck for recognizing objects in the periphery, and therefore its characterization may also offer insight into how object recognition works. However, despite the initial description in 19363 and the recent progress in better understanding the crowding phenomenon, there is not a complete comprehension of its mechanisms.8 It appears that the phenomenon may be explained by a two-stage model in which the first stage involves detection of simple features in cortical area V1, and the second stage involves the integration of features (as an object) at an area downstream of V1.8,9 In the periphery, these ‘integration receptive fields' may be too large and, as a consequence, objects that are too close together are merged into a percept that is described as jumbled.9
Glaucoma is an optic neuropathy associated with progressive loss of visual field. The disease is a leading cause of blindness and visual impairment in the world.10 Loss of vision from glaucoma tends to disproportionally affect peripheral vision and may impact the ability to perform many daily tasks, such as visual search, reading, walking, and driving.11 Despite the relevance of crowding to peripheral vision and the fact that glaucoma is the most common condition affecting the peripheral field, no study has yet investigated the effects of glaucomatous damage on visual crowding. Although crowding is recognizably a cortical phenomenon, loss of retinal ganglion cells in glaucoma may lead to change and reorganization of cortical receptive fields.12,13 Therefore, it is not unreasonable to speculate that the disease could potentially exert a significant effect on visual crowding in the periphery.
In the present study, we performed an investigation of visual crowding in patients with glaucoma as compared with healthy subjects. In order to investigate the hypothesis that glaucomatous damage is associated with worsening of crowding effects in peripheral vision, we collected psychophysical measurements of visual crowding, along with structural assessment of nerve tissue loss by optical coherence tomography (OCT), and standard automated perimetry (SAP).
Methods
The study included 13 subjects with glaucomatous visual field loss and 13 controls. Participants from this study were drawn from a prospective longitudinal study designed to evaluate functional impairment in glaucoma. The institutional review board approved all the methods, and written informed consent was obtained from all participants. The study adhered to the laws of the Health Insurance Portability and Accountability Act, and all study methods complied with the Declaration of Helsinki guidelines for human subject research.
All participants underwent a comprehensive ophthalmologic examination including review of medical history, visual acuity, slit-lamp biomicroscopy, IOP measurement using Goldmann applanation tonometry, corneal pachymetry, gonioscopy, dilated fundoscopy examination using a 78-diopter lens, stereoscopic optic disc photography, SAP using the 24-2 Swedish Interactive Threshold Algorithm (SITA) Standard of the Humphrey Field Analyzer II, model 750 (Carl Zeiss Meditec, Inc., Dublin, CA, USA), and OCT. Only subjects with open angles on gonioscopy were included. Patients with coexisting retinal disease, uveitis, or nonglaucomatous optic disc neuropathy were excluded from the study.
Glaucoma was defined as the presence of two or more consecutive abnormal SAP tests at baseline, characterized by a pattern standard deviation (PSD) with P < 0.05 and/or glaucoma hemifield test results outside normal limits, and evidence of glaucomatous optic neuropathy based on masked assessment of stereo photographs. Healthy control subjects were recruited from the general population and had IOP of 21 mm Hg or less, SAP results within normality, and were required to have normal appearance of the optic disc on masked grading of stereo photographs.
Standard Automated Perimetry
Only reliable tests (≤33% fixation losses and false-negative results, and ≤15% false-positive results) were included. Visual fields were reviewed and excluded in cases where other factors influenced the results, such as eyelid or lens rim artifacts, fatigue effects, inattention, or inappropriate fixation. Visual fields were also reviewed for the presence of abnormalities that could indicate diseases other than glaucoma. The worse eye of each patient was selected for testing, as indicated by the mean deviation (MD). If SAP MD of the worse eye was ≤ −20 dB, the better eye was used. For each quadrant of the visual field we obtained a mean sensitivity (MS) value by obtaining the geometric average of the threshold sensitivities of the corresponding points.
Optical Coherence Tomography
Spectral-domain OCT (Spectralis SD-OCT, software version 5.4.7.0; Heidelberg Engineering, Heidelberg, Germany) was used to measure the retinal nerve fiber layer (RNFL) thickness in the present study. Details of the instrument have been published elsewhere.14 Peripapillary RNFL thickness measurements were obtained within a 3.45-mm circle scan centered on the optic disc. All images were reviewed to ensure good quality, with signal strength greater than 15 dB. RNFL thickness measurements were extracted corresponding to the quadrant areas determined by SAP using a previously described structure-function map.15
Visual Crowding Assessment
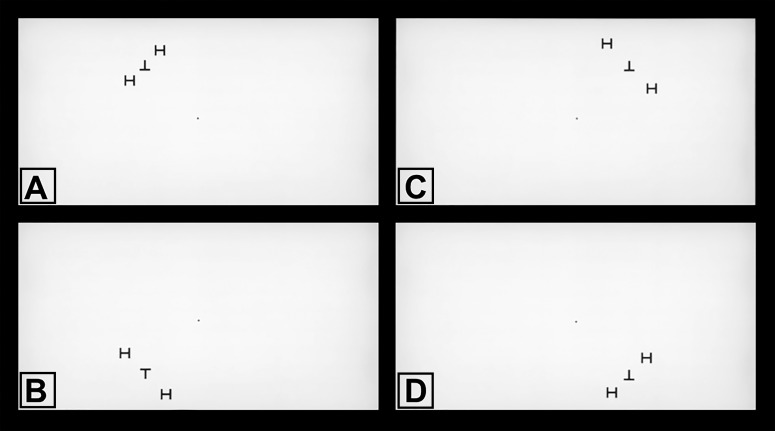
Assessment of visual crowding was based on quantifying the scritical (i.e., the distance at which flanks degrade the performance in recognizing a target). The target was a letter T, which could be oriented up (“T”) or down (“⊥”), presented at 10° of eccentricity in each quadrant of the field of view as follows: temporal superior, nasal superior, temporal inferior, and nasal inferior. The target was surrounded by radial flanking distractors (letter “H”), presented at varying distances from the target during the experiment (Fig. 2). The experiment was performed using a 40-in LCD screen in a darkened room. The screen was centered at the subject's eye level, at 43.3 in of distance, allowing the target to be positioned at 10° of eccentricity, with a fixed letter size corresponding to 1.3° of visual angle. All letters were presented in black on a white background and were of identical height and width.
Figure 2.
Screenshots of the visual crowding test. While fixating the center dot, subjects were required to identify the visual target stimulus (either upright or downright letter “T”) surrounded by radial flanking distractors (letter “H”). Target stimuli were presented at 10° of eccentricity, one quadrant at a time, in random order: (A) upper left quadrant, (B) lower left quadrant, (C) upper right quadrant, and (D) lower right quadrant. Note the variable spacing between the target and the flankers. The distance at which flankers degraded the performance in recognizing the target was considered the critical spacing.
Subjects were instructed to fixate a central point before stimulus onset and to maintain central fixation during the trials. The target and flankers were presented for 240 ms and randomly interleaved by quadrant. The subjects were required to indicate whether they saw the upright or downright “T” by pressing the appropriate key on the computer keyboard, in a two-alternative forced choice task (2-AFC). Following the response, a new trial was started. No feedback was given. The experiment consisted of 12 blocks of 50 trials each, giving a total of 600 trials. Between blocks, the subjects received a short break to avoid fatigue. Within each block, the spacing between target and flankers was randomly intermixed. Spacing conditions appeared with equal probability (including a “target-only” condition where the target appeared without distractors). A test block of 50 trials with feedback was performed before the experiment, so that the experimenter was sure that the subject understood the procedure. Participants who were unable to maintain fixation were excluded from the study.
Crowding occurs when target-flanker spacing falls below a critical value and recognition of the target letter is reduced. We computed the scritical value by fitting a logistic psychometric function to the data relating accuracy of target detection versus spacing between target and flankers. scritical was considered as the spacing corresponding to 75% accuracy, as in a conventional 2-AFC experiment.16
In order to isolate the effect of crowding from that of simply missing the target due to visual field loss, it was important to ensure that subjects could see the target in isolation. Therefore, for each quadrant, we required subjects to have 90% accuracy in identifying the target when presented in isolation.8,17 If 90% accuracy was not achieved for a particular quadrant, calculations of scritical were not performed for that quadrant and the quadrant was excluded from further analyses.
Statistical Analysis
Descriptive statistics included mean and SD. Normality assumption was assessed by inspection of histograms and using Shapiro-Wilk tests. Student's t-tests were used for group comparison for normally distributed variables and Wilcoxon rank-sum tests for continuous nonnormally distributed variables.
We initially ran univariable models investigating the relationship between OCT RNFL thickness and scritical. Subsequently, multivariable models were used, adjusting for potential confounding factors such as age, sex, and race. Generalized estimating equations (GEE) with robust sandwich variance estimators were used to adjust for potential correlations between measurements obtained in the same individual.
Scriticals were obtained using Matlab software (MathWorks Inc., Natick, MA, USA). The psychometric curves for illustration purposes were obtained using OriginPro (OriginLab Corporation, Northampton, MA, USA). All other statistical analyses were performed with commercially available software (Stata, version 14; StataCorp LP, College Station, TX, USA). The α level (type I error) was set at 0.05.
Results
Demographic and clinical characteristics are summarized in Table 1. There were no statistically significant differences in age, sex, or race between the groups. As expected, glaucoma eyes had significantly thinner global OCT RNFL thickness than healthy subjects (66.2 ± 12.2 vs. 77.2 ± 10.8 μm; P = 0.027) as well as significantly higher SAP PSD (4.7 ± 3.6 vs. 2.6 ± 2.0 dB; P = 0.038). Glaucoma eyes had lower SAP MD compared with controls, although the difference did not reach statistical significance (−3.0 ± 3.1 vs. −1.3 ± 2.5 dB; P = 0.130).
Table 1.
Demographic and Clinical Characteristics of Subjects Included in the Study
| Healthy Control | Glaucoma |
P
Value |
|
|
(n
= 13) |
(n
= 13) |
||
| Age, y | 69.7 ± 9.2 | 72.0 ± 9.3 | 0.518* |
| Sex, female (%) | 8 (61.5) | 6 (46.2) | 0.695† |
| Race, African American (%) | 3 (23.1) | 2 (15.4) | 1.000† |
| Eye tested, left eye (%) | 6 (46.2) | 5 (38.5) | 1.000† |
| Visual acuity, 10 logMAR | −0.2 ± 1.1 | 0.0 ± 1.5 | 0.700‡ |
| SAP 24-2 MD, dB | −1.3 ± 2.5 | −3.0 ± 3.1 | 0.130‡ |
| SAP 24-2 MS, dB | 29.3 ± 2.5 | 28.2 ± 2.1 | 0.514§ |
| SAP 24-2 PSD, dB | 2.6 ± 2.0 | 4.7 ± 3.6 | 0.038‡ |
| Global RNFL thickness, μm | 77.2 ± 10.8 | 66.2 ± 12.2 | 0.027‡ |
| scritical, minimum of visual angle | 145.8 ± 28.0 | 170.4 ± 27.1 | 0.007§ |
Values are presented as mean ± SD, unless otherwise noted.
Student's t-test.
Fisher's exact test.
Wilcoxon rank-sum test.
Generalized estimating equation.
For the visual crowding task, subjects performed a total of 15,600 trials. In 35 quadrants of 20 subjects, the 90% accuracy cutoff for seeing the target in isolation was not achieved and, therefore, these quadrants were not used in calculations of scritical, leaving 69 quadrants from 26 subjects for analysis. For these 69 quadrants, there was no statistically significant difference in SAP MS by quadrant in glaucomatous versus healthy eyes (28.2 ± 2.1 vs. 29.3 ± 2.5 dB; P = 0.514; GEE), reflecting the requirement that subjects had still relatively preserved vision in each quadrant to see the target in isolation. However, for these quadrants, glaucomatous eyes had significantly greater scritical compared with healthy eyes (170.4 ± 27.1 vs. 145.8 ± 28.0 minimum of visual angle; P = 0.007; GEE), indicating a significantly worse crowding effect in glaucoma.
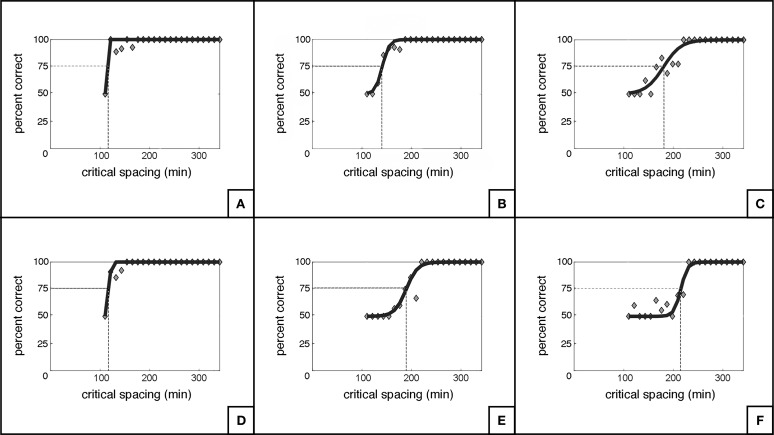
Table 2 summarizes the relationships between scritical and several predictor variables. A significant association was found between scritical and the corresponding OCT RNFL thickness in each quadrant (R2 = 26%; P < 0.001; Fig. 3). However, the correlation between scritical and SAP MS values per quadrant was not found to be significant (R2 = 0%; P = 0.947; Fig. 4). Additionally, there were no statistically significant relationships between scritical and visual acuity, age, sex, or race in this sample. In a multivariable model adjusting for age, race, and sex, RNFL thickness maintained its significant association with scritical. Each 10 μm lower RNFL thickness was associated with an increase in scritical of 6.63 minimum of visual angle (95% CI: 3.84–9.42 min of visual angle; P < 0.001). Figure 5 illustrates psychometric functions for determining scritical obtained from a normal and a glaucoma subject, along with SAP and OCT results. And Figure 6 illustrates the smallest (best), the typical and the largest (worst) critical spacing results from each group.
Table 2.
Univariable Analysis for Relationships Between Critical Spacing and Possible Predictor Variables
|
Characteristic |
Univariable Model |
|
|
Coefficient (95% CI) |
P
Value |
|
| RNFL, per 10 μm lower | 6.60 (3.80 to 9.40) | <0.001 |
| SAP 24-2 MS, per dB lower | 0.13 (−3.79 to 4.06) | 0.947 |
| Diagnosis, glaucoma | 25.55 (6.89 to 44.21) | 0.007 |
| Visual acuity, per logMAR lower | 20.37 (−79.15 to 119.89) | 0.688 |
| Age, per year younger | 0.17 (−1.05 to 1.38) | 0.788 |
| Sex, female | 10.89 (−10.07 to 31.86) | 0.309 |
| Race, African American | 7.77 (−23.86 to 39.40) | 0.630 |
Figure 3.
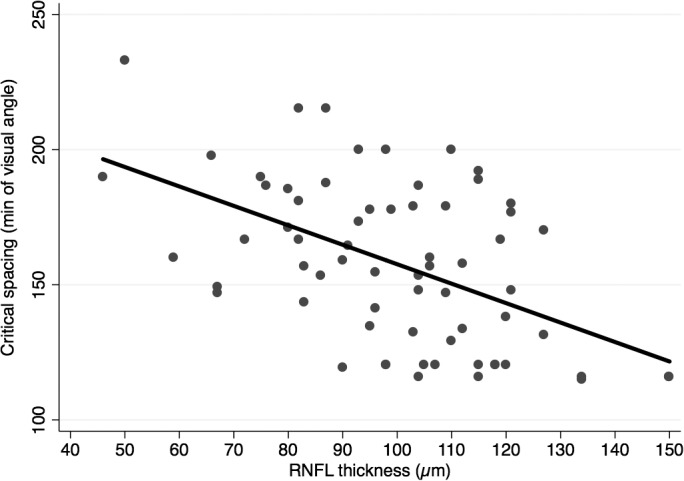
Scatterplot illustrating the relationship between critical spacing and retinal nerve fiber layer (RNFL) thickness.
Figure 4.
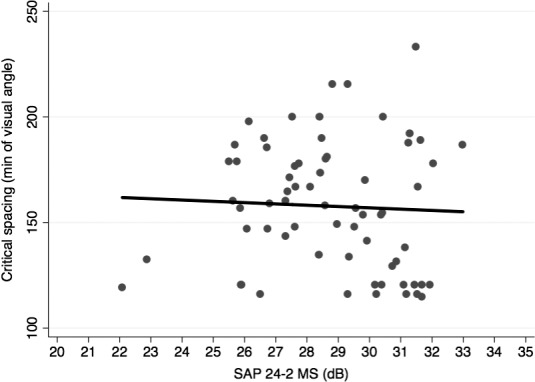
Scatterplot illustrating the relationship between critical spacing and standard automated perimetry (SAP) 24-2 mean sensitivity (MS).
Figure 5.
Examples of psychometric functions (A) obtained in the inferior nasal quadrant of the visual field from a normal patient (B) and a glaucoma patient (C) with their respective SAP and OCT results.
Figure 6.
Illustration of the smallest/best (A), the typical (B), and the largest/worst (C) critical spacing results from the normal group, and the respective curves for the glaucoma group (D–F).
Discussion
In this pilot investigation, we showed that glaucoma patients experienced a significantly greater effect of visual crowding compared with healthy subjects. The magnitude of the crowding effect, in terms of scritical, was significantly correlated to the amount of nerve tissue loss as measured by OCT. Although patients with glaucoma were able to see and correctly discriminate target orientation when presented in isolation, they had significantly more trouble than healthy subjects in recognizing the target under crowded conditions. This result suggests that tests of visual crowding place demands on the visual system that may reveal neural losses in glaucoma earlier than identification/discrimination tasks involving isolated targets.
In order to isolate the effect of crowding on target orientation discrimination, it was important to ensure that glaucoma subjects were actually able to see the target when presented in isolation. As in previous studies investigating visual crowding,8 we required subjects to accurately discriminate at least 90% of isolated targets, in each of the quadrants. As a consequence, we were only able to investigate crowding effects in quadrants that had relatively mild or undetectable field loss on standard perimetry. Despite this fact, visual crowding effects were still prominent, with glaucoma subjects exhibiting a significantly larger scritical than healthy individuals. Importantly, the magnitude of scritical was significantly associated with RNFL thickness measurements obtained by OCT, as illustrated in Figure 3. Each 10-μm thinner RNFL was associated with 6.6 minimum of angle increase in the scritical. This finding suggests that assessment of visual crowding may provide a sensitive measure of visual function that corresponds well to the degree of neural tissue loss in glaucoma, even before substantial visual field loss is apparent on SAP.
Despite the widespread belief that peripheral vision is most strongly limited by its relatively low acuity compared with the fovea, the drop off in performance for visual crowding is decidedly more severe. Indeed, the slope of the decline in performance between retinal eccentricity and scritical is much steeper than that found between eccentricity and visual acuity,7 which indicates that crowding exerts a much more limiting impact than acuity on the capacity of peripheral vision. As an example of this phenomenon, Anstis6 showed that even quite far in the periphery, visual acuity is sufficient to read isolated letters. Increasing letter density, however, made identification of single letters significantly more difficult; this accounts for why it is so difficult to read text in the periphery. As we live in a cluttered world, crowding limits the ability to perform many daily tasks, such as finding car keys on a cluttered desk (see Fig. 1), for example. Crowding impairs not only discrimination of object features, but also the ability to respond appropriately to objects in clutter. When driving, a hazard that would be clearly detected in isolation may not be recognized and acted upon if presented in a cluttered situation. Because neural losses in glaucoma appear to be associated with stronger crowding effects, our findings may have important implications for how glaucoma patients perform several daily tasks. Future studies could attempt to quantify crowding magnitude in glaucoma patients for tasks that impact safety (e.g., driving) and quality of life (e.g., reading speed).
The mechanisms underlying visual crowding are still not completely understood. It is known that crowding is a cortical phenomenon,18 although the precise locus is unknown. This can be demonstrated by showing that significant crowding effects occur when the target and flankers are presented to each eye separately.19,20 It appears that cortical areas responsible for integrating object features make the features appear indistinct if they are within an “integration receptive field.”13 Larger integration fields occur in more eccentric regions of the peripheral vision, which would appear to explain why crowding effects are worse with eccentricity. In terms of why neural loss in glaucoma would result in worse crowding effects, previous studies have shown that retinal ganglion cell loss in glaucoma is associated with expanded regions of visual integration.12,13,21,22 This would likely lead to a summation of sorts, where features of objects in the periphery would be lost, in favor of simple detection. Glaucoma patients exhibit enlarged areas of summation in the periphery as shown by Redmond et al.,13 who found that loss of sensitivity could be completely compensated for by this neural adaptational change. Behaviorally, this idea is supported by the fact that crowding depends strongly on target/flanker similarity—the decreased sampling caused by retinal ganglion cells loss could affect feature distinction and make otherwise differentiating features appear similar when seen through glaucomatous eyes. The significant negative correlation between RNFL thickness and scritical determined in the present study provide anatomic and behavioral data to support this hypothesis.
In the current study, we used a fixed letter size to study crowding effects. As the letter was of relatively small size, the requirement that it would have to be seen in isolation essentially eliminated subjects with moderate or advanced visual field loss. However, for subjects with worse field losses, crowding effects would have likely been quantifiable if targets of different sizes had been used. In terms of stimulus conditions for testing visual crowding, previous studies have shown that radially oriented flankers induce more crowding than tangentially oriented ones; this informed our choice of stimulus configuration in the present study.8 However, to determine fully the impact of different patterns on visual performance in crowding, future studies should investigate different stimulus configurations at different eccentricities in glaucoma patients.
Although the present study included a relatively small sample of subjects, those who participated underwent exhaustive psychophysical testing. Our results should be viewed as a pilot investigation of the relationship between visual crowding and glaucomatous damage—additional investigations with larger samples and different testing conditions are needed to help further elucidate this relationship. The development and validation of a psychophysical test that could quickly assess visual crowding in glaucomatous patients may provide a useful tool to assess functional performance in this population.
In conclusion, we demonstrated that visual crowding effects were significantly worse in glaucoma patients compared with healthy subjects. Additionally, the severity of visual crowding was significantly associated with the amount of neural loss quantified by OCT. Our findings suggest that visual crowding in glaucoma may be due to increased areas of peripheral receptive field integration, and may have implications for understanding how glaucoma patients are affected in daily tasks where crowding effects may be significant, such as driving, reading, visual search, and object identification. Lastly, tests of visual crowding may provide a clinical means for use in diagnosis and monitoring neural loss in glaucoma.
Acknowledgments
Supported in part by National Institutes of Health/National Eye Institute (Bethesda, MD, USA) Grant EY025056 (FAM) and EY021818 (FAM).
Disclosure: N.G. Ogata, None; E.R. Boer, None; F.B. Daga, None; A.A. Jammal, None; J.M. Stringham, None; F.A. Medeiros, None
References
- 1.Whitney D, Levi DM. Visual crowding: a fundamental limit on conscious perception and object recognition. Trends Cogn Sci. 2011;15:160–168. doi: 10.1016/j.tics.2011.02.005. [DOI] [PMC free article] [PubMed] [Google Scholar]
- 2.Astle AT, Blighe AJ, Webb BS, McGraw PV. The effect of aging on crowded letter recognition in the peripheral visual field. Invest Ophthalmol Vis Sci. 2014;55:5039–5045. doi: 10.1167/iovs.14-14181. [DOI] [PMC free article] [PubMed] [Google Scholar]
- 3.Ehlers H. V: the movements of the eyes during reading. Acta Ophthalmol. 1936;14:56–63. [Google Scholar]
- 4.Stuart JA, Burian HM. A study of separation difficulty: its relationship to visual acuity in normal and amblyopic eyes. Am J Ophthalmol. 1962;53:471–477. [PubMed] [Google Scholar]
- 5.Bouma H. Interaction effects in parafoveal letter recognition. Nature. 1970;226:177. doi: 10.1038/226177a0. [DOI] [PubMed] [Google Scholar]
- 6.Anstis SM. Letter: a chart demonstrating variations in acuity with retinal position. Vision Res. 1974;14:589–592. doi: 10.1016/0042-6989(74)90049-2. [DOI] [PubMed] [Google Scholar]
- 7.Rosenholtz R. Capabilities and limitations of peripheral vision. Annu Rev Vis Sci. 2016;2:437–457. doi: 10.1146/annurev-vision-082114-035733. [DOI] [PubMed] [Google Scholar]
- 8.Levi DM. Crowding—an essential bottleneck for object recognition: a mini-review. Vision Res. 2008;48:635–654. doi: 10.1016/j.visres.2007.12.009. [DOI] [PMC free article] [PubMed] [Google Scholar]
- 9.Pelli DG, Tillman KA. The uncrowded window of object recognition. Nat Neurosci. 2008;11:1129–1135. doi: 10.1038/nn.2187. [DOI] [PMC free article] [PubMed] [Google Scholar]
- 10.Quigley HA, Broman AT. The number of people with glaucoma worldwide in 2010 and 2020. Br J Ophthalmol. 2006;90:262–267. doi: 10.1136/bjo.2005.081224. [DOI] [PMC free article] [PubMed] [Google Scholar]
- 11.Ramulu P. Glaucoma and disability: which tasks are affected, and at what stage of disease? Curr Opin Ophthalmol. 2009;20:92–98. doi: 10.1097/ICU.0b013e32832401a9. [DOI] [PMC free article] [PubMed] [Google Scholar]
- 12.King WM, Sarup V, Sauve Y, et al. Expansion of visual receptive fields in experimental glaucoma. Vis Neurosci. 2006;23:137–142. doi: 10.1017/S0952523806231122. [DOI] [PubMed] [Google Scholar]
- 13.Redmond T, Garway-Heath DF, Zlatkova MB, Anderson RS. Sensitivity loss in early glaucoma can be mapped to an enlargement of the area of complete spatial summation. Invest Ophthalmol Vis Sci. 2010;51:6540–6548. doi: 10.1167/iovs.10-5718. [DOI] [PubMed] [Google Scholar]
- 14.Leite MT, Rao HL, Weinreb RN, et al. Agreement among spectral-domain optical coherence tomography instruments for assessing retinal nerve fiber layer thickness. Am J Ophthalmol. 2011;151:85–92.e1. doi: 10.1016/j.ajo.2010.06.041. [DOI] [PubMed] [Google Scholar]
- 15.Garway-Heath DF, Poinoosawmy D, Fitzke FW, Hitchings RA. Mapping the visual field to the optic disc in normal tension glaucoma eyes. Ophthalmology. 2000;107:1809–1815. doi: 10.1016/s0161-6420(00)00284-0. [DOI] [PubMed] [Google Scholar]
- 16.McKee SP, Klein SA, Teller DY. Statistical properties of forced-choice psychometric functions: implications of probit analysis. Percept Psychophys. 1985;37:286–298. doi: 10.3758/bf03211350. [DOI] [PubMed] [Google Scholar]
- 17.Toet A, Levi DM. The two-dimensional shape of spatial interaction zones in the parafovea. Vision Res. 1992;32:1349–1357. doi: 10.1016/0042-6989(92)90227-a. [DOI] [PubMed] [Google Scholar]
- 18.Pelli DG. Crowding: a cortical constraint on object recognition. Curr Opin Neurobiol. 2008;18:445–451. doi: 10.1016/j.conb.2008.09.008. [DOI] [PMC free article] [PubMed] [Google Scholar]
- 19.Flom MC, Heath GG, Takahashi E. Contour interaction and visual resolution: contralateral effects. Science. 1963;142:979–980. doi: 10.1126/science.142.3594.979. [DOI] [PubMed] [Google Scholar]
- 20.Tripathy SP, Levi DM. Long-range dichoptic interactions in the human visual cortex in the region corresponding to the blind spot. Vision Res. 1994;34:1127–1138. doi: 10.1016/0042-6989(94)90295-x. [DOI] [PubMed] [Google Scholar]
- 21.Ahmed FAKM, Chaudhary P, Sharma SC. Effects of increased intraocular pressure on rat retinal ganglion cells. Int J Dev Neurosci. 2001;19:209–218. doi: 10.1016/s0736-5748(00)00073-3. [DOI] [PubMed] [Google Scholar]
- 22.Della Santina L, Inman DM, Lupien CB, et al. Differential progression of structural and functional alterations in distinct retinal ganglion cell types in a mouse model of glaucoma. J Neurosci. 2013;33:17444–17457. doi: 10.1523/JNEUROSCI.5461-12.2013. [DOI] [PMC free article] [PubMed] [Google Scholar]


