Abstract
Cisplatin is a well‐known anticancer drug used to treat various cancers. However, development of cisplatin resistance has hindered the efficiency of this drug in cancer treatment. Development of chemoresistance is known to involve many signaling pathways. Recent attention has focused on microRNAs (miRNAs) as potentially important upstream regulators in the development of chemoresistance. CD44 is one of the gastric cancer stem cell markers and plays a role in regulating self‐renewal, tumor initiation, metastasis and chemoresistance. The purpose of the present study was to examine the mechanism of miRNA‐mediated chemoresistance to cisplatin in CD44‐positive gastric cancer stem cells. We sorted gastric cancer cells according to level of CD44 expression by FACS and analyzed their miRNA expression profiles by microarray analysis. We found that miR‐193a‐3p was significantly upregulated in CD44(+) cells compared with CD44(−) cells. Moreover, SRSF2 of miR‐193a‐3p target gene was downregulated in CD44(+) cells. We studied the modulation of Bcl‐X and caspase 9 mRNA splicing by SRSF2 and found that more pro‐apoptotic variants of these genes were generated. We also found that downstream anti‐apoptotic genes such as Bcl‐2 were upregulated, whereas pro‐apoptotic genes such as Bax and cytochrome C were downregulated in CD44(+) cells compared to CD44(−) cells. In addition, we found that an elevated level of miR‐193a‐3p triggered the development of cisplatin resistance in CD44(+) cells. Inhibition of miR‐193a‐3p in CD44(+) cells increased SRSF2 expression and also altered the levels of multiple apoptotic genes. Furthermore, inhibition of miR‐193a‐3p reduced cell viability and increased the number of apoptotic cells. Therefore, miR‐193a‐3p may be implicated in the development of cisplatin resistance through regulation of the mitochondrial apoptosis pathway. miR‐193a‐3p could be a promising target for cancer therapy in cisplatin‐resistant gastric cancer.
Keywords: apoptosis, cancer, CD44(+) cell, cisplatin, miR‐193a‐3p
1. INTRODUCTION
To date, chemotherapy has been the primary strategy for cancer treatment. However, chemoresistance is a major obstacle to chemotherapy and is one of the main causes of its failure. Chemoresistance has been shown to develop by three different mechanisms. These mechanisms include deterioration of water‐soluble drugs resulting in reduced drug uptake, changes in cells that affect the cytotoxicity of drugs, such as decreased apoptosis or increased DNA repair action, and increased efflux of hydrophobic drugs by ATP‐binding cassette transporters.1 However, the modulation of chemoresistance is still a topic of investigation and complete understanding of the mechanisms underlying the development of chemoresistance has the potential to be enormously helpful to cancer therapy.
Cisplatin (also known as CDDP), a platinum compound, is one of the most commonly used anticancer drugs. Cisplatin was discovered in the 1840s and has been used to treat various types of cancers. Cisplatin binds and crosslinks DNA, thereby inducing apoptosis.2 In advanced gastric cancer, combination chemotherapies including cisplatin have been shown to result in improved survival times and response rates.3, 4 Cisplatin resistance has been thoroughly investigated and many different mechanisms of cisplatin resistance have been proposed (pre‐, on‐, post‐, and off‐target).5 Apoptosis refers to programmed cell death and is distinct from other types of cell death such as necrosis. Apoptosis can occur through two different pathways, termed the intrinsic and extrinsic pathways. The intrinsic apoptosis pathway is related to mitochondrial permeability and is controlled by Bcl‐2 family proteins, which regulate permeabilization of the mitochondrial outer membrane.6 Reactive oxygen species (ROS) can also create pores in the mitochondrial membrane, triggering apoptosis.7 In the extrinsic apoptosis pathway, death receptors convey death signals from the cell surface to intracellular mediators of this pathway.8 Cells undergoing apoptosis show distinct morphological changes. In particular, apoptotic cells show small DNA fragments composed of compacted nuclear contents. Apoptotic cells also migrate and form apoptotic bodies.9
MicroRNAs (miRNAs) are 22‐nucleotide non‐coding RNAs that regulate cellular processes by targeting sequence‐specific mRNAs. Generally, miRNAs inhibit translation by binding to the 3′‐ 3′UTR of their target mRNAs.10 Several miRNAs have been reported to cause drug resistance or suppress apoptosis.11 miRNAs regulate chemoresistance by targeting tumor suppressor or drug transporter genes.12 High expression of microRNA (miR)‐221/222 has been shown to confer tamoxifen resistance to breast cancer cells through a mechanism that targets p27.13, 14 Multidrug resistance in gastric cancer cells has also been shown to be associated with decreased expression of miR‐15b and miR‐16.15
CD44 is one of the gastric cancer stem cell markers and is critical in regulating self‐renewal, tumor initiation, metastasis and chemoresistance. In addition, CD44 correlates with poor prognosis in various human cancers, including breast, brain, colon, pancreatic, and gastric cancers.16 In our previous study, we reported upregulated CD44 expression in gastric cancer cells and the miR‐106b family was significantly upregulated in CD44‐positive cancer cells.17 Although miRNA regulation has been examined as a cancer stem cell characteristic, the mechanism of the miR‐193a‐3p‐dependent cisplatin resistance response underlying gastric cancer stemness has not been fully studied.
Herein, we evaluated cisplatin resistance in CD44(+) gastric cancer cells and found that upregulation of miR‐193a‐3p was associated with cisplatin resistance. We analyzed the expression levels of miR‐193a‐3p target such as SRSF2 and various isoforms of downstream SRSF2 targets, including pro‐ and anti‐apoptotic genes. Furthermore, we examined the mechanisms of apoptosis regulation by miR‐193a‐3p, we inhibited miR‐193a‐3p in CD44(+) cells and measured cell viability after cisplatin treatment. We found that miR‐193a‐3p might have potential as a therapeutic target to treat diseases such as cisplatin‐resistant gastric cancer through regulation of the mitochondrial apoptosis pathway.
2. MATERIALS AND METHODS
2.1. Cell culture
MKN45 (KCLB 80103), AGS (ATCC CRL‐1739) and KATO III (KCLB 30103) gastric cancer cells were maintained in RPMI‐1640 medium (Thermo Scientific, Rockford, IL, USA) supplemented with 10% FBS (Thermo Scientific) and 1% penicillin‐streptomycin sulfate (Thermo Scientific). All cultures were maintained in a 37°C incubator supplemented with 5% CO2.
2.2. Flow cytometry analysis and FACS
For flow cytometry, approximately 80% confluent cells in a 100‐mm cell plate were washed with PBS. Cells were then detached from plates using trypsin‐EDTA and centrifuged at 4°C. Cell pellets were resuspended in HBSS (Gibco, Grand Island, NY, USA) supplemented with 1 mM HEPES (Gibco) and 2% FBS and filtered with a 40‐μm mesh filter (BD Biosciences, San Jose, CA, USA). Cells were stained with a 400‐fold dilution of anti‐CD44‐FITC (BD Biosciences) and incubated for 30 minutes in a 37°C incubator supplemented with 5% CO2. The cells were then washed with HBSS and resuspended in HBSS supplemented with 1 mM HEPES, 2% FBS and 1% penicillin‐streptomycin sulfate. The cells were analyzed and sorted immediately with the FACS Aria III (BD Biosciences).
2.3. MicroRNA microarray
Total RNA from CD44(+) and CD44(−) MKN45 cells was prepared using TRIzol reagent according to the manufacturer's instructions. Microarrays were carried out using the Agilent Human miRNA 8 X 60K (Rel 16.0 V2) platform (Agilent Technologies, Palo Alto, CA, USA). RNA hybridizations were done with the Human microRNA Microarray Kit (Agilent Technologies) according to the manufacturer's protocol. Arrays were scanned on an Agilent C scanner. Images were quantified and data were processed using Agilent Feature Extraction Software (v 10.10.1.1). Raw data were extracted using software provided by the Agilent Feature Extraction Software (v 10.7.1.1). Selected miRNAgTotalGeneSignal values were logarithmically transformed and normalized by the quantile method. Each comparative analysis between test sample and control sample was carried out using fold‐change. Hierarchical cluster analysis was carried out using complete linkage and Euclidean distance as a measure of similarity.
2.4. Tissue microarray construction from gastric cancer patients
In order to evaluate the relationship between the clinicopathological characteristics of gastric cancers and the expression of CD44 in vivo, we carried out immunohistochemical (IHC) staining for CD44 using tissue microarray (TMA). TMA were constructed from 277 pairs of gastric cancer tissue samples and corresponding normal tissues that were obtained from patients who had undergone curative surgery for gastric cancer at Yonsei University, Severance Hospital between April 2001 and December 2003. This study was approved by the Institutional Review Board of Severance Hospital. TMA were constructed as previously described. On H&E‐stained slides of tumors, a representative area was selected and the corresponding spot was marked on the surface of the paraffin block. Using a biopsy needle, the selected area was punched out and a 2‐mm tissue core was placed into an 8 × 6 recipient block. Gastric cancer tissues and corresponding normal tissues were then extracted. Each tissue core was assigned a unique TMA location number that was linked to a database containing other clinicopathological data.
2.5. Immunohistochemistry assay
Tissue microarrays blocks were sectioned at a thickness of 3 μm and automated immunostaining done with Ventana Benchmark XT (Ventana Medical Systems, Tucson, AZ, USA) with antibody against CD44 (1:100; Cell Marque, Rocklin, CA, USA). All slides were detected with ultraView universal DAB kit (Ventana Medical Systems) and counterstained with hematoxylin. IHC results were scored on tumor cells with cytoplasmic staining as follows: 0, faint staining intensity in less than 5% of cells; 1+, weak staining in 5%‐10% of cells; 2+, moderate staining in 10%‐50% of cells; 3+, strong staining in more than 50% of cells. Tumor was considered as positive when the score was 2+ or 3+, negative when the score was 0 or 1+.
2.6. Real‐time PCR
Total RNA was extracted from cells using TRIzol reagent (Invitrogen, Carlsbad, CA, USA) according to the manufacturer's instructions. First‐strand cDNA was synthesized using oligo(dT) primers and Superscript II reverse transcriptase (Invitrogen). Real‐time PCR was carried out with a PCR mixture containing each primer (1 μM) and SYBR Green Master Mix (Applied Biosystems, Foster City, CA, USA). Thermocycling conditions included incubations at 95°C for 10 seconds and 60°C for 60 seconds that were carried out using a StepOnePlus real‐time PCR machine (Applied Biosystems). Each sample was examined in triplicate and the amount of PCR product was normalized with respect to β‐actin as an internal control. Real time PCR primers are shown in Table 1.
Table 1.
Primer sequences
| Gene | Direction | Sequence (5′‐3′) |
|---|---|---|
| SRSF2 | F | AACCTGACCTACCGCACCTC |
| R | TGTCGTGAAAGCGAACGAAG | |
| E2F1 | F | TGACGTGTCAGGACCTTCGT |
| R | GCTGATCCCACCTACGGTCT | |
| E2F6 | F | TCAGGCCTTCCATGAACAGA |
| R | AGGTCCCGACACCTTCAGAC | |
| MCL1 | F | CAGAGGAGGAGGAGGACGAG |
| R | CATTGGCTTTGTGTCCTTGG | |
| PCNA | F | GGACTCGTCCCACGTCTCTT |
| R | GCGTTATCTTCGGCCCTTAG | |
| Bcl‐XL | F | ATCAATGGCAACCCATCCTG |
| R | TTGTCTACGCTTTCCACGCA | |
| Caspase 9a | F | AGTGGACATTGGTTCTGGAG |
| R | CTTCTCACAGTCGATGTTGG | |
| Bax | F | TGATCAGAACCATCATGGGC |
| R | CAAAGATGGTCACGGTCTGC | |
| Cytochrome C | F | GGAGGCAAGCATAAGACTG |
| R | GTCTGCCCTTTCTCCCTTCT | |
| Bcl‐2 | F | CCGTTGGCCCCCGTTGCTTT |
| R | CTGGCGGAGGGTCAGGTGGA | |
| β‐Actin | F | TTGCCGACAGGATGCAGAAG |
| R | AGGTGGACAGCGAGGCCAGG |
cDNA for the miRNA assay was synthesized using the TaqMan MicroRNA Reverse Transcription Kit (Applied Biosystems) with miR‐193a‐3p and U6‐specific primers (Applied Biosystems), according to the manufacturer's instructions. Real‐time PCR for miRNA quantification was carried out with the TaqMan Universal Master Mix II (Applied Biosystems). The amplifications were conducted at 95°C for 10 seconds and at 60°C for 60 seconds using an AB7500 real‐time PCR system (Applied Biosystems). Each sample was examined in triplicate and the amount of PCR product was normalized with respect to U6 as an internal control.
2.7. Western blot analysis
After washing with PBS, cells were harvested and resuspended in lysis buffer (50 mM Tris‐Cl [pH 7.5], 150 mM NaCl, 1 mM EDTA [pH 8.0], 1% Triton X‐100, 1 mM PMSF, 1 mM Na3VO4 and protease inhibitor cocktail [Roche Molecular Biochemicals, Indianapolis, IN, USA]). After quantifying the amount of protein in each lysate, equal amounts of protein were prepared by heating the samples at 95°C after the addition of SDS sample buffer (62.5 mM Tris‐Cl [pH 6.8], 2% SDS, 10% glycerol, β‐mercaptoethanol and 0.002% bromophenol blue). Samples were loaded onto 8% SDS‐PAGE gels for SRSF2 and 12% SDS‐PAGE gels for Bcl‐XL, Bax, Bcl‐2, cytochrome C, cleaved caspase‐3 and cleaved caspase‐9. Samples were then transferred to PVDF membranes. Antibodies used included SRSF2 (1:1000; BD Biosciences), Bcl‐XL (1:1000; Cell Signaling, Danvers, MA, USA), Bax (1:1000; Abcam, Cambridge, UK), Bcl‐2 (1:1000; Santa Cruz Biotechnology, Santa Cruz, CA, USA), cytochrome C (1:1000; Cell Signaling), cleaved caspase‐3 (1:1000; Cell Signaling), cleaved caspase‐9 (1:1000; Cell Signaling) and β‐actin (1:2000; Santa Cruz Biotechnology) as a loading control.
2.8. Immunofluorescence assay
Cells were seeded on glass coverslips in six‐well plates. After an overnight incubation, cells were washed with PBS three times, fixed in 4% formaldehyde for 10 minutes and permeabilized in 0.1% Triton X‐100 in PBS for 3 minutes. Cells were washed three times with PBS, blocked with 1% BSA in PBS and then incubated with primary antibodies overnight at 4°C. After washing with PBS, cells were incubated with FITC‐conjugated secondary antibodies for 1 hour at room temperature. Mitochondria were stained with Mitotracker (Invitrogen) at a 50 nM working concentration for 10 minutes. Slides were mounted with DAPI. All samples were photographed using a Zeiss LSM 700 confocal microscope (Carl Zeiss, Oberkochen, Germany).
2.9. MicroRNA inhibitor transfection
MicroRNA inhibitor was purchased from GenePharma (Applied Biosystems, Shanghai, China). Cells were seeded into six‐well plates and incubated overnight. The cells were transfected with miR‐193a‐3p inhibitor (ACUGGGACUUUGUAGGCCAGUU) and negative control (CAGUACUUUUGUGUAGUACAA; Applied Biosystems) using Lipofectamine 2000 (Invitrogen) according to the manufacturer's instructions. After 48 hours, the cells were harvested for RNA and protein isolation.
2.10. Annexin V apoptosis detection assay
Cells were transfected with a miR‐193a‐3p inhibitor or a negative control and incubated for 24 hours. Cells were then treated with or without cisplatin (3 μg/mL) and subsequently stained using the Annexin V‐FITC Apoptosis Detection Kit I (BD Biosciences) according to the manufacturer's instructions. Samples were analyzed by flow cytometry using the LSR II Flow Cytometer (BD Biosciences). Each experiment was independently carried out three times.
2.11. MTS assay
Cells were seeded into 96‐well plates, incubated overnight and then treated with cisplatin (2 or 2.5 μg/mL). After 72 hours, cells were incubated with CellTiter 96 AQueous One cell proliferation (MTS) assay solution (Promega, Madison, WI, USA) for 1‐2 hours in a 37°C incubator, supplemented with 5% CO2. Absorbance values were then measured at 490 nm. Each experiment was independently carried out three times.
2.12. Luciferase assay
The miR‐193a‐3p seed sequences (5‐AATTTGGGTCTTTGCGGGCGAGATGAT‐3 and 5‐CTAGATCATCTCGCCCGCAAAGACCCA‐3) were annealed and inserted into the EcoRI and XbaI sites of the CMV promoter‐driven firefly luciferase reporter, pcDNA3.1‐luc, to make the miR‐193a‐3p‐luciferase reporter constructs. The SRSF2 sequences (5‐GGGTGGTACCGTCAGCTCTCCTCGGGGCGAAG‐3 and 5‐GTACAAGCTTTCTCAGG CAGTTGCCTTCCGCG‐3) were annealed and inserted into the XhoI or HindIII sites of the pGL3 basic vector to make the SRSF2‐luciferase reporter constructs.
Cells were seeded into six‐well plates and incubated overnight. The cells were cotransfected with 2 μg firefly luciferase reporter constructs, 0.2 μg Renilla luciferase constructs or miR‐193a‐3p inhibitor, negative control (Applied Biosystems) using Lipofectamine 2000 (Invitrogen) according to the manufacturer's instructions. The Renilla luciferase constructs were used as a transfection efficiency control. After 24 hours, luciferase activity of cell lysates was measured using the Dual Luciferase Reporter System (Promega). Luminescence was measured with a Centro luminometer (Berthold, Bad Wildbad, Germany). Results are expressed as the averages of the ratios of the activities from triplicate experiments. Firefly luciferase activities were standardized with the Renilla luciferase activities.
2.13. Nuclear morphology
Cells were seeded on glass coverslips in six‐well plates. The miR‐193a‐3p inhibitor or negative control was transfected into the cells. After 24 hours, cells were treated with 3 μg/mL cisplatin for 48 hours. Cells were fixed in 4% formaldehyde for 10 minutes and permeabilized in 0.1% Triton X‐100 in PBS for 3 minutes. The slides were mounted with DAPI and observed under a fluorescence microscope.
2.14. Statistical analysis
All experiments were done more than three times. All bars are expressed as means ± standard deviations. Two‐tailed Student's t test was used for statistical analysis. A statistical difference, represented as an asterisk (*) was considered significant when P < .05.
3. RESULTS
3.1. MicroRNA‐193a‐3p is upregulated in CD44(+) gastric cancer cells
To investigate the level of CD44 in gastric cancer cells, we sorted MKN45, AGS and KATO III cells into CD44(+) and CD44(−) cells. In MKN45 cells, level of the CD44(+) population was higher than in KATO III and AGS cells (Figure 1A). To confirm the presence of CD44‐positive cancer cells in clinically retrieved gastric cancer tissues, we carried out IHC to evaluate the level of CD44‐expressing cancer cells using TMA. The TMA used in this research consisted of 277 pairs of gastric cancer tissue samples and corresponding normal tissues that were obtained from patients who had undergone curative surgery for gastric cancer at Yonsei University, Severance Hospital between April 2001 and December 2003. Immunohistochemistry of TMA tissue showed that gastric cancer tissues showed varying degrees of CD44 immunoexpression in gastric cancer cells in vivo: 5% or less in 141 cases (51%), 5%‐10% in 65 cases (23%), 10%‐50% in 47 cases (17%) and 24 cases (9%) showed more than 50% immunoexpression (Figure 1B).
Figure 1.
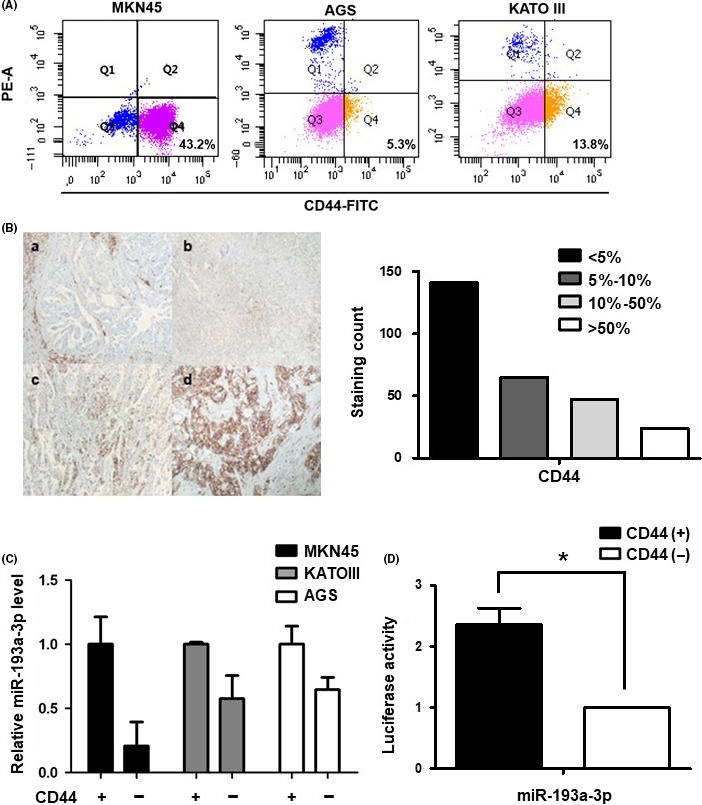
Expression of microRNA (miR)‐193a‐3p in CD44(+) and CD44(−) gastric cancer cells. A, CD44 expression analysis in MKN45, AGS and KATO III by FACS. B, Left panel; Immunohistochemistry analysis of CD44 expression in representative tumor tissues (a, CD44‐negative expression, the staining area in less than 5% of entire tumor. b, CD44‐one positive expression means that CD44 1+, weak staining in 5‐10% of cells. c, CD44‐two positive expression means that CD44 2+, moderate staining in 10%‐50% of cells. d, CD44‐three positive expression means that CD44 3+, strong staining in more than 50% of cells. Original magnification ×200). Right panel; Distribution of CD44 immunoexpression in tumor tissue from 277 patients. Tumor samples were classified into four groups (<5% [n = 141], 5%‐10% [n = 65], 10%‐50% [n = 47] and >50% [n = 24]) based on the percentage of CD44 immunostaining. C, Real‐time PCR analysis of the expression of miR‐193a‐3p in three cell lines: MKN45, KATO III and AGS. Cells were sorted according to the presence of CD44 by FACS. Level of miR‐193a‐3p was normalized by β‐actin and is presented as the relative ratio. D, Luciferase activity assay to examine the activity of miR‐193a‐3p in CD44(+) and CD44(−) MKN45 cells. Data are expressed as a ratio of Firefly to Renilla luciferase activity. Each treatment was carried out in triplicate (*P < .05)
According to our miRNA array, data showed that miR‐193a‐3p was significantly upregulated in CD44(+) cells (3.0942‐fold, P < .05) compared with CD44(−) cells.17 In order to validate our miRNA array data, we carried out real‐time PCR on independent sets of CD44(+) and CD44(−) cells. Expression pattern of miR‐193a‐3p in CD44(+) and CD44(−) cells was consistent with the miRNA array data. In MKN45 CD44(+) cells, level of miR‐193a‐3p was approximately fivefold higher than in CD44(−) cells. In the other two gastric cancer cell lines, KATO III and AGS, similar patterns of miR‐193a‐3p expression were observed (Figure 1C). Similarly, luciferase activity of miR‐193a‐3p was increased in CD44(+) compared to CD44(−) MKN45 cells (Figure 1D).
3.2. SRSF2, a miR‐193a‐3p target gene, is downregulated in CD44(+) MKN45 cells
Next, we investigated the candidate targets of miR‐193a‐3p such as SRSF2, E2F1, E2F6, MCL1 and PCNA (TargetScan and miRNA.org website).18 We conducted real‐time PCR to evaluate the expression levels of these candidates and found that SRSF2 and E2F1 showed differential expression in CD44(+) and CD44(−) cells (Figure 2A). SRSF2 (also known as SC35) is a member of the serine/arginine‐rich protein (SR protein) family and plays a role in pre‐mRNA splicing. SR proteins are known to form a complex, termed the spliceosome; this complex also includes snRNPs. The spliceosome is known to carry out important functions, such as alternative splicing and post‐splicing.19 Western blotting and immunofluorescence assays confirmed decreased expression of SRSF2 in CD44(+) compared with CD44(−) cells (Figure 2B,C). Moreover, the luciferase activity of SRSF2 was lower in CD44(+) than in CD44(−) cells (Figure 2D).
Figure 2.
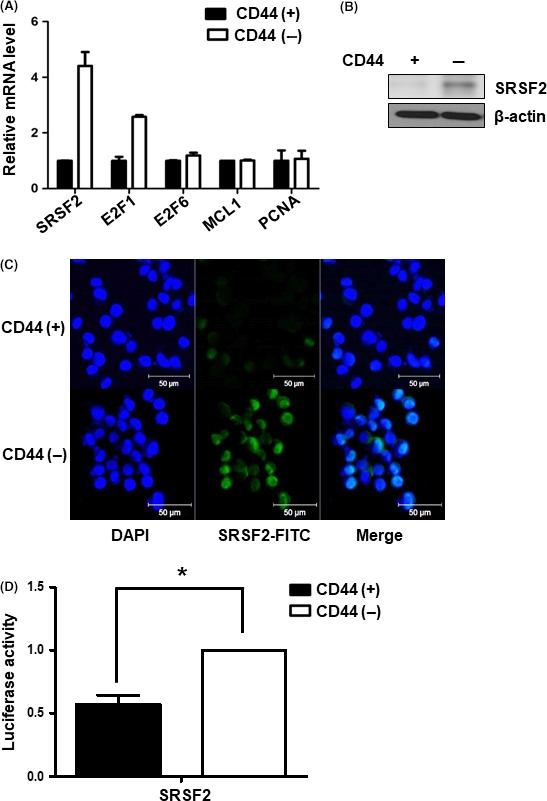
Expression of microRNA (miR)‐193a‐3p target gene, SRSF2 in CD44(+) and CD44(−) gastric cancer cells. A, Real‐time PCR analysis of the mRNA expression levels of several candidate miR‐193a‐3p target genes, including SRSF2, E2F1, E2F6,MCL1 and PCNA in CD44(+) and CD44(−) MKN45 cells. Level of miR‐193a‐3p target genes normalized by β‐actin and presented as the relative ratio. B, Western blot analysis of SRSF2 expression in CD44(+) and CD44(−) MKN45 cells. C, Immunofluorescence assays to detect the expression of SRSF2 (green) in CD44(+) and CD44(−) MKN45 cells. Nuclei (blue) were counterstained with DAPI. D, Luciferase activity assay to examine the activity of SRSF2 in CD44(+) and CD44(−) MKN45 cells. Data are expressed as a ratio of Firefly to Renilla luciferase activity. Each treatment was carried out in triplicate (*P < .05)
3.3. SRSF2 regulates apoptosis‐related genes
SRSF2 is known to regulate the alternative splicing of Bcl‐X and caspase 9 in favor of pro‐apoptotic splice variants.20 In order to confirm this function of SRSF2 in our system, we evaluated mRNA and protein expression level of Bcl‐XL (an anti‐apoptotic variant of Bcl‐X) and caspase 9a (a pro‐apoptotic variant of caspase 9). Bcl‐XL was upregulated in CD44(+) cells, whereas caspase 9a was downregulated in CD44(+) cells. We also examined the expression of mitochondrial apoptosis‐related genes on both mRNA and protein levels. Bax and cytochrome C such as pro‐apoptotic genes were downregulated, whereas an anti‐apoptotic gene, such as Bcl‐2, was upregulated in CD44(+) cells. Caspase 3 and caspase 9 are known to undergo cleavage during apoptosis, thereby generating increase in the cleaved forms of these proteins. We found that levels of cleaved caspase 3 and caspase 9 were both decreased in CD44(+) cells (Figure 3).
Figure 3.
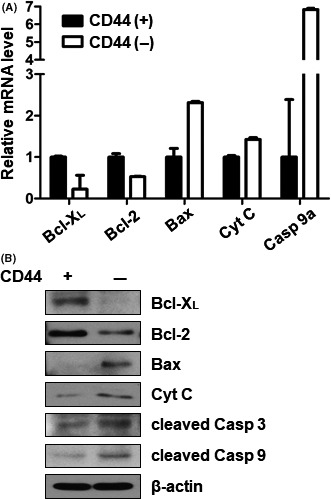
Expression of pro‐ and anti‐apoptotic genes downstream of SRSF2 in CD44(+) and CD44(−) cells. A, Real‐time PCR analysis of mRNA expression for splice variants of genes downstream of SRSF2 in CD44(+) and CD44(−) MKN45 cells. Downstream pro‐apoptotic genes: Bcl‐ XL and Bcl‐2. Downstream anti‐apoptotic genes: Bax, cytochrome C and caspase 9a. Expression of SRSF2‐related pro‐ and anti‐apoptotic genes was normalized by β‐actin and is presented as the relative ratio. B, Western blot analysis of Bcl‐XL, Bcl‐2, Bax, cytochrome C, cleaved caspase 3 and cleaved caspase 9 in CD44(+) and CD44(−) MKN45 cells. Cyt C, cytochrome C; cleaved Casp 3, cleaved caspase 3; cleaved Casp 9, cleaved caspase 9
3.4. CD44(+) cells induce cisplatin resistance compared with CD44(−) cells
We conducted MTS assays to examine the proliferative capacities of CD44(+) and CD44(−) cells upon cisplatin treatment. After 72 hours of cisplatin treatment, different viabilities were observed for CD44(+) and CD44(−) cells. CD44(+) cells were more resistant to cisplatin than CD44(−) cells (Figure 4A). To examine the rate of induction of apoptosis, CD44(+) and CD44(−) cells were treated with or without 3 μg/mL cisplatin. After 24 hours, cells were stained with annexin V and propidium iodide (PI) and analyzed by flow cytometry. CD44(−) cells were more apoptotic than CD44(+) cells. Moreover, cisplatin treatment induced significantly more apoptosis in CD44(−) cells, whereas CD44(+) cells were largely unaffected by cisplatin (Figure 4B).
Figure 4.
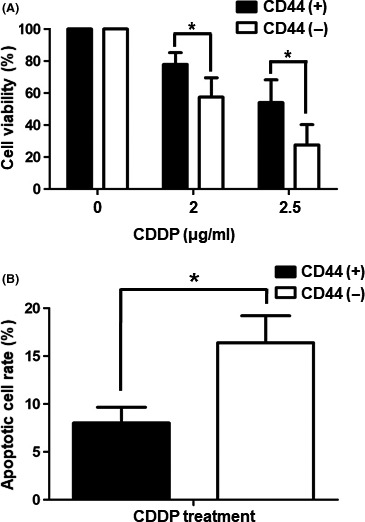
Cisplatin resistance in CD44(+) and CD44(−) cells. A, Viabilities of CD44(+) and CD44(−) MKN45 cells after treatment with cisplatin (2 or 2.5 μg/mL) as measured by MTS assay. Values shown represent averages of relative control cell viabilities; each treatment was carried out in triplicate (*P < .05). B, CD44(+) and CD44(−) MKN45 cells were treated with cisplatin (3 μg/mL) for 24 h and then stained with annexin V and propidium iodide. Values shown represent average rates of apoptosis after cisplatin treatment of CD44(+) and CD44(−) MKN45 cells. Each treatment was carried out in triplicate (*P < .05). CDDP, cisplatin
3.5. Inhibition of miR‐193a‐3p increases SRSF2 expression in CD44(+) cells
To study changes in CD44(+) cells resulting from the expression of miR‐193a‐3p, we transfected miR‐193a‐3p inhibitor into CD44(+) cells. At 48 hours post‐transfection, we carried out real‐time PCR to determine the expression level of miR‐193a‐3p in CD44(+) cells transfected with a negative control or the miR‐193a‐3p inhibitor. We found that miR‐193a‐3p expression was effectively downregulated by its inhibitor (Figure 5A). Moreover, we observed that SRSF2 of the miR‐193a‐3p target increased mRNA expression after downregulation of miR‐193a‐3p (Figure 5B). Protein level of SRSF2 was also examined by western blot analysis of cell lysates and by immunofluorescence assays. By both of these techniques, the level of SRSF2 increased upon inhibition of miR‐193a‐3p in CD44(+) cells (Figure 5C,D). Also, the luciferase activity of SRSF2 was greater in CD44(+) cells transfected with the miR‐193a‐3p inhibitor than in a negative control (Figure 5E).
Figure 5.
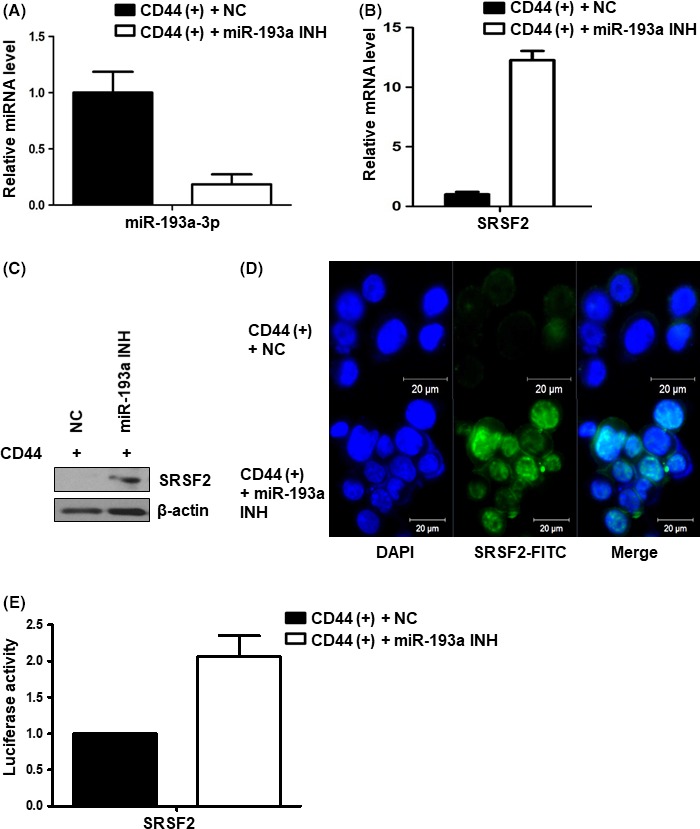
Expression of microRNA (miR)‐193a‐3p and its target gene, SRSF2 in CD44(+) and miR‐193a‐3p‐inhibited CD44(+) cells. A, Real‐time PCR analysis of the expression of miR‐193a‐3p in negative control or miR‐193a‐3p inhibitor‐transfected CD44(+) MKN45 cells. Level of miR‐193a‐ was normalized by β‐actin and is presented as the relative ratio. B, Real‐time PCR analysis of miR‐193a‐3p target gene SRSF2 in negative control or miR‐193a‐3p inhibitor‐transfected CD44(+) MKN45 cells. Expression of the SRSF2 gene normalized by β‐actin and presented as the relative ratio. C, Western blot analysis of SRSF2 in negative control or miR‐193a‐3p inhibitor‐transfected CD44(+) MKN45 cells. D, Immunofluorescence assay to examine the expression of SRSF2 (green) in negative control or miR‐193a‐3p inhibitor‐transfected CD44(+) MKN45 cells. Nuclei were counterstained with DAPI (blue). miR‐193a INH, miR‐193a‐3p inhibitor; NC, negative control. E, Luciferase activity assay to examine the activity of SRSF2 in negative control or miR‐193a‐3p inhibitor‐transfected CD44(+) MKN45 cells. Data are expressed as a ratio of Firefly luciferase activity to Renilla luciferase activity
3.6. Inhibition of miR‐193a‐3p activates the mitochondrial apoptotic signaling pathway
We next examined mRNA expression levels of SRSF2 targets such as Bcl‐X L, caspase 9a and other selected pro‐ and anti‐apoptotic genes by real‐time PCR. Bcl‐X L and caspase 9a showed changes in expression after transfection of the miR‐193a‐3p inhibitor into CD44(+) cells. Pro‐apoptotic genes such as Bax and cytochrome C were upregulated on the transcriptional level, whereas anti‐apoptotic genes such as Bcl‐2 was downregulated on the transcriptional level in CD44(+) cells transfected with the miR‐193a‐3p inhibitor (Figure 6A). We carried out western blot analysis to measure protein levels of these gene products along with cleaved caspase 3 and caspase 9. The results corroborated the real‐time PCR results. Bcl‐XL and Bcl‐2 were downregulated, whereas Bax, cytochrome C, cleaved caspase 3 and cleaved caspase 9 were all upregulated in miR‐193a‐3p‐inhibited CD44(+) cells (Figure 6B). Immunofluorescence assays confirmed the expression and localization of Bcl‐XL in negative control‐transfected CD44(+) and CD44(−) cells or miR‐193a‐3p inhibitor‐transfected CD44(+) cells (Figure 6C).
Figure 6.
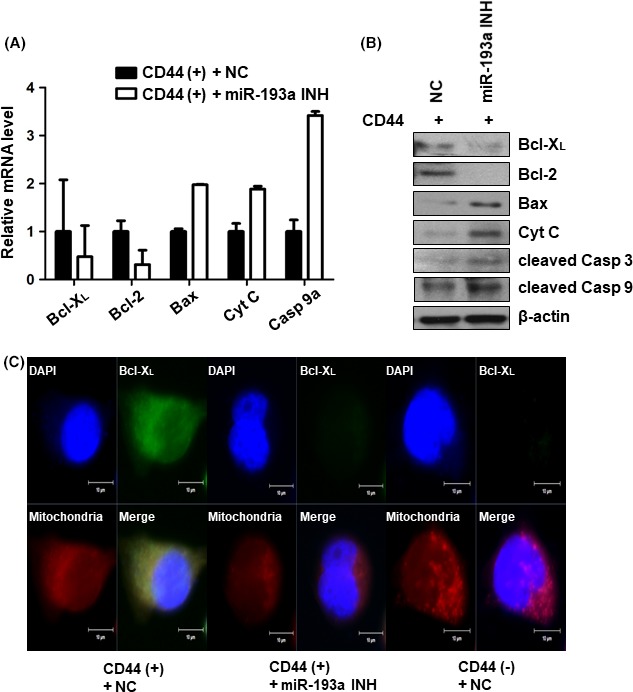
Expression of pro‐ and anti‐apoptotic genes downstream of SRSF2 in CD44(+) and microRNA (miR)‐193a‐3p‐inhibited CD44(+) cells. A, Real‐time PCR analysis of Bcl‐ XL, caspase 9a, Bax, cytochrome C and Bcl‐2 in negative control or miR‐193a‐3p inhibitor‐transfected CD44(+) MKN45 cells. Expression of the pro‐ and anti‐apoptotic genes related to SRSF2 was normalized by β‐actin and is presented as the relative ratio. B, Western blot analysis of Bcl‐XL, Bcl‐2, Bax, cytochrome C, cleaved caspase 3 and cleaved caspase 9 in negative control or miR‐193a‐3p inhibitor‐transfected CD44(+) MKN45 cells. C, Immunofluorescence assay to examine the expression of Bcl‐XL (green) in negative control or miR‐193a‐3p inhibitor‐transfected CD44(+) MKN45 cells. Mitochondria were stained with MitoSOX (red) and nuclei were counterstained with DAPI (blue). Cyt C, cytochrome C; cleaved Casp 3, cleaved caspase 3; cleaved Casp 9, cleaved caspase 9; miR‐193a INH, miR‐193a‐3p inhibitor; NC, negative control
3.7. Inhibition of miR‐193a‐3p sensitizes CD44(+) cells to cisplatin
We determined the viabilities of negative control‐transfected CD44(+) and CD44(−) cells or miR‐193a‐3p inhibitor‐transfected CD44(+) cells after cisplatin treatment. CD44(+) cells were more viable than miR‐193a‐3p‐inhibited CD44(+) cells and CD44(−) cells under cisplatin treatment. The viabilities of miR‐193a‐3p‐inhibited CD44(+) cells and CD44(−) cells were not statistically significantly different (Figure 7A). We also detected apoptotic cells by annexin V staining, followed by flow cytometry analysis. These experiments indicated that CD44(+) cells were more resistant to cisplatin than miR‐193a‐3p‐inhibited CD44(+) cells or CD44(−) cells (Figure 7B). To observe the nuclear morphologies in each cell type, we stained cells with DAPI. Both miR‐193a‐3p‐inhibited CD44(+) cells and CD44(−) cells formed more apoptotic bodies and showed more irregular nuclei after cisplatin treatment compared with CD44(+) cells (Figure 7C).
Figure 7.
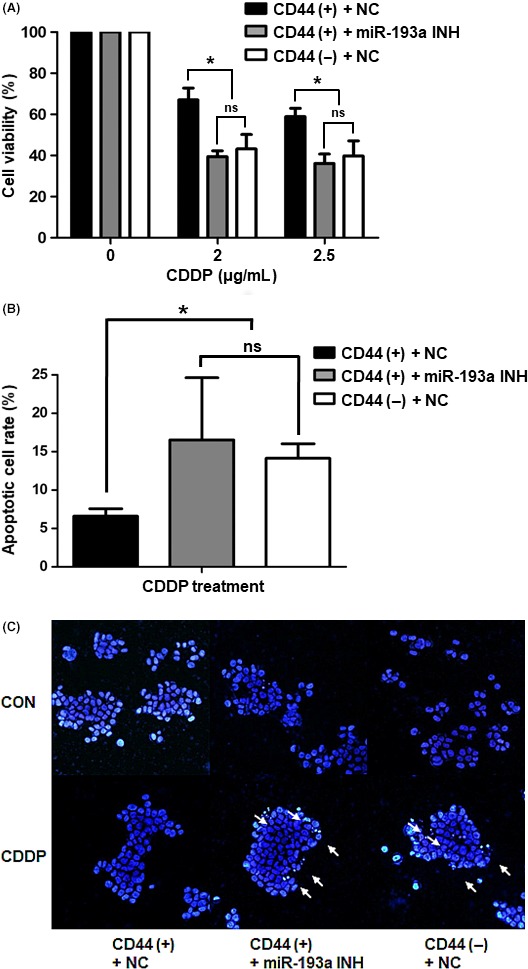
Cisplatin resistance in CD44(+), CD44(–) and microRNA (miR)‐193a‐3p‐inhibited CD44(+) cells. A, MTS assays of cell viability after cisplatin treatment (2 or 2.5 μg/mL) of negative control‐transfected CD44(+), negative control‐transfected CD44(−) and miR‐193a‐3p inhibitor‐transfected CD44(+) MKN45 cells. Values shown represent averages of relative control cell viabilities; each experiment was carried out in triplicate (*P < .05). B, Apoptosis measurements in negative control‐transfected CD44(+), negative control‐transfected CD44(−) and miR‐193a‐3p inhibitor‐transfected CD44(+) MKN45 cells after cisplatin treatment (3 μg/mL). Cells were stained with annexin V and propidium iodide and analyzed by flow cytometry. Values represent average rates of apoptosis in each cell type, from triplicate experiments (*P < .05). C, Fluorescence images of representative nuclei from negative control‐transfected CD44(+), negative control‐transfected CD44(−) and miR‐193a‐3p inhibitor‐transfected CD44(+) MKN45 cells. Nuclei were stained with DAPI to observe their morphologies. White arrows indicate apoptotic bodies. CDDP, cisplatin; CON, control; miR‐193a INH, miR‐193a‐3p inhibitor; NC, negative control; ns, not significant
4. DISCUSSION
Although gastric cancer incidence is now declining, gastric cancer mortality is still significantly high. Surgical and systemic treatment as well as screening, early detection, and treatment strategies for Helicobacter pylori infection for gastric cancer are still major health burdens worldwide.21 Cisplatin is commonly used for adjuvant chemotherapy in advanced‐stage gastric cancer patients. Cisplatin has been characterized as a DNA linkage agent, and the cytotoxicity of cisplatin has generally contributed to the ability to form intra‐strand and inter‐strand DNA linkage.22 Cisplatin may cause mitochondrial alterations leading to activation of apoptosis or cell death and also oxidative/reticular stress. In many different aspects, cisplatin resistance has been proposed (pre‐, on‐, post‐, and off‐target). In the pre‐target aspect, several transporters were identified as associated with cisplatin resistance, such as copper transporter 1 (CTR1), copper‐transporting ATPase (ATP7B), multidrug resistance‐associated protein 2 (MRP2), and volume‐regulated anion channels (VRAC). On‐target resistance includes excision repair cross‐complementing rodent repair deficiency and complementation group 1 (ERCC1). Also, bcl‐2 family members and the akt pathway are implicated in the post‐ and off‐target mechanisms in cisplatin resistance.5
CD44 is well known as a proven gastric cancer stem cell marker and known to play a critical role in regulating self‐renewal, tumor initiation, metastasis and chemoresistance. Also, CD44 positivity is associated with poor prognosis in various human cancers, including breast, brain, colon, pancreatic, and gastric cancers.16 Previously, we carried out miRNA microarray analysis and found multiple miRNAs that were differentially expressed in CD44(+) and CD44(−) MKN45 cells.17 miRNA regulation has previously been examined to be a characteristic of cancer stem cells. Among these differentially expressed miRNAs, we focused on miR‐193a‐3p which was significantly upregulated in CD44(+) cells compared with CD44(−) cells. Although the role of miR‐193a‐3p has remained largely uncharacterized, several studies have recently focused on this miRNA in various cancers. In renal cancer tissue, miR‐193a‐3p was shown to have increased expression compared with normal tissue.23 Interestingly, miR‐193a‐3p regulates the expression of c‐kit through a mechanism involving promoter methylation in acute myeloid leukemia.24 However, the mechanism of miR‐193a‐3p‐dependent cisplatin resistance response underlying gastric cancer stemness has not been fully elucidated.
In the present study, we first investigated known targets of miR‐193a‐3p and the signaling pathways regulated by these targets. Using real‐time PCR analysis, we found that the expression level of miR‐193a‐3p was inversely correlated with levels of SRSF2 and E2F1. We chose SRSF2 as a target of miR‐193a‐3p because its expression level showed a large difference between CD44(+) and CD44(−) cells. It has already been reported that a certain transcription factor, E2F1, targets and causes increased expression of SRSF2.25 SRSF2 is known to play a role in determining active splice sites during the pre‐mRNA alternative splicing process. Moreover, SRSF2 has been implicated in apoptosis, as promoted by cisplatin in lung cancer.26 Most human genes undergo alternative splicing in order to make a large number of proteins capable of carrying out a variety of roles. In apoptosis, mRNA pre‐splicing is a crucial factor controlling downstream pathways. Many proteins involved in apoptosis pathways are expressed as multiple isoforms, each of which plays a distinctive role.27 Bcl‐X, one of the most studied genes to undergo alternative splicing is known to occur in two isoforms: Bcl‐XL and Bcl‐XS. Bcl‐XL shows anti‐apoptotic effects, whereas Bcl‐XS provokes apoptosis. Caspase 9 was spliced into caspase 9a, an isoform known to exert pro‐apoptotic effects.28
Next, we evaluated the expression levels of selected genes downstream of SRSF2 in addition to levels of mitochondrial apoptotic molecules. Bcl‐XL, an anti‐apoptotic variant of Bcl‐X was increased, whereas caspase 9a, a pro‐apoptotic variant of caspase 9 was decreased by the downregulated SRSF2 in CD44(+) cells. The pro‐apoptotic genes Bax, cytochrome C, cleaved caspase 3 and cleaved caspase 9 were downregulated, whereas the anti‐apoptotic gene Bcl‐2 was upregulated in CD44(+) cells compared with CD44(−) cells. After cisplatin treatment, CD44(+) cells with inactivated apoptotic genes showed higher survival rates than CD44(–) cells. We suppressed miR‐193a‐3p expression in CD44(+) cells using a miR‐193a‐3p inhibitor and investigated the resulting effects on the regulation of mitochondrial apoptotic pathways. Contrastively, the level of SRSF2 increased and its target genes were suppressed in miR‐193a‐3p‐inhibited CD44(+) cells. Inhibition of miR‐193a‐3p also resulted in increased sensitivity to cisplatin treatment and showed a similar rate of apoptosis to that in CD44(−) cells. Despite the fact that miR‐193a‐3p expression correlated with cisplatin resistance in CD44(+) cells, it is still considered largely experimental data. Therefore, further studies adopting the regulation of miR‐193a‐3p expression in the animal model of gastric cancer may warrant the possibility of clinical application in the future.
These results suggest that the upregulation of miR‐193a‐3p can inhibit cisplatin‐induced mitochondrial apoptosis in CD44(+) gastric cancer cells. Thus, regulating miR‐193a‐3p might be an attractive treatment strategy to target cisplatin‐resistant cells in gastric cancer.
CONFLICTS OF INTEREST
Authors declare no conflicts of interest for this article.
ACKNOWLEDGMENTS
The present study was supported by the Basic Science Research Program through the National Research Foundation (NRF) of Korea funded by the Ministry of Education, Science, and Technology (grant nos. NRF‐2013R1A1A2009707, NRF‐2017R1A2B2012887).
Lee SD, Yu D, Lee DY, Shin H‐S, Jo J‐H, Lee YC. Upregulated microRNA‐193a‐3p is responsible for cisplatin resistance in CD44(+) gastric cancer cells. Cancer Sci. 2019;110:662–673. 10.1111/cas.13894
Lee and Yu contributed equally to this work.
REFERENCES
- 1. Szakacs G, Paterson JK, Ludwig JA, Booth‐Genthe C, Gottesman MM. Targeting multidrug resistance in cancer. Nat Rev Drug Discov. 2006;5:219‐234. [DOI] [PubMed] [Google Scholar]
- 2. Rabik CA, Dolan ME. Molecular mechanisms of resistance and toxicity associated with platinating agents. Cancer Treat Rev. 2007;33:9‐23. [DOI] [PMC free article] [PubMed] [Google Scholar]
- 3. Cocconi G, Carlini P, Gamboni A, et al. Cisplatin, epirubicin, leucovorin and 5‐fluorouracil (PELF) is more active than 5‐fluorouracil, doxorubicin and methotrexate (FAMTX) in advanced gastric carcinoma. Ann Oncol. 2003;14:1258‐1263. [DOI] [PubMed] [Google Scholar]
- 4. Webb A, Cunningham D, Scarffe JH, et al. Randomized trial comparing epirubicin, cisplatin, and fluorouracil versus fluorouracil, doxorubicin, and methotrexate in advanced esophagogastric cancer. J Clin Oncol. 1997;15:261‐267. [DOI] [PubMed] [Google Scholar]
- 5. Wang SF, Wung CH, Chen MS, et al. Activated integrated stress response induced by salubrinal promotes cisplatin resistance in human gastric cancer cells via enhanced xCT expression and glutathione biosynthesis. Int J Mol Sci. 2018;19:3389. [DOI] [PMC free article] [PubMed] [Google Scholar]
- 6. Brunelle JK, Letai A. Control of mitochondrial apoptosis by the Bcl‐2 family. J Cell Sci. 2009;122:437‐441. [DOI] [PMC free article] [PubMed] [Google Scholar]
- 7. Simon HU, Haj‐Yehia A, Levi‐Schaffer F. Role of reactive oxygen species (ROS) in apoptosis induction. Apoptosis. 2000;5:415‐418. [DOI] [PubMed] [Google Scholar]
- 8. Fulda S, Debatin KM. Extrinsic versus intrinsic apoptosis pathways in anticancer chemotherapy. Oncogene. 2006;25:4798‐4811. [DOI] [PubMed] [Google Scholar]
- 9. Kerr JF, Winterford CM, Harmon BV. Apoptosis. Its significance in cancer and cancer therapy. Cancer. 1994;73:2013‐2026. [DOI] [PubMed] [Google Scholar]
- 10. Carthew RW, Sontheimer EJ. Origins and mechanisms of miRNAs and siRNAs. Cell. 2009;136:642‐655. [DOI] [PMC free article] [PubMed] [Google Scholar]
- 11. Lima RT, Busacca S, Almeida GM, Gaudino G, Fennell DA, Vasconcelos MH. MicroRNA regulation of core apoptosis pathways in cancer. Eur J Cancer. 2011;47:163‐174. [DOI] [PubMed] [Google Scholar]
- 12. Allen KE, Weiss GJ. Resistance may not be futile: microRNA biomarkers for chemoresistance and potential therapeutics. Mol Cancer Ther. 2010;9:3126‐3136. [DOI] [PubMed] [Google Scholar]
- 13. Miller TE, Ghoshal K, Ramaswamy B, et al. MicroRNA‐221/222 confers tamoxifen resistance in breast cancer by targeting p27Kip1. J Biol Chem. 2008;283:29897‐29903. [DOI] [PMC free article] [PubMed] [Google Scholar]
- 14. Rao X, Di Leva G, Li M, et al. MicroRNA‐221/222 confers breast cancer fulvestrant resistance by regulating multiple signaling pathways. Oncogene. 2011;30:1082‐1097. [DOI] [PMC free article] [PubMed] [Google Scholar]
- 15. Xia L, Zhang D, Du R, et al. miR‐15b and miR‐16 modulate multidrug resistance by targeting BCL2 in human gastric cancer cells. Int J Cancer. 2008;123:372‐379. [DOI] [PubMed] [Google Scholar]
- 16. Thapa R, Wilson GD. The importance of CD44 as a stem cell biomarker and therapeutic target in cancer. Stem Cells Int. 2016;2016:2087204. [DOI] [PMC free article] [PubMed] [Google Scholar]
- 17. Yu D, Shin HS, Lee YS, Lee YC. miR‐106b modulates cancer stem cell characteristics through TGF‐beta/Smad signaling in CD44‐positive gastric cancer cells. Lab Invest. 2014;94:1370‐1381. [DOI] [PubMed] [Google Scholar]
- 18. Ma K, He Y, Zhang H, et al. DNA methylation‐regulated miR‐193a‐3p dictates resistance of hepatocellular carcinoma to 5‐fluorouracil via repression of SRSF2 expression. J Biol Chem. 2012;287:5639‐5649. [DOI] [PMC free article] [PubMed] [Google Scholar]
- 19. Sanford JR, Ellis J, Caceres JF. Multiple roles of arginine/serine‐rich splicing factors in RNA processing. Biochem Soc Trans. 2005;33:443‐446. [DOI] [PubMed] [Google Scholar]
- 20. Merdzhanova G, Edmond V, De Seranno S, et al. E2F1 controls alternative splicing pattern of genes involved in apoptosis through upregulation of the splicing factor SC35. Cell Death Differ. 2008;15:1815‐1823. [DOI] [PubMed] [Google Scholar]
- 21. Ajani JA, Lee J, Sano T, Janjigian YY, Fan D, Song S. Gastric adenocarcinoma. Nat Rev Dis Primers. 2017;3:17036. [DOI] [PubMed] [Google Scholar]
- 22. Andrews PA, Howell SB. Cellular pharmacology of cisplatin: perspectives on mechanisms of acquired resistance. Cancer Cells. 1990;2:35‐43. [PubMed] [Google Scholar]
- 23. Yi Z, Fu Y, Zhao S, Zhang X, Ma C. Differential expression of miRNA patterns in renal cell carcinoma and nontumorous tissues. J Cancer Res Clin Oncol. 2010;136:855‐862. [DOI] [PubMed] [Google Scholar]
- 24. Gao XN, Lin J, Li YH, et al. MicroRNA‐193a represses c‐kit expression and functions as a methylation‐silenced tumor suppressor in acute myeloid leukemia. Oncogene. 2011;30:3416‐3428. [DOI] [PubMed] [Google Scholar]
- 25. Merdzhanova G, Gout S, Keramidas M, et al. The transcription factor E2F1 and the SR protein SC35 control the ratio of pro‐angiogenic versus antiangiogenic isoforms of vascular endothelial growth factor‐A to inhibit neovascularization in vivo. Oncogene. 2010;29:5392‐5403. [DOI] [PubMed] [Google Scholar]
- 26. Edmond V, Moysan E, Khochbin S, et al. Acetylation and phosphorylation of SRSF2 control cell fate decision in response to cisplatin. EMBO J. 2011;30:510‐523. [DOI] [PMC free article] [PubMed] [Google Scholar]
- 27. Schwerk C, Schulze‐Osthoff K. Regulation of apoptosis by alternative pre‐mRNA splicing. Mol Cell. 2005;19:1‐13. [DOI] [PubMed] [Google Scholar]
- 28. Boise LH, Gonzalez‐Garcia M, Postema CE, et al. bcl‐x, a bcl‐2‐related gene that functions as a dominant regulator of apoptotic cell death. Cell. 1993;74:597‐608. [DOI] [PubMed] [Google Scholar]


