

Abstract
Esophageal squamous cell carcinoma (ESCC) is a lethal malignancy. However, there are few useful markers for diagnosis and treatment. Glutathione S‐transferase Pi 1 (GSTP1) has been reported as a predictor of malignancy or anticancer drug resistance in some cancers. We investigated the association of GSTP1 expression with the malignancy or drug resistance in ESCC cell lines and clinical tissue samples. Proliferation and apoptosis assays regarding GSTP1 expression were examined in ESCC cell lines. Proliferation of GSTP1 knockdown cells was significantly decreased (P < .01), and the frequency of early apoptosis was increased (P < .05). Invasion capacity of GSTP1 knockdown cells was slightly decreased in transwell assay. These results suggest that GSTP1 plays an important role in malignant potential. To examine the effects of GSTP1 on drug resistance, chemosensitivity assay and apoptosis assay under cisplatin exposure were carried out. Viability of GSTP1 knockdown cells treated with cisplatin was lower than that of control cells (P < .01). Moreover, the frequency of early and late apoptosis in GSTP1 knockdown cells was markedly increased over that of control cells by cisplatin exposure (P < .01). In immunohistochemistry assay of resected tissue samples, GSTP1 expression was significantly associated with clinical downstaging (P = .04) in 72 ESCC patients with neoadjuvant chemotherapy. Furthermore, there was a significant association between GSTP1 expression in resected tissue and biopsy samples in 34 ESCC patients without neoadjuvant chemotherapy (P = .02). In summary, GSTP1 was related to malignant potential and may be a predictive marker of drug resistance in ESCC patients.
Keywords: biomarker, biopsy sample, drug resistance, esophageal squamous cell carcinoma, GSTP1
Abbreviations
- CDDP
cis‐diamminedichloride platinum
- ESCC
esophageal squamous cell carcinoma
- 5‐FU
5‐fluorouracil
- GSTP1
glutathione S‐transferase Pi 1
- PARP
cleaved‐poly (ADP‐ribosyl) polymerase
- WST‐8
water‐soluble tetrazolium salt
1. INTRODUCTION
Esophageal cancer (EC) is one of the most common and aggressive malignancies. Worldwide, there are about 400 000 newly diagnosed patients and about 300 000 related deaths each year.1 EC has two main subtypes, ESCC and esophageal adenocarcinoma. ESCC accounts for approximately 90% of EC patients in East Asia.2 Despite recent advances in diagnosis and treatment, the prognosis and mortality rate of patients with EC are generally poor.1, 2 With regard to treatment for locally advanced ESCC, surgical resection in combination with chemo‐ and/or radiation therapy is believed to obtain a better prognosis. However, some patients treated with neoadjuvant chemotherapy do not show a significant response to those treatments.3 Moreover, there is no useful marker for responses to the chemotherapy.
Glutathione S‐transferase Pi 1 is a member of the GST family, a superfamily of dimeric phase‐II metabolic enzymes for the cellular defense system, and plays an important role in detoxification.4, 5 Such detoxification contributes to cytoprotection against anticancer drugs.6 Many reports have found that GSTP1 is involved in resistance to CDDP in vitro7, 8, 9, 10, 11 or in clinical studies of EC12 and gastric cancer patients.13 Regarding 5‐FU, some reports have also shown the relationship between GSTP1 expression and drug resistance.10, 12, 13 GSTP1 affects cellular signaling by binding to important signaling proteins, which may cause malignant potential, poor prognosis and drug resistance in patients with EC, lung cancer,7, 14 breast cancer,15, 16 colon cancer,17 and prostate cancer.18
In a previous study, we showed that high GSTP1 expression of the resected specimen was one of the independent predictors of a poor prognosis in ESCC patients who had undergone radical esophagectomy. Five‐year overall survival rate of patients with high GSTP1 expression was significantly lower than those with low GSTP1 expression in subgroup analysis among patients who underwent postoperative adjuvant chemotherapy.19 In the present study, we investigated the significance of GSTP1 expression in malignant potential and sensitivity to chemotherapy using ESCC cell lines, and immunohistochemistry of ESCC patients who underwent neoadjuvant chemotherapy was examined in resected tissues. In addition, immunohistochemistry of paired biopsy and resected tissue samples obtained from ESCC patients without neoadjuvant chemotherapy was also examined.
2. MATERIALS AND METHODS
2.1. Cells and cell culture
Human ESCC cell line TE13 was obtained from Riken Cell Bank (Tsukuba, Japan). The human ESCC cell line KYSE170 was obtained from the Japanese Collection of Research Bioresources Cell Bank (Osaka, Japan). Cells were passaged and stored at −80°C in our laboratory for fewer than 6 months after receipt. All experiments were carried out within eight passages of resuscitation. The cells were maintained in a culture medium consisting of RPMI‐1640 (Life Technologies, Grand Island, NY, USA) supplemented with 10% heat‐inactivated FBS, 1 mM sodium pyruvate and 4 mM l‐glutamine at 37°C in 5% CO2.
2.2. RNA extraction and real‐time polymerase chain reaction
Cellular RNA was extracted using RNeasy Kit (Qiagen, Heidelberg, Germany) according to the manufacturer's instructions and stored at −80°C. RNA (500 ng) was reverse transcribed using a High‐Capacity cDNA‐RNA Kit (ThermoFisher, Waltham, MA, USA), and 1 μL cDNA was used for real‐time PCR on a StepOne Realtime System (Applied Biosystems, Foster City, CA, USA). Taqman Gene Expression Assays (Hs_00943350_g1 for GSTP1, Hs_01060665_g1 for beta‐actin) were used as the template in a 20 μL mixture according to the manufacturer's instructions under the following conditions: denaturation at 90°C for 10 minutes; 35 cycles at 90°C for 1 minute, at 60°C for 30 seconds, and at 72°C for 60 seconds; and then a final extension at 72°C for 10 minutes. Beta‐actin expression was also analyzed as a control for cDNA integrity.
2.3. Western blotting
Cells were lysed by M‐PER Mammalian Protein Extraction Reagent (ThermoFisher) and centrifuged at 20 600 g for 10 minutes. The supernatant was collected, and protein concentrations were determined using a Protein Assay Rapid Kit Wako II (Wako, Tokyo, Japan). Cell lysate (20 ng) was separated on a 12% SDS‐PAGE gel, transferred onto PVDF membranes (GE Healthcare, Piscataway, NJ, USA) and immunoblotted with the indicated antibodies. Antibody against GSTP1 was purchased from Sigma‐Aldrich (St Louis, MO, USA). An ECL Plus Western Blotting Detection System was used to detect proteins (GE Healthcare).
2.4. Small interfering RNA transfection
Two different types of siRNA (Stealth RNAi #HSS104545 and #HSS104546; Invitrogen, Carlsbad, CA, USA) specific for the GSTP1 sequence (GenBank Accession No. NM_000852) were prepared for inhibition of GSTP1 expression. Cells were transfected with 20 nmol/L siRNA of GSTP1 and a negative control (Stealth siRNA #12935112) using Lipofectamine RNAiMAX Reagent (Invitrogen) according to the manufacturer's instructions. Downregulation of target gene expression was confirmed by real‐time PCR analysis and western blotting.
2.5. Cell proliferation and transwell assay
Cell proliferation was evaluated by WST assay (WST‐8 Cell Counting Reagents; Nacalai Tesque, Kyoto, Japan). Transwell invasion or migration assay was conducted in 24‐well‐modified Boyden chambers (Becton Dickinson and Co., Franklin Lakes, NJ, USA). The upper chamber with 8‐μm pore size was precoated with (invasion assay) or without (migration assay) Matrigel (Becton Dickinson and Co.). Cells (1.0 × 10⁵ per well) were seeded in the upper chamber with serum‐free medium at 24 hours after siRNA transfection. The lower chamber contained medium with 10% FBS. After 48 hours of incubation at 37°C, non‐migrated or non‐invaded cells were then removed from the upper side of the membrane by scrubbing using cotton swabs. Invaded and migrated cells were fixed on the membrane and stained with Diff‐Quick staining reagents (Sysmex, Kobe, Japan). The invaded and migrated cells on the lower side of the membrane were counted. Each assay was carried out in triplicate.
2.6. Cell cycle assay using FACS analysis
KYSE170 and TE13 cells (3 × 10⁴ cells/well) were seeded into six‐well plates with 2 mL medium for 24 hours and transfected with 20 nmol/L GSTP1 siRNA (#HSS104546) and a negative control (Stealth siRNA #12935112). The medium was changed at 24 hours after transfection, and cells were harvested at 72 hours after transfection. Briefly, the cells were treated with Triton X‐100 (Nacalai Tesque) and RNase, and nuclei were stained with propidium iodide (PI) solution. The samples were analyzed using a Becton‐Dickinson Accuri C6 FACS (BD Bioscience, Piscataway, NJ, USA). At least 10 000 events were recorded, and the proportion of cells in various phases of the cell cycle was analyzed.
2.7. Chemosensitivity assay
KYSE170 and TE13 cells (1 × 10⁴ cells/well) were seeded into 24‐well plates with 500 μL medium and incubated for 24 hours. Next, the cells were transfected similarly to the cell cycle assays shown above. After 24 hours, the medium was discarded, and cells were incubated in the presence of graded concentrations of CDDP (0, 1, 2, 4 and 6 nmol/L) for 48 hours. Consequently, cell sensitivity to CDDP was investigated by a WST‐8 assay as described above. Data were analyzed from the average A450 absorbance of four wells in one experiment. Percentage of surviving cells was estimated by dividing the results of the CDDP‐treated cells by those in the control cells.
WST‐8 and apoptosis assay were used to evaluate sensitivity to CDDP. IC50 of CDDP in KYSE170 and TE13 cells is shown in Figure S1.
2.8. Apoptosis assay using FACS analysis
KYSE170 and TE13 cells (3 × 10⁴ cells/well) were also incubated for 24 hours and transfected similarly to the chemosensitivity assays. After 24 hours, the medium was discarded, and the cells were seeded in medium with 4 μmol/L CDDP or without CDDP for 48 hours. The cells were collected and stained with FITC‐conjugated annexin V and phosphatidylinositol using an Annexin V Kit (Beckman Coulter, Brea, CA, USA) according to the manufacturer's protocol. At least 10 000 events were recorded, and the proportion of apoptotic cells was analyzed by FACS Accuri C6 (BD Biosciences).
2.9. Patients and tumor samples
Primary ESCC tumor samples were obtained from 72 patients who had undergone neoadjuvant chemotherapy (5‐FU and CDDP) and esophagectomy at Kyoto Prefectural University of Medicine (Kyoto, Japan) between 2008 and 2012. Thirty‐four paired preoperative biopsy and primary cancerous tissue samples were also obtained from patients without neoadjuvant chemotherapy between 2004 and 2017. All patients were histologically diagnosed with a primary ESCC. Neoadjuvant chemotherapy was repeated two times every 3 weeks. CDDP at a dose of 80 mg/m2 was given on day 1, and 5‐FU at a dose of 800 mg/m2 was given from days 1 to 5. Each sample was embedded in paraffin after 24 hours fixation by 10% formalin.
All patients had provided written informed consent for specimen collections and biomarker analyses, and the research was carried out in accordance with the Helsinki declaration. Ethical approval was granted by the Faculty of Science Ethics Committee at Kyoto Prefectural University of Medicine. Relevant clinicopathological and survival data were obtained from the hospital database. Disease clinical staging was defined on the basis of the UICC/TNM Classification of Malignant Tumors (7th edition).20
Regarding sensitivity to neoadjuvant chemotherapy, comparisons of clinical and pathological factors were investigated. Clinicopathological assessments were decided on the basis of the UICC/TNM Classification of Malignant Tumors 7th edition.20 RECIST version 1.121 was also used to assess the efficacy of neoadjuvant chemotherapy.
2.10. Immunohistochemistry assay
Formalin‐fixed paraffin‐embedded sections of resected tissue and biopsy samples in ESCC patients were subjected to immunostaining with a rabbit monoclonal antibody against GSTP1. Tissue sections (5 μm thick) were subjected to antigen retrieval by boiling citrate buffer after deparaffinization and rehydration. The sections were treated with 0.3% hydrogen peroxide in methanol for 20 minutes at room temperature. After treatment with Block Ace (Vectastain Elite ABC Universal Kit; Vector Laboratories, Inc., Burlingame, CA, USA) for 30 minutes at room temperature, the sections were incubated overnight at 4°C with GSTP1 antibody (1:500 dilution; Sigma‐Aldrich, St. Louis, MO, USA). The sections were incubated with a second antibody using the avidin‐biotin‐peroxidase complex system (Vectastain Elite ABC Universal Kit) according to the manufacturer's instructions. Color development was carried out with diaminobenzidine tetrahydrochloride and hematoxylin.19 GSTP1 expression was divided into two groups: tissues of grade 1 were stained less than 90%, and tissues of grade 2 were stained over 90% of the cancer area as described in the previous study.19
2.11. Statistical analysis
For mRNA analysis, expression levels of GSTP1 in cell lines were compared with the ⊿⊿Ct method. Mann‐Whitney U test and the t test for unpaired data were used for transwell invasion and migration assays, cell cycle analysis and apoptotic cell analysis. Chi‐squared test was used to estimate relationships between expression of GSTP1 levels and clinicopathological factors. All data were analyzed in JMP software v11. Reproducibility of the grading classification of the immunochemistry assay was tested by obtaining κ‐scores.19 For the survival rate analysis, differences among the groups were analyzed with the log‐rank test or the Wilcoxon test. P‐value <.05 was considered statistically significant. Data are reported as mean ± SD.
3. RESULTS
3.1. Effects of GSTP1 expression in ESCC cell lines
Glutathione S‐transferase Pi 1 expression in ESCC cell lines was upregulated compared with the normal fibroblast cell line, especially in KYSE170 and TE13, as described in the previous study.19 RNA expression of GSTP1 was reduced by siRNA specific to GSTP1 (si#1: HSS104545, si#2: HSS104546) compared with a negative control (Stealth siRNA: #12935112) in KYSE170 and TE13 cells (Figure 1A). Protein expression of GSTP1 was obviously reduced by si#2, but not as much by si#1 (Figure 1B). Given these results, si#2 was appropriate for the knockdown of GSTP1 expression.
Figure 1.
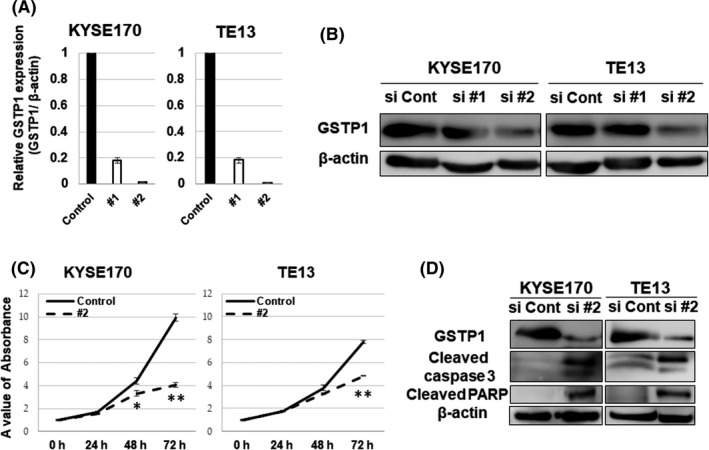
Knockdown of glutathione S‐transferase Pi 1 (GSTP1) expression and the proliferation assay. A, Downregulation of GSTP1 expression by transfection of siGSTP1 was confirmed in KYSE170 and TE13 cell lines using PCR. B, GSTP1 protein expression was detected by western blotting. KYSE170 and TE13 cell lines were transfected with siGSTP1 and siControl. C, Proliferation was decreased by transfection with siGSTP1 #2 in KYSE170 and TE13 cell lines. Error bars indicate SD. *P < .05; **P < .01; n = 3. D, Results of western blotting analysis for GSTP1, cleaved caspase 3, cleaved cleaved‐poly (ADP‐ribosyl) polymerase (PARP) and β‐actin protein expression are shown. Proteins of KYSE170 and TE13 cell lines were collected at 72 h after transfection with siGSTP1 #2 and the control
A WST‐8 assay was carried out to evaluate the effects of GSTP1 expression on proliferation in KYSE170 and TE13 cells. Proliferation was suppressed by the reduction of GSTP1 expression (Figure 1C). Moreover, cleaved caspase‐3 and PARP protein expression, which are activated during apoptotic induction, were elevated in western blot analysis (Figure 1D).
Transwell assays were then used to investigate the effects of GSTP1 on cell invasion and migration. As shown in Figure 2, invasion capacities of KYSE170 and TE13 cells were decreased by the reduction of GSTP1 expression. However, there was no significant difference in migration capacities regarding GSTP1 expression.
Figure 2.
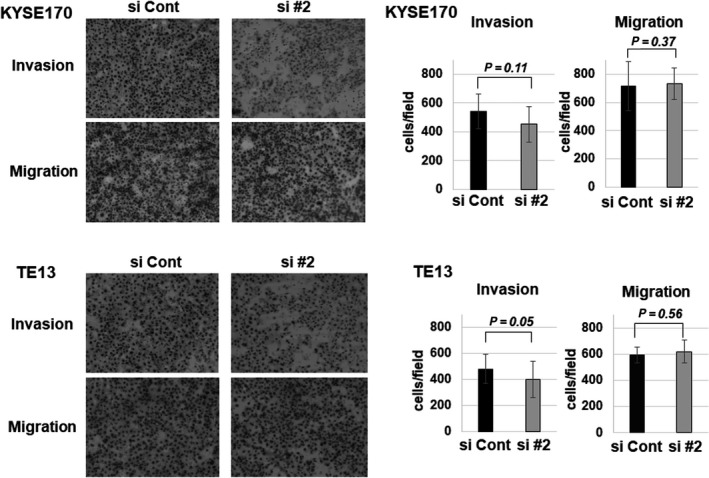
Transwell assay for the reduction of glutathione S‐transferase Pi 1 (GSTP1) expression. Transwell assay shows the invasion and migration function for KYSE170 and TE13 cells. GSTP1 expression was reduced by siGSTP1 #2. Differences are shown by the images and cell counts in the bar charts. Data are presented as mean ± SEM
3.2. Significance of GSTP1 expression on the cell cycle and apoptosis
Significance of GSTP1 expression on the cell cycle profile and apoptosis induction were examined using FACS. In the cell cycle analysis, subG0/G1 phase was relatively increased by the reduction of GSTP1 expression in KYSE170 and TE13 cells (Figure 3A). Similarly, early apoptosis was increased in both cell lines, especially in TE13 (Figure 3B).
Figure 3.
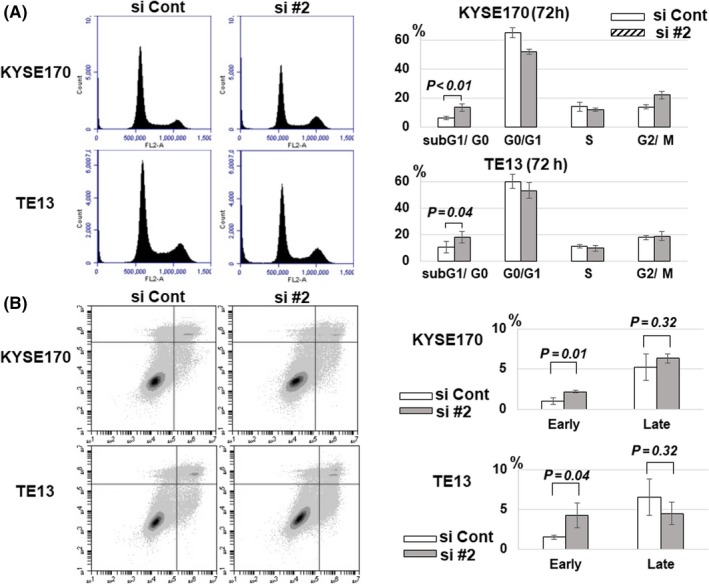
Cell cycle and apoptosis assay regarding glutathione S‐transferase Pi 1 (GSTP1) expression. A, Cell cycle in KYSE170 and TE13 cell lines at 72 h after transfection with siGSTP1 and siControl was analyzed by FACS analysis. Cell distribution and the proportion in each cycle is shown, respectively. Data are presented as mean ± SEM. n = 7. B, Apoptosis assay in KYSE170 and TE13 cell lines 72 h after knockdown of GSTP1 expression by siGSTP1 and siControl. Apoptosis was separately analyzed in early and late phases by FACS analysis using FITC annexin V. Error bars indicate SD. n = 3
3.3. Drug resistance against CDDP by GSTP1 expression
As shown in Figure 4A, sensitivity to a high dose of CDDP was increased by the reduction of GSTP1 expression in both cell lines. Furthermore, early and late apoptosis by CDDP (4 μmol/L) treatment was markedly promoted by the reduction of GSTP1 expression (Figure 4B). These results indicate that GSTP1 expression associates with drug resistance against CDDP.
Figure 4.
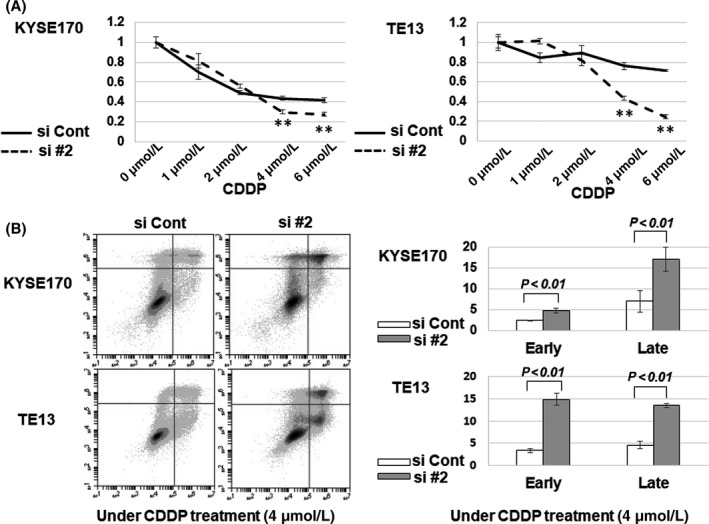
Evaluation of resistance to cis‐diamminedichloride platinum (CDDP) in KYSE170 and TE13 cells with knockdown of glutathione S‐transferase Pi 1 (GSTP1). A, Viabilities of KYSE170 and TE13 cells transfected with siGSTP1 or siControl were evaluated by water‐soluble tetrazolium salt (WST‐8) assay in serial concentrations of CDDP: 0, 1, 2, 4 and 6 μmol/L. **P < .01; n = 4. B, Apoptosis assay in KYSE170 and TE13 cell lines at 72 h after knockdown of GSTP1 expression by siGSTP1 and siControl. Apoptosis was separately analyzed in early and late phases by FACS analysis using FITC annexin V. Error bars indicate SD (n = 4)
3.4. Immunohistochemistry of GSTP1 in ESCC tissue and biopsy samples
Immunohistochemistry was carried out for GSTP1 protein expression in the resected tissue samples of ESCC patients treated with neoadjuvant chemotherapy. GSTP1 expression was mainly detected in the nuclei and cytoplasm of cancer cells, and also in the superficial layer of the normal esophageal epithelium (Figure S2a–d). The patients were divided into two groups, grade 1 and grade 2, on the basis of the judgement criteria of the previous study described in Materials and Methods.19 Twenty‐three patients (31.9%) of all 72 patients were divided into grade 1, and 49 patients (68.1%) were divided into grade 2 (Table 1).
Table 1.
Correlations between GSTP1 grade and clinicopathological factors
| n | Grade 1 (n = 23) | Grade 2 (n = 49) | Univariate analysis | n | Grade 1 (n = 23) | Grade 2 (n = 49) | Univariate analysis | ||
|---|---|---|---|---|---|---|---|---|---|
| P‐value | P‐value | ||||||||
| Gender | Lymph node metastasis | ||||||||
| Male | 57 | 21 | 36 | .08 | Absent | 17 | 6 | 11 | .74 |
| Female | 15 | 2 | 13 | Present | 55 | 17 | 38 | ||
| Age (y) | pStage (TNM 7th edn) | ||||||||
| <65 | 37 | 13 | 24 | .55 | Stage I, II | 28 | 19 | .98 | |
| ≧65 | 35 | 10 | 25 | Stage III, IV | 44 | 14 | 30 | ||
| Curative resection | Clinical response | ||||||||
| Curative resection | 64 | 21 | 43 | .66 | PR + CR | 38 | 15 | 23 | .15 |
| Non‐curative resection | 8 | 2 | 6 | SD + PD | 34 | 8 | 26 | ||
| Predominant differentiation | Comparison between cT and pT | ||||||||
| Well or moderate | 47 | 12 | 35 | .11 | Effective (pT <cT) | 29 | 12 | 17 | .16 |
| Poor | 25 | 11 | 14 | Ineffective (pT ≧cT) | 43 | 11 | 32 | ||
| Tumor size (mm) | Comparison between cN and pN | ||||||||
| <40 | 35 | 10 | 25 | .55 | Effective (pN <cN) | 8 | 3 | 5 | .72 |
| ≧40 | 37 | 13 | 24 | Ineffective (pN ≧cN) | 64 | 20 | 44 | ||
| Depth of tumor invasion | Comparison between cStage and pStage | ||||||||
| pT0‐pT2 | 21 | 9 | 12 | .20 | Effective (pStage <cStage) | 20 | 10 | 10 | .04 |
| pT3‐pT4 | 51 | 14 | 37 | Ineffective (pStage ≧cStage) | 52 | 13 | 39 | ||
GSTP1, glutathione S‐transferase P1.
Relationships between GSTP1 grade and clinicopathological factors are shown in Table 1. Downstaging from clinical stage (cStage) before neoadjuvant chemotherapy to pathological stage (pStage) was significantly associated with GSTP1 grade (P = .04). Clinical response (P = .15) and downstaging of T factor classification (P = .16) were also marginally related to GSTP1 grade.
Immunohistochemistry for GSTP1 protein expression in the biopsy samples before operation and resected cancerous tissue samples was also carried out using 34 paired samples obtained from patients without neoadjuvant chemotherapy. GSTP1 expression level of biopsy samples was significantly correlated with that of tissue samples (P = .02, Table 2). Clinicopathological factors and GSTP1 grade in the 34 patients are shown in Table S1.
Table 2.
Correlation of GSTP1 expression between tissue and biopsy samples
| Total N = 34 | Tissue sample | Univariate analysis | |
|---|---|---|---|
| Grade 1 (n = 14) | Grade 2 (n = 20) | P‐value | |
| Biopsy sample | |||
| Grade 1 (n = 16) | 10 (62.5%) | 6 (37.5%) | .02 |
| Grade 2 (n = 18) | 4 (22.2%) | 14 (77.8%) | |
GSTP1, glutathione S‐transferase P1.
4. DISCUSSION
On the basis of the results of the JCOG 9907 study,22 neoadjuvant chemotherapy followed by conventional surgery is one of the standardized therapeutic approaches for localized advanced ESCC in Japan. However, the prognosis and mortality rate of advanced ESCC patients remain poor. In addition, there are few useful markers widely accepted as a predictor of prognosis or chemotherapeutic efficacy. Regarding chemotherapy, some patients do not respond to the treatment and cannot undergo surgery because of disease progression or adverse events.3, 22, 23 Some markers for chemotherapy sensitivity, such as caveolin‐1 and receptor interactive protein kinase 3, have been reported in ESCC,24, 25 but no useful marker is clinically accepted.
In the previous study, we reported that high GSTP1 expression was substantially related not only to poor prognosis but also to sensitivity to postoperative adjuvant chemotherapy in clinical analysis.19 Therefore, in the present study, we hypothesized that GSTP1 promotes tumor progression or drug resistance and examined the role of GSTP1 in ESCC cell lines.
Glutathione S‐transferases are well‐known enzymes for catalytic activities to eliminate toxic substances and oxidative stress,4 binding of non‐substrate ligands such as thyroid hormone, and protein‐protein interactions. In addition to such detoxifications, GSTP1 was also reported to be involved in cell survival and in the death signaling pathway through MAPK including JNK, p38 MAPK, and ERK,26, 27 which might contribute to the protection of tumor cells.28, 29, 30 Interestingly, the relationship between GSTP1 expression and tumor progression has been reported in cervical cancer,31 breast cancer,32 and other types of cancers.33 Some reports, including our previous study, described that GSTP1 promotes tumor progression in ESCC patients.19, 34 In the present study, proliferation was markedly inhibited by reduction of GSTP1 expression, and apoptosis was induced. These results were also confirmed by upregulation of apoptosis‐related protein expression, such as cleaved caspase‐3 or PARP. In non‐stressed cells, GSTP1 binds to JNK or TRAF2 to maintain low JNK activity.26, 27 Therefore, higher expression of GSTP1 in tumor cells may prevent tumor apoptosis and protect tumor cells from oxidative stress.
Relationships between GSTP1 expression and cell survival have been described in many reports. However, the impact of GSTP1 on tumor invasion and migration has not been sufficiently researched. Lin et al described that GSTP1 played a critical role in microRNA (miR)‐133b‐mediated tumor migration and was substantially related to MMP expression, although the effects on tumor invasion were not investigated.7 In the present study, invasion capacity of ESCC cell lines was decreased by knockdown of GSTP1 expression, whereas migration capacity was not. Although the difference in GSTP1 effects on invasion and migration capacity remains unclear, GSTP1‐related MMP may promote tumor progression.
Recently, the significance of GSTP1 for evaluating sensitivity to anticancer drugs such as CDDP,7, 8, 9, 10, 11, 30, 31, 32 5‐FU,12, 13 doxorubicin,11 and other types of drug,35 has been described. The relationship between GSTP1 expression and resistance to CDDP was especially demonstrated in lung cancer,7 breast cancer,8 ovarian cancer,9 and osteosarcoma30 in vitro. Regarding ESCC, few reports have shown the value of GSTP1 as a biomarker for CDDP and 5‐FU efficacy.36 In the chemosensitivity assay, viability of GSTP1 knockdown cells was significantly decreased by CDDP treatment, although proliferation was also decreased by GSTP1 knockdown. Moreover, in the apoptosis assay, early and late apoptosis rates by CDDP treatment were strongly increased in GSTP1 knockdown cells. However, these results were not obtained with 5‐FU treatment. Therefore, it is considered that GSTP1 has an important role for drug resistance against CDDP in ESCC cell lines.
Glutathione S‐transferase Pi 1 prevents JNK activity by forming a complex with JNK in non‐stressed cells, while dissociation of the complex occurs under oxidative stress and JNK activity is increased.26 Furthermore, GSTP1 was reported to modulate ERK1/2 rather than JNK under oxidative stress such as CDDP treatment.30 Thus, GSTP1 may play an important role in chemosensitivity through oxidative stress occurred by a DNA‐damaging agent such as CDDP rather than 5‐FU.
Moreover, regarding immunohistochemistry, lower GSTP1 expression was associated with downstaging and clinical response to neoadjuvant chemotherapy. This result showed that tumor cells with lower GSTP1 expression tended to be sensitive to chemotherapy and this was consistent with the results of chemosensitivity assay. This indicates a potential value of GSTP1 expression in clinical application to predict drug resistance in ESCC patients.
The present study had some limitations. First, it was very difficult to properly evaluate GSTP1 expression by immunohistochemistry in the tumor tissue treated by chemotherapy, because tumor cells sensitive to chemotherapy were already absent and replaced by scar tissue at the time of assessment (Figure S2a–d). Thus, GSTP1 expression levels of sensitive tumor specimens were assessed mainly based on remnant non‐sensitive tumor cells, which would show high levels of GSTP1 expression in immunohistochemistry assay. In this respect, in the present study, grade of GSTP1 expression in the tissue samples with neoadjuvant chemotherapy was not related to survival. The survival rate was 46.0% and 49.1% in grade 1 and 2 patients, respectively. There was no significant difference between either group (P = .91). Tumor sample before treatment, such as a biopsy sample, would be more appropriate for the assessment of GSTP1 expression.
Accurate prediction of sensitivity to chemotherapy before treatment can influence the first therapeutic approach such as neoadjuvant chemotherapy or surgery. Harpole et al reported the prognostic value of molecular markers including GST‐π using biopsy samples in ESCC patients treated with chemotherapy.37 Miyake et al also reported the value of GSTP1 expression in biopsy samples of breast cancer patients as a biomarker for response to neoadjuvant chemotherapy.38 In the present study, there was a significant correlation between GSTP1 expression in biopsy and resected tissue samples obtained from patients without neoadjuvant chemotherapy (P = 0.2, Table 2). This may show that GSTP1 expression level of biopsy samples can be a useful marker to predict tumor progression and chemosensitivity, although the number of analyzable cases was small and a larger study in biopsy samples is needed. Furthermore, considering tumor heterogeneity, more sections at several intervals of cancerous tissue or biopsy samples should be assessed to provide more accurate information on GSTP1 expression.
Second, we simply evaluated the expression level of GSTP1 in cell lines and tissue or biopsy samples, and the molecular biology or genetic alterations of GSTP1 for tumor progression was not sufficiently researched. Some reports noted that GSTP1 is associated with the MAPK pathway, which results in a poor prognosis.26, 27 Moreover, the association of GSTP1 polymorphism and survival in esophageal cancer was also reported.39 In this regard, some factors related to analyses of the molecular pathway including JNK and ERK, or polymorphism may be necessary.
In conclusion, GSTP1 plays an important role in malignant potential and drug resistance in vitro and can be a novel surrogate predictor of drug resistance in ESCC. Further research of GSTP1 using a larger number of biopsy samples should be carried out to provide more effective clinical application in ESCC patients.
CONFLICTS OF INTEREST
Authors declare no conflicts of interest for this article.
Supporting information
ACKNOWLEDGMENT
The authors are grateful to Dr Eiich Konishi of the Department of Surgical Pathology at Kyoto Prefectural University of Medicine for his contribution to immunohistochemistry assay in biopsy and tissue samples.
Ogino S, Konishi H, Ichikawa D, et al. Glutathione S‐transferase Pi 1 is a valuable predictor for cancer drug resistance in esophageal squamous cell carcinoma. Cancer Sci. 2019;110:795–804. 10.1111/cas.13896
REFERENCES
- 1. Jemal A, Bray F, Center MM, Ferlay J, Ward E, Forman D. Global cancer statistics. CA Cancer J Clin. 2011;61:69‐90. [DOI] [PubMed] [Google Scholar]
- 2. Rustgi AK, El‐Serag HB. Esophageal carcinoma. N Engl J Med. 2014;371:2499‐2509. [DOI] [PubMed] [Google Scholar]
- 3. Gebski V, Burmeister B, Smithers BM, et al. Survival benefits from neoadjuvant chemoradiotherapy or chemotherapy in oesophageal carcinoma: a meta‐analysis. Lancet Oncol. 2007;8:226‐234. [DOI] [PubMed] [Google Scholar]
- 4. Hayes JD, Flanagan JU, Jowsey IR. Glutathione transferases. Ann Rev Pharmacol Toxicol. 2005;45:51‐88. [DOI] [PubMed] [Google Scholar]
- 5. Wang Z, He W, Yang G, et al. Decreased expression of GST pi is correlated with a poor prognosis in human esophageal squamous carcinoma. BMC Cancer. 2010;10:352. [DOI] [PMC free article] [PubMed] [Google Scholar]
- 6. Ishimoto TM, Ali‐Osman F. Allelic variants of the human glutathione S‐transferase P1 gene confer differential cytoprotection against anticancer agents in Escherichia coli. Pharmacogenetics. 2002;12:543‐553. [DOI] [PubMed] [Google Scholar]
- 7. Lin C, Xie L, Lu Y, Hu Z, Chang J. miR‐133b reverses cisplatin resistance by targeting GSTP1 in cisplatin‐resistant lung cancer cells. Int J Mol Med 2018;41:2050‐2058. [DOI] [PMC free article] [PubMed] [Google Scholar]
- 8. Peklak‐Scott C, Smitherman PK, Townsend AJ, Morrow CS. Role of glutathione S‐transferase P1‐1 in the cellular detoxification of cisplatin. Mol Cancer Therapeutics. 2008;7:3247‐3255. [DOI] [PMC free article] [PubMed] [Google Scholar]
- 9. Sawers L, Ferguson MJ, Ihrig BR, et al. Glutathione S‐transferase P1 (GSTP1) directly influences platinum drug chemosensitivity in ovarian tumour cell lines. Br J Cancer. 2014;111:1150‐1158. [DOI] [PMC free article] [PubMed] [Google Scholar]
- 10. Yang M, Li Y, Shen X, et al. CLDN6 promotes chemoresistance through GSTP1 in human breast cancer. J Exp Clin Cancer Res. 2017;36:157. [DOI] [PMC free article] [PubMed] [Google Scholar]
- 11. Huang G, Mills L, Worth LL. Expression of human glutathione S‐transferase P1 mediates the chemosensitivity of osteosarcoma cells. Mol Cancer Therapeutics. 2007;6:1610‐1619. [DOI] [PubMed] [Google Scholar]
- 12. Joshi MB, Shirota Y, Danenberg KD, et al. High gene expression of TS1, GSTP1, and ERCC1 are risk factors for survival in patients treated with trimodality therapy for esophageal cancer. Clin Cancer Res. 2005;11:2215‐2221. [DOI] [PubMed] [Google Scholar]
- 13. Goekkurt E, Hoehn S, Wolschke C, et al. Polymorphisms of glutathione S‐transferases (GST) and thymidylate synthase (TS)–novel predictors for response and survival in gastric cancer patients. Br J Cancer. 2006;94:281‐286. [DOI] [PMC free article] [PubMed] [Google Scholar]
- 14. Ke HG, Li J, Shen Y, et al. Prognostic significance of GSTP1, XRCC1 and XRCC3 polymorphisms in non‐small cell lung cancer patients. Asian Pac J Cancer Prev. 2012;13:4413‐4416. [DOI] [PubMed] [Google Scholar]
- 15. Oliveira AL, Rodrigues FF, Santos RE, et al. GSTT1, GSTM1, and GSTP1 polymorphisms and chemotherapy response in locally advanced breast cancer. Genet Mol Res. 2010;9:1045‐1053. [DOI] [PubMed] [Google Scholar]
- 16. Chen G, Zhang H, Sun L, et al. Prognostic significance of GSTP1 in patients with triple negative breast cancer. Oncotarget. 2017;8:68675‐68680. [DOI] [PMC free article] [PubMed] [Google Scholar]
- 17. Tan KL, Jankova L, Chan C, et al. Clinicopathological correlates and prognostic significance of glutathione S‐transferase Pi expression in 468 patients after potentially curative resection of node‐positive colonic cancer. Histopathology. 2011;59:1057‐1070. [DOI] [PubMed] [Google Scholar]
- 18. Zhang W, Jiao H, Zhang X, et al. Correlation between the expression of DNMT1, and GSTP1 and APC, and the methylation status of GSTP1 and APC in association with their clinical significance in prostate cancer. Mol Med Rep. 2015;12:141‐146. [DOI] [PMC free article] [PubMed] [Google Scholar]
- 19. Yamamoto Y, Konishi H, Ichikawa D, et al. Significance of GSTP1 for predicting the prognosis and chemotherapeutic efficacy in esophageal squamous cell carcinoma. Oncol Rep. 2013;30:1687‐1694. [DOI] [PubMed] [Google Scholar]
- 20. Sobin LH, Gospodarowicz MK, Wittekind C, eds. TNM classification of malignant tumours (7th ed.). Chichester: Wiley‐Blackwell; 2009. [Google Scholar]
- 21. Schwartz LH, Litière S, de Vries E, et al. RECIST 1.1‐Update and clarification: from the RECIST committee. Eur J Cancer (1990). 2016;62:132‐137. [DOI] [PMC free article] [PubMed] [Google Scholar]
- 22. Ando N, Kato H, Igaki H, et al. A randomized trial comparing postoperative adjuvant chemotherapy with cisplatin and 5‐fluorouracil versus preoperative chemotherapy for localized advanced squamous cell carcinoma of the thoracic esophagus (JCOG9907). Ann Surg Oncol. 2012;19:68‐74. [DOI] [PubMed] [Google Scholar]
- 23. Okamura A, Watanabe M, Mine S, et al. Failure of neoadjuvant chemotherapy for resectable esophageal squamous cell carcinoma. Dis Esophagus. 2017;30:1‐8. [DOI] [PubMed] [Google Scholar]
- 24. Xu Y, Lin Z, Zhao N, et al. Receptor interactive protein kinase 3 promotes Cisplatin‐triggered necrosis in apoptosis‐resistant esophageal squamous cell carcinoma cells. PLoS ONE. 2014;9:e100127. [DOI] [PMC free article] [PubMed] [Google Scholar]
- 25. Zhang S, Cao W, Yue M, et al. Caveolin‐1 affects tumor drug resistance in esophageal squamous cell carcinoma by regulating expressions of P‐gp and MRP1. Tumour Biol. 2016;37:9189‐9196. [DOI] [PubMed] [Google Scholar]
- 26. Adler V, Yin Z, Fuchs SY, et al. Regulation of JNK signaling by GSTp. EMBO J. 1999;18:1321‐1334. [DOI] [PMC free article] [PubMed] [Google Scholar]
- 27. Wu Y, Fan Y, Xue B, et al. Human glutathione S‐transferase P1‐1 interacts with TRAF2 and regulates TRAF2‐ASK1 signals. Oncogene. 2006;25:5787‐5800. [DOI] [PubMed] [Google Scholar]
- 28. Yin Z, Ivanov VN, Habelhah H, et al. Glutathione Stransferase p elicits protection against H2O2‐induced cell death via coordinated regulation of stress kinases. Cancer Res. 2000;60:4053‐4057. [PubMed] [Google Scholar]
- 29. Lu M, Xia L, Luo D, Tew K, Ronai Z. Dual effects of glutathioneS‐transferase pi on As2O3action in prostate cancer cells: enhancement of growth inhibition and inhibition of apoptosis. Oncogene. 2004;23:3945‐3952. [DOI] [PubMed] [Google Scholar]
- 30. Gangxiong H, Lisa M, Laura L. Expression of human glutathione S‐transferase P1 mediates the chemosensitivity of osteosarcoma cells. Mol Cancer Ther 2007;6:1604‐1619. [DOI] [PubMed] [Google Scholar]
- 31. Cullen KJ, Newkirk KA, Schumaker LM, Aldosari N, Rone JD, Haddad BR. Glutathione S‐transferase pi amplification is associated with cisplatin resistance in head and neck squamous cell carcinoma cell lines and primary tumors. Cancer Res. 2003;63:8097‐8102. [PubMed] [Google Scholar]
- 32. Su F, Hu X, Jia W, Gong C, Song E, Hamar P. Glutathion S transferase pi indicates chemotherapy resistance in breast cancer. J Surg Res. 2003;113:102‐108. [DOI] [PubMed] [Google Scholar]
- 33. Ma HL, Yu C, Liu Y, et al. Decreased expression of glutathione S‐transferase pi correlates with poorly differentiated grade in patients with oral squamous cell carcinoma. J Oral Pathol Med. 2015;44:193‐200. [DOI] [PubMed] [Google Scholar]
- 34. Lee JM, Wu MT, Lee YC, et al. Association of GSTP1 polymorphism and survival for esophageal cancer. Clin Cancer Res. 2005;11:4749‐4753. [DOI] [PubMed] [Google Scholar]
- 35. Makhtar SM, Husin A, Baba AA, Ankathil R. Association of GSTM1, GSTT1 and GSTP1 Ile105Val polymorphisms with clinical response to imatinib mesylate treatment among Malaysian chronic myeloid leukaemia patients. J Genet. 2017;96:633‐639. [DOI] [PubMed] [Google Scholar]
- 36. Shimokuni T, Tanimoto K, Hiyama K, et al. Chemosensitivity prediction in esophageal squamous cell carcinoma: novel marker genes and efficacy‐prediction formulae using their expression data. Int J Oncol. 2006;28:1153‐1162. [PubMed] [Google Scholar]
- 37. Harpole DH Jr, Moore MB, Herndon JE II, et al. The prognostic value of molecular marker analysis in patients treated with trimodality therapy for esophageal cancer. Clin Cancer Res. 2001;7:562‐569. [PubMed] [Google Scholar]
- 38. Miyake T, Nakamura T, Naoi Y, et al. GSTP1 expression predicts poor pathological complete response to neoadjuvant chemotherapy in ER‐negative breast cancer. Cancer Sci. 2012;103:913‐920. [DOI] [PMC free article] [PubMed] [Google Scholar]
- 39. Song Y, Du Y, Zhou Q, et al. Association of GSTP1 Ile105Val polymorphism with risk of esophageal cancer: a meta‐analysis of 21 case‐control studies. Int J Clin Exp Med. 2014;7:3215‐3224. [PMC free article] [PubMed] [Google Scholar]
Associated Data
This section collects any data citations, data availability statements, or supplementary materials included in this article.
Supplementary Materials