

Abstract
Osteosarcoma (OS) is the most common malignant bone tumor and frequently affects adolescents. Norcantharidin (NCTD), a demethylated derivative of cantharidin, has been reported to exhibit anticancer activity against various types of tumors but not human OS. The aim of the present study was to evaluate the effects of NCTD on OS cell lines (MG63 and HOS) and to explore the underlying mechanisms. In the present study, the proliferation of OS cells decreased significantly, while the apoptosis was accelerated significantly after exposure to NCTD. Meanwhile, our results also indicated that NCTD could suppress the migration and invasion, decrease the colony‐forming ability and induce S phase cell cycle arrest of OS cells in a dose‐dependent manner. Moreover, our results revealed that the anticancer effects induced by NCTD on OS cells involved autophagy, mitophagy, endoplasmic reticulum stress and c‐Met pathway. Furthermore, the results of animal experiments showed that NCTD inhibited tumor growth in a xenograft model of human OS. These results provide important new insight into the possible molecular mechanisms of NCTD and highlight its potential use as an antitumor drug for human OS.
Keywords: apoptosis, autophagy, c‐Met, norcantharidin, osteosarcoma
1. INTRODUCTION
Osteosarcoma (OS) is the most common malignant tumor that originates in bone tissue, and it is prone to local invasion and early metastasis in children and young adults.1 Conventional surgical treatment can cause physical disability, resulting in poor prognosis. Recently, neoadjuvant chemotherapies have become the most common drugs for treating OS, but the poor response to chemotherapy is still a critical factor in OS patients.2 Despite advances in chemotherapy and aggressive surgical resection, clinical outcomes for OS patients have not substantially improved, and the 5‐year overall survival rate has remained stable at approximately 60% in patients with local disease and <40% for patients with metastatic disease.3 These facts highlight the urgent need to develop more effective therapies for OS.
Many researchers have focused on traditional Chinese medicines because of their varied bioactivities and broad application prospects in human diseases.4 Norcantharidin (NCTD) is a synthetic demethylated analog of cantharidin isolated from blister beetles.5 Previous studies have demonstrated that NCTD suppresses the growth of numerous cancer cell lines, including oral cancer,6 hepatoma7 and prostate cancer,8 via apoptosis, autophagy and cell cycle arrest. Demethylcantharidin tablets are now used in the clinical treatment of hepatoma, esophageal and gastric carcinoma, and leukemia.9
Considering the strong antitumour effects and widespread use of NCTD, it is essential to determine whether NCTD has an effect on human OS. Therefore, the aim of our study was to evaluate the effects of NCTD on OS cell lines (MG63 and HOS) in vitro and in vivo, and to explore the underlying mechanisms.
2. MATERIALS AND METHODS
2.1. Cell culture
The human OS cell lines were purchased from the ATCC. The cells were cultured in DMEM supplemented with 10% FBS and 1% streptomycin‐penicillin in a humidified atmosphere at 37°C and 5% CO2. The medium was changed every 2 days until the cells were used in the following procedures.
2.2. Cell proliferation assay
MG63 and HOS cells were seeded into 96‐well plates at a density of 8 × 10³ cells/well and treated with NCTD at concentrations of 0, 1.5625, 3.125, 6.25, 12.5, 25, 50, 100, 200 and 400 μmol/L. After incubation for 24, 48 and 72 hours, the morphology of the cultured cells was observed with an inverted phase contrast microscope. Then, 10 μL of CCK‐8 was added to each well, and the cells were incubated for another 1 hour. The cells were subsequently placed in a microplate reader to detect the absorbance at 450 nm. Cell viability was calculated using the following formula according to optical density (OD): cell viability = (experimental group OD − zeroing OD)/(control group OD − zeroing OD).
2.3. Apoptosis
Cell apoptosis was evaluated using Annexin V fluorescein isothiocyanate and propidium iodide (Annexin V‐FITC/PI) apoptosis detection kits (BD Biosciences, Franklin Lakes, NJ, USA). Briefly, 1 × 10⁶ cells were seeded in 100‐mm plates for 24 hours and then treated with various concentrations of NCTD (0, 50, 100 or 200 μmol/L) for 24 hours. Then, the cells were collected and washed twice with PBS and stained with Annexin V‐FITC and PI according to the manufacturers’ protocols. The samples were again read on a flow cytometer. Both early and late apoptotic cells were recorded as apoptotic cells, and the results were expressed as the percentage of total cells.
2.4. Caspase‐3 activity assay
The activity levels of caspase‐3 were detected using a caspase‐3 assay kit according to the manufacturer's instructions. Briefly, after cells were treated with various concentrations of NCTD (0, 50, 100, or 200 μmol/L), they were collected, lysed and centrifuged at 16 000 g for 20 minutes at 4°C. The supernatant containing protein was collected, and the protein concentrations were measured using BCA methods. Then, 50 μg of protein was incubated with buffer containing Ac‐DEVD‐pNA (2 mmol/L) at 37°C overnight, and the absorbance of yellow pNA (the cleavage product) was measured using a microplate reader at a wavelength of 405 nm. In addition, caspase‐3 activity was calculated as a fold of the OD of the different NCTD concentrations relative to the OD of the control group.
2.5. Cell cycle analysis
Cells were seeded in 100‐mm dishes at a density of 1 × 10⁶ cells/dish and treated with various concentrations of NCTD (0, 50, 100 or 200 μmol/L) for 24 hours. The cells were collected and fixed in 70% ethanol at −20°C overnight. Then, the cells were incubated with 10 mg/mL RNase and 50 μg/mL PI for 30 minutes. The cell cycle distribution was assessed using flow cytometry and data analysis was performed using FlowJo software (TreeStar, Ashland, OR, USA).
2.6. Scratch wound healing assay
MG63 and HOS cells were seeded into 6‐well plates and cultured in a humidified atmosphere at 37°C and 5% CO2. When the cells had grown to a confluence of approximately 80%, the dish was scraped in a straight line with a p200 pipet tip, and the cells were treated with NCTD at concentrations of 0, 50, 100 and 200 μmol/L for 12 and 24 hours. The wound area was observed under an optical microscope.
2.7. Transwell assay
Transwell assays with Matrigel were performed to evaluate cell migration and invasion as described previously. Briefly, MG63 and HOS cells were seeded on the upper surface of a transwell chamber at a density of 1 × 10⁶ cells/well, treated with NCTD at concentrations of 0, 50, 100 and 200 μmol/L, and incubated at 37°C for 24 hours. Then, the cells in the upper parts of the chamber were removed, while the invaded cells were fixed, stained and counted under a high‐power microscope.
2.8. Colony formation assay
Cells were seeded into 6‐well plates at a density of 500 cells/well. After 24 hours, the cells were treated with various concentrations of NCTD (0, 50, 100 or 200 μmol/L) and incubated for another 14 days until colonies had formed. The cells were washed twice with PBS, fixed with 4% paraformaldehyde for 20 minutes, and stained with 0.1% crystal violet for 30 minutes. The colony number in each well was counted under a microscope.
2.9. Western blot analysis
Cells were seeded in 6‐well plates and cultured in complete medium until they reached confluence. Then, the cells were lysed in RIPA buffer containing protease inhibitor at 4°C for 20 minutes. The lysates were cleared by centrifugation at 12 000 g at 4°C for 10 minutes. The protein concentration of the cell lysate was measured using a BCA protein assay kit (Beyotime, Shanghai, China). A total of 30 μg of total protein was resolved by SDS‐PAGE (Bio‐Rad, Hercules, CA, USA) and transferred to a PVDF membrane (Millipore, Billerica, MA, USA). The membrane was blocked with 5% dry nonfat milk in TBS plus 0.1% Tween (TBS‐T) for 2 hours at room temperature. The membranes were incubated overnight at 4°C with the primary antibody. Next, the membranes were incubated with the secondary HRP‐conjugated antibody (Abcam, Cambridge, MA, USA) for 1 hour at room temperature. Finally, the proteins on the membranes were observed with an Odyssey Scanning System (Li‐COR., Lincoln, NE, USA).
2.10. Xenograft tumor model
Four‐week‐old male BALB/C nude mice were purchased from Shanghai SLAC Laboratory Animal (Shanghai, China). All animal studies were carried out in accordance with the official recommendations of the Chinese Animal Community. The mice were housed with free access to a commercial diet and water under specific pathogen‐free conditions. After the mice were acclimated for 1 week prior to study initiation, 100 μL of HOS cells at a density of 2 × 10⁶ cells/mL were injected into the right flank. Tumor volume (TV) was measured daily and calculated according to the following formula: TV (mm3) = 0.5 × ab 2 (where a is the longest diameter and b is the shortest diameter of the tumor).10 When the average TV in all animals reached approximately 100 mm3, the nude mice were randomly assigned to 2 groups (with 6 nude mice/group). The NCTD groups received an intraperitoneal injection of 25 mg/kg NCTD every 2 days, while the control group was administered saline. TV was measured every 4 days to observe dynamic changes in tumor growth. After 28 days, all nude mice were killed, and the tumors were removed and weighed.
2.11. Immunohistochemical analyses
Immunohistochemical analysis was performed to evaluate the proliferation index (Ki67 and PCNA) of the xenograft tumors. Briefly, tumor tissues were embedded in paraffin. Four‐micron‐thick sections were deparaffinized, rehydrated with PBS and incubated with 3% H2O2 for 10 minutes. Then, the antigen was retrieved in 0.1% trypsin for 10 minutes at room temperature. The sections were blocked with 5% BSA for 30 minutes at room temperature and incubated with primary antibody overnight at 4°C. Next, a second antibody conjugated to diaminobenzidine (DAB) was applied at room temperature for 10 minutes and then washed with PBS. DAB was applied for 5 minutes and counterstained with Mayer's hematoxylin. Images were obtained by a high‐power microscope.
2.12. Statistical analysis
Statistical analyses were performed using SPSS 21.0 statistical software (IBM Corp., Armonk, NY, USA) and the data are presented as the mean ± SD. Statistical significance was calculated using Dunnett's test or Student's t test for unpaired data, and P < 0.05 was considered statistically significant.
3. RESULTS
3.1. Norcantharidin reduces the viability of human osteosarcoma cells
The chemical structure of NCTD is shown in Figure 1A. We initially investigated the effect of NCTD on the viability of 2 types of human OS cells (MG63 and HOS) using the CCK‐8 assay. NCTD reduced the viability of MG63 and HOS cells in a time‐dependent and concentration‐dependent manner (Figure 1B,C). The viability of MG63 cells remained stable in the 25 μmol/L NCTD treatment groups and was equivalent to that of the control group. However, viability was markedly decreased in the 50‐μmol/L group (P < 0.01). Similar trends were observed in HOS cells. The IC50 values for the MG63 cells were 128.60 ± 5.71 μmol/L and 54.44 ± 4.32 μmol/L after 24 and 48 hours of treatment, respectively. The IC50 values for the HOS cells were 181.90 ± 3.41 μmol/L, 71.69 ± 5.62 μmol/L and 64.01 ± 4.82 μmol/L after 24, 48 and 72 hours of treatment, respectively. As shown in Figure 1D, MG63 and HOS cells were seeded at the same density in 6‐well plates and treated with NCTD at concentrations of 0, 50, 100 and 200 μmol/L for 24 hours. Images obtained using an inverted phase contrast microscope showed a slight decrease in cultured cell numbers in the 50 μmol/L NCTD group compared to that in the control group and significantly reduced cell numbers at the 100 and 200 μmol/L NCTD concentrations. These data suggest that NCTD inhibits the growth of human OS cells.
Figure 1.
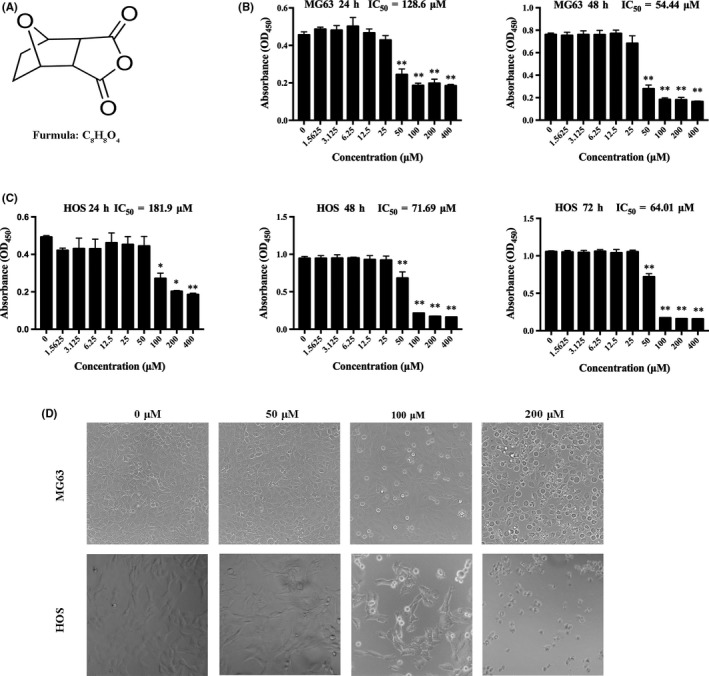
NCTD inhibits cell viability in human OS cells. A, The chemical structure of NCTD. B, MG63 cells were treated with different concentrations of NCTD for 24 and 48 h. C, HOS cells were treated with different concentrations of NCTD for 24, 48 and 72 h, and cell viability was measured using a CCK‐8 assay. D, Morphological changes in MG63 and HOS cells that were treated with NCTD for 24 h and photographed using an inverted phase contrast microscope. All data are represented as the mean ± SD (n = 3) for each group. *P < 0.05, **P < 0.01. NCTD, norcantharidin; OS, osteosarcoma
3.2. Norcantharidin arrests human osteosarcoma cells at the S phase and affects the expression of cell cycle proteins
To delineate the mechanisms by which NCTD inhibits cell viability, we examined the cell cycle distribution using flow cytometry (Figure 2A). The results showed that cell cycle progression was significantly inhibited at the S phase, as presented in Figure 2B. To obtain additional information, cell cycle regulatory protein expression was investigated by western blotting (Figure 2C). The results showed that NCTD treatment led to a significant dose‐dependent decrease in the levels of cyclin D1, but p27 expression was elevated (Figure 2D). These data further demonstrated that NCTD inhibits the growth of human OS cells at the S phase.
Figure 2.
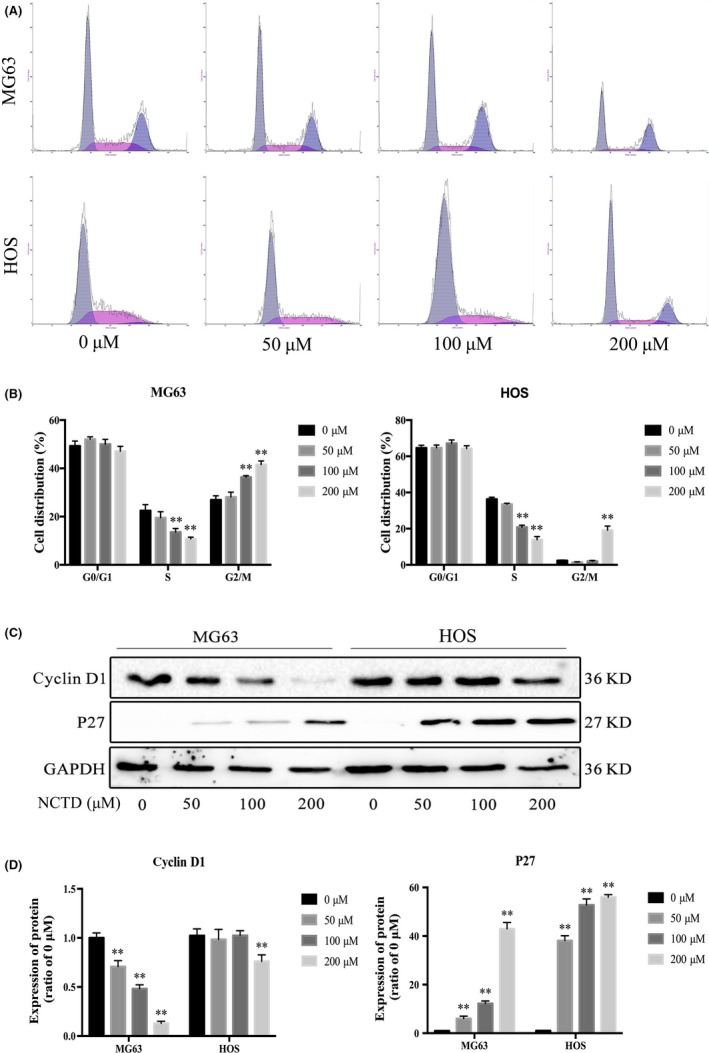
NCTD induces cell cycle arrest in human OS cells. A, MG63 and HOS cells were exposed to various concentrations of NCTD for 24 h, followed by analysis of the cell cycle by flow cytometry. B, Quantification of the percentage of cells in G0/G1, S and G2/M phase for each OS cell line. C, Western blot analysis of cell cycle‐associated protein extracts obtained from OS cells treated with different concentrations of NCTD for 24 h. D, Quantitative analyses of western blots. The data are presented as the mean ± SD (n = 3). *P < 0.05, **P < 0.01 vs the control group. NCTD, norcantharidin; OS, osteosarcoma
3.3. Norcantharidin induces apoptosis and alters the expression of apoptosis‐associated proteins in human osteosarcoma cells
To investigate the mechanism by which NCTD inhibits cell viability, we analyzed the effects of NCTD on cell apoptosis using flow cytometry (Figure 3A). The results indicate that the number of Annexin V‐FITC‐positive and PI‐positive cells increased as the NCTD concentration increased (Figure 3B). As caspases are proteolytic enzymes that are essential for apoptosis, the increased caspase activity results in cell apoptosis, with caspase‐3 activation as the ultimate executioner of apoptotic pathways. As shown in Figure 3C, treatment with different concentrations of NCTD for 24 hours resulted in obviously increased caspase‐3 activity in the OS cell lines.
Figure 3.
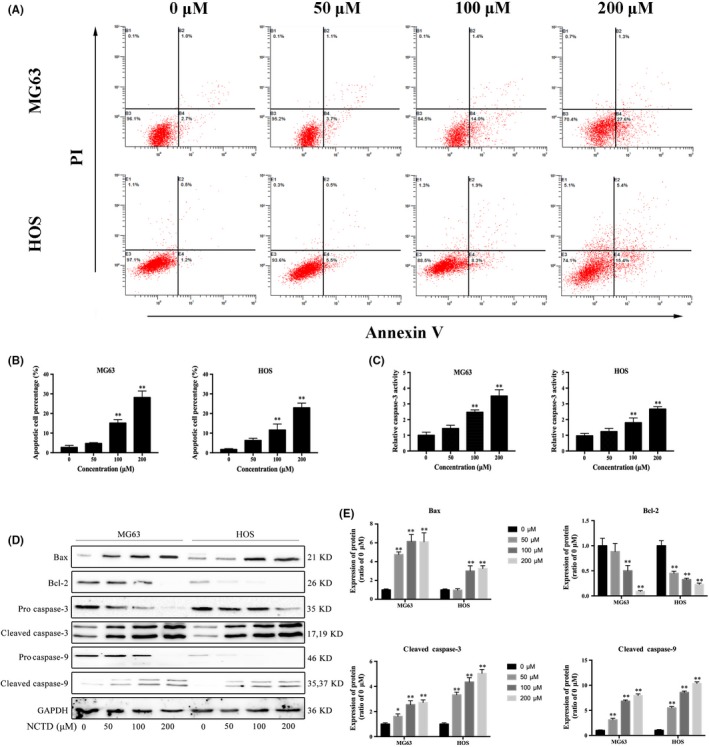
NCTD promotes apoptosis in OS cell lines. A, Two OS cell lines were treated with various concentrations of NCTD for 24 h and then stained with Annexin V‐FITC and PI prior to analysis via flow cytometry. B, Quantitative analyses of the percentage of apoptotic cells. C, The effects of NCTD on caspase‐3 activity in MG63 and HOS cells were determined using a caspase‐3 activity assay kit, and the results are expressed as fold changes relative to the 0 μmol/L group. D, MG63 and HOS cells were treated with 0, 50, 100 or 200 μmol/L NCTD for 24 h. The effects of NCTD on Bax, Bcl‐2, procaspase‐3 and procaspase‐9 were evaluated by western blotting. GAPDH was used as an internal control. E, Quantitative analyses of the western blots. The data are presented as the mean ± SD (n = 3). *P < 0.05, **P < 0.01 vs the control group. NCTD, norcantharidin; OS, osteosarcoma
To investigate the role of the Bcl‐2 family in NCTD‐induced apoptosis, we evaluated protein expression levels by western blotting. As shown in Figure 3D,E, treatment with NCTD for 24 hours markedly downregulated the expression levels of the anti‐apoptotic protein Bcl‐2 and increased the expression levels of the pro‐apoptotic protein Bax. We also examined the effect of NCTD on the expression of 2 critical apoptosis‐related proteins (caspase‐3 and caspase‐9) in MG63 and HOS cells. NCTD activated caspase‐3 and caspase‐9 in a dose‐dependent manner. These in vitro results confirmed that NCTD induces apoptosis in human OS cells.
3.4. Norcantharidin decreases the colony formation ability of osteosarcoma cells
Furthermore, we determined the tumorigenicity of OS cells using the colony formation assay. After a 24‐hour treatment with various concentrations of NCTD, MG63 and HOS cells were cultured for another 14 days, and the number of colonies was counted. As shown in Figure 4A,B, NCTD decreased the number of colonies in a dose‐dependent manner in the human OS cells.
Figure 4.
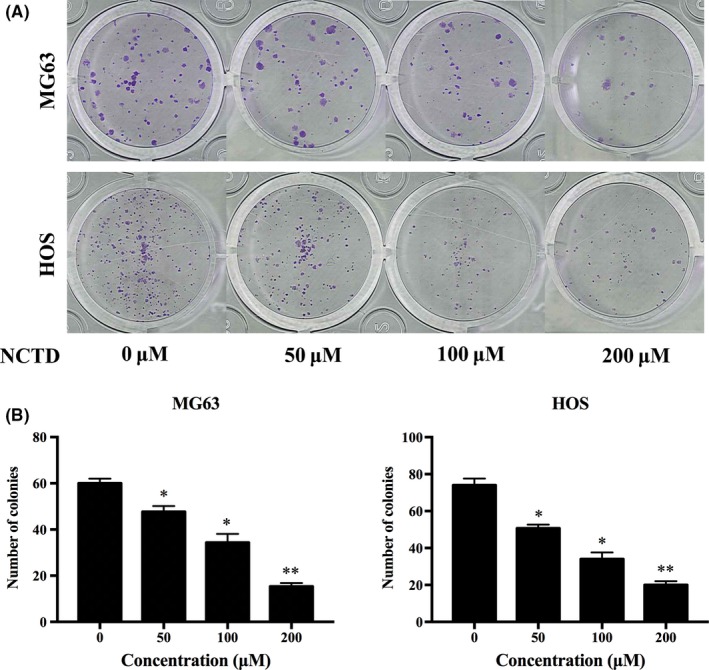
NCTD decreases the colony formation ability of OS cells. A, The colony formation assay was performed in MG63 and HOS cells. B, The numbers of colonies were counted under a microscope. The data are presented as the mean ± SD (n = 3). *P < 0.05, **P < 0.01 vs the control group (0 μmol/L). NCTD, norcantharidin; OS, osteosarcoma
3.5. Norcantharidin suppresses the migration and invasion of osteosarcoma cells and reduces MMP2 and MMP9 protein expression
Representative photographs of cells migrating into scratch wounds are shown in Figure 5A. NCTD significantly inhibited cell migration in a dose‐dependent manner (Figure 5B), and the transwell assay showed that NCTD reduced the relative invasion rates of MG63 and HOS cells in a dose‐dependent manner (Figure 5C,D). We next evaluated the expression levels of MMP2 and MMP9, which are known to play important roles in the migration and invasion of OS cells. As determined by western blotting, NCTD significantly inhibited the expression of MMP2 and MMP9 in MG63 and HOS cells (Figure 5E,F). These results suggested that NCTD significantly inhibits the migration and invasion of human OS cells.
Figure 5.
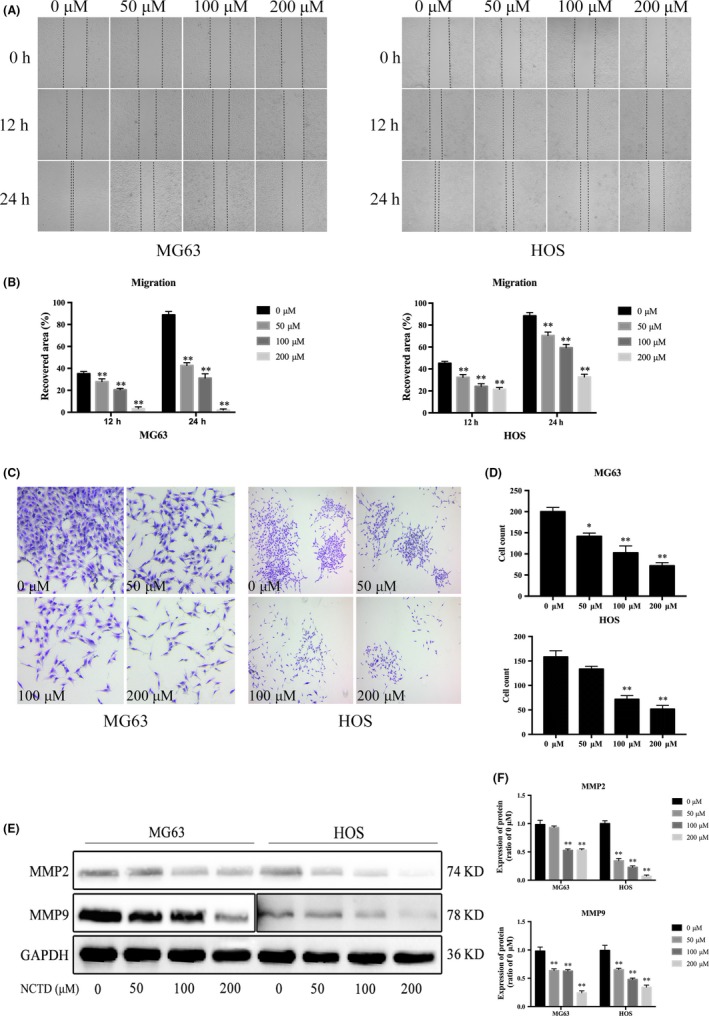
NCTD inhibits the migration and invasion of OS cells. A, MG63 and HOS cells were treated with NCTD at concentrations of 0, 50, 100 or 200 μmol/L for 12 and 24 h. Images were obtained under a fluorescence microscope. B, Quantitative analysis of the scratch wound assay. C, Images of the invasion of MG63 and HOS cells treated with different concentrations of NCTD for 24 h. D, Counts of invaded cells from the transwell assay. E, Protein expression of MMP2 and MMP9 in MG63 and HOS cells after treatment with different concentrations of NCTD, as assessed by western blot analyses. F, Quantitative analyses of western blots. The data are presented as the mean ± SD (n = 3). *P < 0.05, **P < 0.01 vs the control group. NCTD, norcantharidin; OS, osteosarcoma
3.6. Norcantharidin suppresses the c‐Met pathway in human osteosarcoma cells
Previous studies have reported that NCTD is a synthetic anticancer compound that inhibits c‐Met in human colon cancers.11 Increasing evidence has demonstrated that overactive c‐Met signaling is a key driver of tumor progression.12 We next explored the effects of NCTD on the c‐Met signaling pathway by examining the expression of c‐Met and phosphorylated c‐Met (p‐c‐Met) by western blotting. The results showed that both c‐Met and p‐c‐Met levels were markedly decreased in OS cells treated with NCTD (Figure 6A). The downstream signaling targets of c‐Met, including stat3, Akt and ERK, were also evaluated. As shown in Figure 6B,C, NCTD significantly inhibited the expression of stat3, Akt and ERK in OS cells in a dose‐dependent manner. These data revealed that NCTD suppresses the c‐Met pathway in human OS cells.
Figure 6.
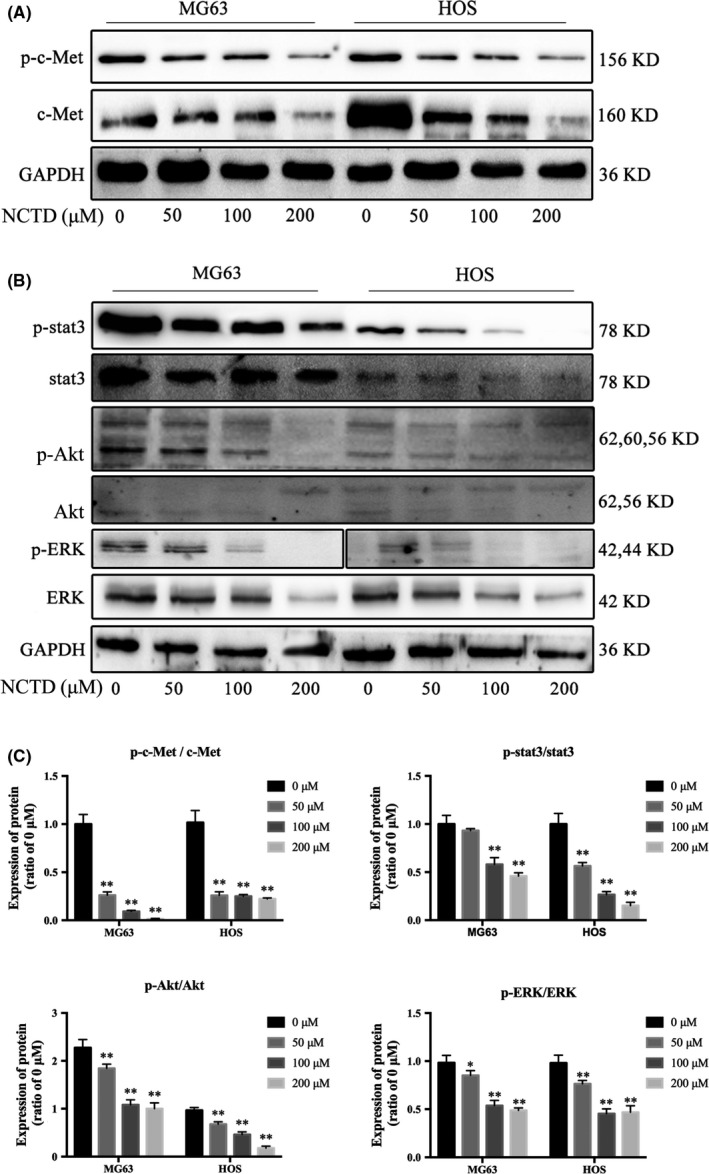
NCTD downregulates the c‐Met signaling pathway. A, Western blot analysis of c‐Met and p‐c‐Met in OS cells treated with NCTD for 24 h. B, Western blot analysis of the signaling pathway downstream of c‐Met, including stat3, Akt and ERK, in OS cells treated with NCTD (0, 50, 100 or 200 μmol/L). C, Quantitative analyses of the western blots. The data are presented as the mean ± SD (n = 3). *P < 0.05, **P < 0.01 vs the control group. NCTD, norcantharidin; OS, osteosarcoma
3.7. Norcantharidin induces autophagy and mitophagy and alters the expression of autophagy‐related proteins
Given that NCTD inhibited the expression of Akt, it is important to consider whether NCTD inhibits the Akt/mTOR signaling pathways and induces autophagy in human OS cells. Autophagy is a complex process that can be triggered or repressed by multiple signaling pathways. Among these pathways, mTOR is represented as a key negative regulator of autophagy.13 As shown in Figure 7A, exposure to NCTD strikingly attenuated the phosphorylation of mTOR in both MG63 and HOS cells, and no change in total mTOR was observed. To confirm NCTD‐induced autophagy of OS cells, the expression levels of LC3‐I, LC3‐II and p62 were measured by western blotting after treating OS cells with NCTD. As shown in Figure 7B, treatment of OS cells with NCTD accelerates the differentiation of LC3‐I into LC3‐II and downregulates p62 expression.
Figure 7.
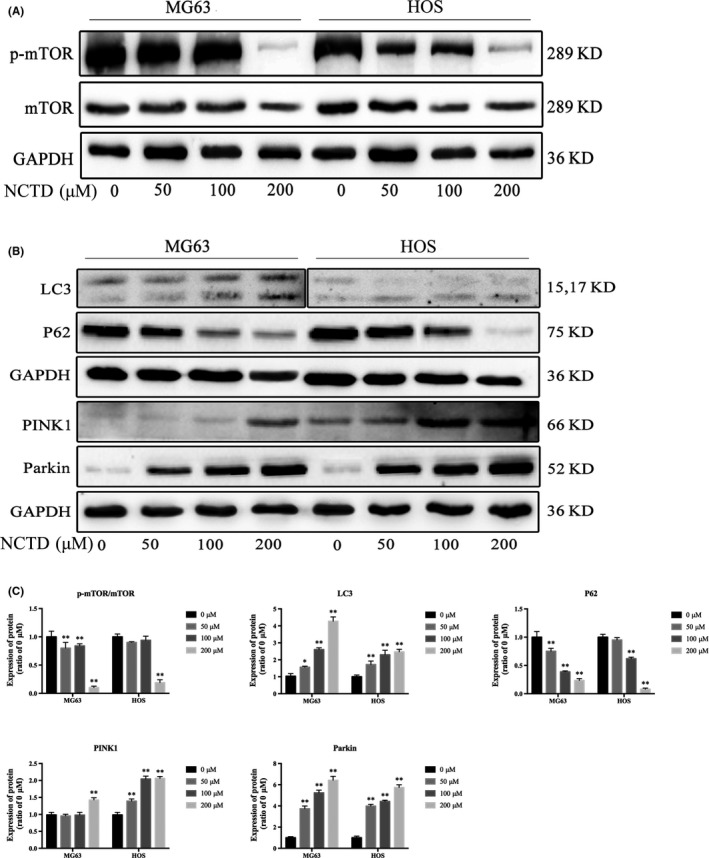
NCTD induces autophagy and mitophagy in human OS cells. A, Expression of p‐mTOR and mTOR in MG63 and HOS cells treated with various concentrations of NCTD for 24 h. B, MG63 and HOS cells were treated with NCTD for 24 h, and the expression of LC3, p62, PINK1 and Parkin was determined by western blotting. C, Quantitative analyses of western blots. The data are presented as the mean ± SD (n = 3). *P < 0.05, **P < 0.01 vs the control group. NCTD, norcantharidin; OS, osteosarcoma
The effect of mitophagy has been widely studied and is considered to be an early manifestation of cell autophagy. Mitochondrial damage compromises mitochondrial functions, thereby inducing mitophagy.14 We investigated whether mitophagy occurs after NCTD treatment to further explore the mechanism underlying NCTD‐induced autophagy in OS cells. Many studies have shown that PINK1 and Parkin interact to regulate mitochondrial function, and the PINK1/Parkin pathway is associated with mitophagy.15 The activation of PINK1 is an initiating event that induces mitophagy.16 As shown in Figure 7B,C, after treatment with different concentrations of NCTD, both PINK1 and Parkin protein expression levels increased in MG63 and HOS cells. These results suggest that NCTD induced autophagy and mitophagy in human OS cells.
3.8. Norcantharidin induces endoplasmic reticulum stress in osteosarcoma cells
Several studies have reported the induction of endoplasmic reticulum (ER) stress during apoptosis in various tumor cells.17 Therefore, we investigated ER stress‐associated proteins. Our results indicate that NCTD significantly increased the expression of GRP78, ATF‐4, p‐eIF2α and CHOP in a concentration‐dependent manner in MG63 and HOS cells (Figure 8A,B). These results suggest that NCTD triggers ER stress in human OS cells.
Figure 8.
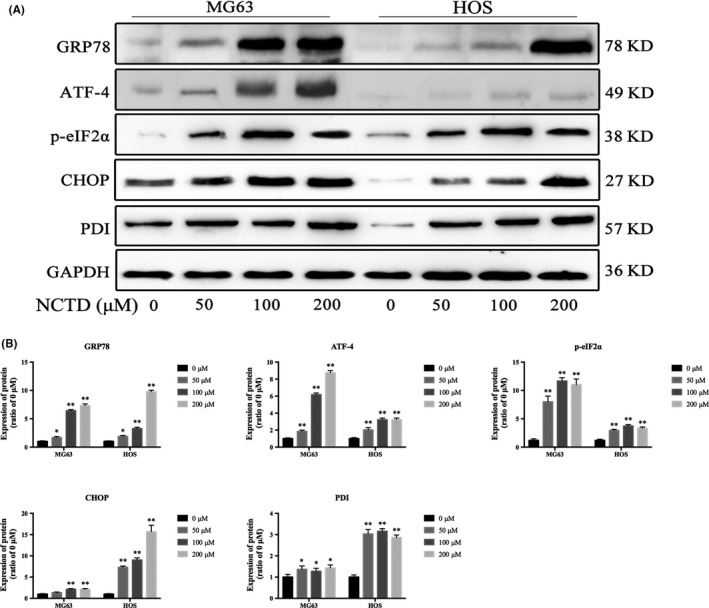
NCTD induces ER stress in human OS cells. A, MG63 and HOS cells were incubated with NCTD (0, 50, 100 or 200 μmol/L) for 24 h, and the protein expression levels of GRP78, ATF‐4, p‐eIF2α and CHOP were assessed by western blotting. B, Quantitative analyses of the western blots. The data are presented as the mean ± SD (n = 3). *P < 0.05, **P < 0.01 vs the control group. ER, endoplasmic reticulum; NCTD, norcantharidin; OS, osteosarcoma
3.9. Norcantharidin inhibits tumor growth in a xenograft model of human osteosarcoma
Finally, we investigated the effect of NCTD on tumor growth in vivo using HOS xenograft nude BALB/C mice. After 28 days, the NCTD‐treated group exhibited a lower TV than the control group (Figure 9A). In addition, NCTD did not significantly alter the total body weight (Figure 9B) but decreased the tumor weight compared to that of the control group (Figure 9C,D). Furthermore, the proliferation indices (as indicated by Ki67 and PCNA expression) were lower in tumor specimens from the NCTD‐treated group than in tumor specimens from the control group (Figure 9E,F). These findings indicated that NCTD efficiently suppresses human OS tumor growth in vivo.
Figure 9.
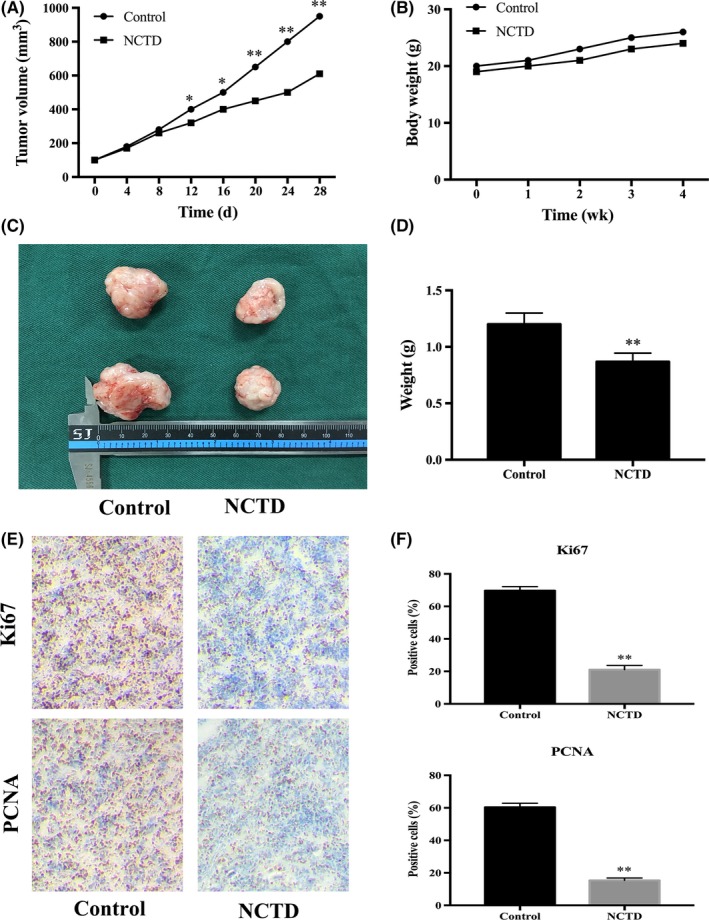
NCTD suppresses the growth of human OS xenograft tumors in vivo. A, The volumes of the xenograft tumors were measured and compared every 4 d. B, The weight of each nude mouse was measured and compared every week. C,D, Four weeks after treatment initiation, the xenograft tumors were retrieved from the mice, and the tumor weight was measured and compared. E,F, Xenograft tumors were stained with Ki67 and PCNA antibodies using IHC analysis (original magnification, 400×). The data are presented as the mean ± SD (n = 3). *P < 0.05, **P < 0.01 vs the control group. IHC, immunohistochemical; NCTD, norcantharidin; OS, osteosarcoma
4. DISCUSSION
Poor response to chemotherapy is a major challenge in OS treatment.2 NCTD has been reported clinically as a safe and effective antitumor drug for treating many types of tumors in the clinic, but little is known about its effect on human OS.9 In this work, 2 human OS cell lines, MG63 and HOS, were used to elucidate the mechanism that underlies the antitumor activity of NCTD. In our study, NCTD significantly suppressed the growth of OS, arrested human OS cells at the S phase and induced apoptosis. NCTD also suppressed the migration and invasion of OS cells. The western blot assay further indicated that NCTD suppresses human OS growth due to its effects on autophagy, mitophagy, ER stress and the c‐Met signaling pathway. Our results indicate that NCTD suppresses the growth of human OS cells in vitro and in vivo.
The c‐Met receptor was discovered for the first time in an OS‐derived cell line by Cooper and colleagues in 1984.18 c‐Met is a transmembrane tyrosine kinase receptor that is overexpressed in several types of tumors and promotes cell survival, transformation, proliferation and motility.19 Several studies have shown the crucial role of the c‐Met pathway in OS initiation and progression.20, 21 The overexpression of the Met oncogene initiates the transformation of human primary osteoblasts and sustains tumor progression towards OS.12 The activation of c‐Met results in the activation of a series of downstream signaling pathways, such as PI3K/Akt, MAPK/ERK and stat3.19 Our data showed that NCTD markedly decreased both c‐Met and p‐c‐Met levels in OS cells. The downstream signaling targets of c‐Met, including Akt, ERK and stat3, were also inhibited. The stat3 pathway was postulated to be important in OS formation because the selective inactivation of phospho‐stat3 blocks tumorigenesis in OS.22 In addition, Akt and ERK represent 2 of the most important intracellular pathways that drive tumor cell survival, transformation and proliferation.23 It has been demonstrated that cancer cells are able to survive metabolic and therapeutic stresses through autophagy.24 Furthermore, Akt signaling is able to strongly influence the activation of autophagy.13 This emerging role led us to evaluate the possible induction of autophagy in response to NCTD treatment.
Apoptosis, type I programmed cell death, has been widely studied in relation to the treatment of malignant tumors. Consistent with these studies, our flow cytometry results showed that NCTD can effectively induce apoptosis in human OS cells in a dose‐dependent manner (Figure 3). Mitochondria are important mediators of the intrinsic apoptosis pathway. At the onset of apoptosis, changes in the outer mitochondrial membrane occur; in particular, changes in Bcl‐2 family proteins alter the mitochondrial membrane potential. This family includes anti‐apoptotic proteins, such as Bcl‐2, and pro‐apoptotic proteins, such as Bax.25 In our study, NCTD treatment led to the loss of MMPs, and this change was accompanied by an increase in the pro‐apoptotic protein Bax and a decrease in the anti‐apoptotic protein Bcl‐2, which led to the cleavage of active caspase‐3 and caspase‐9. This process causes morphological and biological apoptotic changes and eventually inhibits proliferation and accelerates apoptosis in human OS cells.
Autophagy, type II programmed cell death, is an independent cell death process that is different from apoptosis.26 The transformation of non‐lipidated LC3 (LC3‐I) into its lipidated form (LC3‐II) with concomitant degradation of p62 represents the process of autophagy.27 Excessive autophagy is likely to accelerate apoptosis, promoting cell death.28 Previous studies have demonstrated that the Akt/mTOR signaling pathway is critical for cell autophagy and that the suppression of this pathway could inhibit the progression of various malignant tumors.13 The present investigation showed that NCTD treatment reduced mTOR phosphorylation and caused changes in the expression of LC3 and p62, 2 essential autophagic markers; these findings are consistent with the induction of autophagy, indicating that NCTD mediates autophagy and apoptosis in human OS cells via the inhibition of the Akt/mTOR signaling pathway.
The ER stress response exists in diverse biological systems and plays roles in the regulation of cell proliferation in many tumor cells.29 There is also evidence that the induction of ER stress proteins plays a role in apoptosis in various cancer cells.17 GRP78 functions as a molecular chaperone and is a major regulator of ER stress, as it maintains the integrity of the ER and controls the activation of unfolded protein response (UPR) signaling molecules.30 The UPR involves 3 proteins (i.e. inositol‐requiring enzyme‐1, activating transcription factor 6 and protein kinase R‐like ER kinase [PERK]), that respond to the accumulation of unfolded proteins as part of a survival response.31 When the ER stress response occurs, PERK dissociates from GRP78, activates itself by oligomerization and phosphorylation, and directly phosphorylates the translation initiation factor eIF2α, leading to a general attenuation of protein synthesis. In addition, the activation of PERK leads to increased expression of ATF4 and its targeted transcription factor, CHOP, during ER stress.32 In our study, the possible relationship between NCTD‐induced ER stress and apoptosis is that NCTD induces the activation of GRP78 during the early stages of apoptosis and later activates the transcription factor ATF4 and binds to the CHOP promoter. There is a subsequent increase in mitochondrial membrane permeability due to the dephosphorylation of Akt, and ATF‐4/CHOP appears to mediate the transduction of apoptotic signals from the ER to the mitochondria. These results indicate that NCTD induced ER stress and led to accelerated apoptosis mediated by GRP78‐phospho‐eIF2α‐ATF4‐CHOP in human OS cells.
In conclusion, our results demonstrate that NCTD can arrest the cell cycle and induce apoptosis in human OS cells, and these effects are mediated by the induction of autophagy, the triggering of ER stress and the inactivation of the c‐Met/Akt/mTOR pathway. These findings provide important new insights into the possible molecular mechanisms of NCTD and highlight its potential use as an antitumor drug for human OS. Currently, this drug is orally administered in the form of demethlcanthardin tablets, which may limit its application for local treatment, and a sarcoma‐targeting peptide‐guided intracellular drug delivery system 33
CONFLICT OF INTEREST
The authors have no conflict of interest.
ACKNOWLEDGMENTS
This study is sponsored by The Key Laboratory of Biomedical Information Engineering of Ministry of Education, School of Life Science and Technology, Xi’an Jiaotong University. We would like to especially thank Dr Xijing He and colleagues from the Department of Orthopaedics, Second Affiliated Hospital, Xi')an Jiaotong University Health Science Center for their help.
Mei L, Sang W, Cui K, Zhang Y, Chen F, Li X. Norcantharidin inhibits proliferation and promotes apoptosis via c‐Met/Akt/mTOR pathway in human osteosarcoma cells. Cancer Sci. 2019;110:582–595. 10.1111/cas.13900
REFERENCES
- 1. Ottaviani G, Jaffe N. The epidemiology of osteosarcoma. Cancer Treat Res. 2009;152:3‐13. [DOI] [PubMed] [Google Scholar]
- 2. He H, Ni J, Huang J. Molecular mechanisms of chemoresistance in osteosarcoma (Review). Oncol Lett. 2014;7:1352‐1362. [DOI] [PMC free article] [PubMed] [Google Scholar]
- 3. Ferrari S, Briccoli A, Mercuri M, et al. Postrelapse survival in osteosarcoma of the extremities: prognostic factors for long‐term survival. J Clin Oncol. 2003;21:710‐715. [DOI] [PubMed] [Google Scholar]
- 4. Qiao L, Chen W. Atheroprotective effects and molecular targets of bioactive compounds from traditional Chinese medicine. Pharmacol Res. 2018;135:212‐229. [DOI] [PubMed] [Google Scholar]
- 5. Wang WJ, Wu MY, Shen M, et al. Cantharidin and norcantharidin impair stemness of pancreatic cancer cells by repressing the beta‐catenin pathway and strengthen the cytotoxicity of gemcitabine and erlotinib. Int J Oncol. 2015;47:1912‐1922. [DOI] [PubMed] [Google Scholar]
- 6. Kok SH, Hong CY, Kuo MY, et al. Comparisons of norcantharidin cytotoxic effects on oral cancer cells and normal buccal keratinocytes. Oral Oncol. 2003;39:19‐26. [DOI] [PubMed] [Google Scholar]
- 7. Chen YN, Chen JC, Yin SC, et al. Effector mechanisms of norcantharidin‐induced mitotic arrest and apoptosis in human hepatoma cells. Int J Cancer. 2002;100:158‐165. [DOI] [PubMed] [Google Scholar]
- 8. Xiao W, Dai B, Zhu Y, Ye D. Norcantharidin induces autophagy‐related prostate cancer cell death through Beclin‐1 upregulation by miR‐129‐5p suppression. Tumour Biol. 2015;37:15643‐15648. [DOI] [PubMed] [Google Scholar]
- 9. Deng LP, Dong J, Cai H, Wang W. Cantharidin as an antitumor agent: a retrospective review. Curr Med Chem. 2013;20:159‐166. [DOI] [PubMed] [Google Scholar]
- 10. Wang Y, Deng X, Yu C, et al. Synergistic inhibitory effects of capsaicin combined with cisplatin on human osteosarcoma in culture and in xenografts. J Exp Clin Cancer Res. 2018;37:251. [DOI] [PMC free article] [PubMed] [Google Scholar]
- 11. Qiu P, Wang S, Liu M, et al. Norcantharidin inhibits cell growth by suppressing the expression and phosphorylation of both EGFR and c‐Met in human colon cancer cells. BMC Cancer. 2017;17:55. [DOI] [PMC free article] [PubMed] [Google Scholar]
- 12. Patane S, Avnet S, Coltella N, et al. MET overexpression turns human primary osteoblasts into osteosarcomas. Cancer Res. 2006;66:4750‐4757. [DOI] [PubMed] [Google Scholar]
- 13. Xue R, Meng Q, Lu D, Liu X, Wang Y, Hao J. Mitofusin2 induces cell autophagy of pancreatic cancer through inhibiting the PI3K/Akt/mTOR signaling pathway. Oxid Med Cell Longev. 2018;2018:2798070. [DOI] [PMC free article] [PubMed] [Google Scholar]
- 14. Melser S, Lavie J, Benard G. Mitochondrial degradation and energy metabolism. Biochim Biophys Acta. 2015;1853:2812‐2821. [DOI] [PubMed] [Google Scholar]
- 15. Geisler S, Holmstrom KM, Skujat D, et al. PINK1/Parkin‐mediated mitophagy is dependent on VDAC1 and p62/SQSTM1. Nat Cell Biol. 2010;12:119‐131. [DOI] [PubMed] [Google Scholar]
- 16. Jin SM, Youle RJ. The accumulation of misfolded proteins in the mitochondrial matrix is sensed by PINK1 to induce PARK2/Parkin‐mediated mitophagy of polarized mitochondria. Autophagy. 2013;9:1750‐1757. [DOI] [PMC free article] [PubMed] [Google Scholar]
- 17. Tan GX, Wang XN, Tang YY, et al. PP‐22 promotes autophagy and apoptosis in the nasopharyngeal carcinoma cell line CNE‐2 by inducing endoplasmic reticulum stress, downregulating STAT3 signaling, and modulating the MAPK pathway. J Cell Physiol. 2019;234:2618‐2630. [DOI] [PubMed] [Google Scholar]
- 18. Cooper CS, Park M, Blair DG, et al. Molecular cloning of a new transforming gene from a chemically transformed human cell line. Nature. 1984;311:29‐33. [DOI] [PubMed] [Google Scholar]
- 19. Goetsch L, Caussanel V, Corvaia N. Biological significance and targeting of c‐Met tyrosine kinase receptor in cancer. Front Biosci (Landmark Ed). 2013;18:454‐473. [DOI] [PubMed] [Google Scholar]
- 20. Li X, Sun X, Wu J, Li Z. MicroRNA‐613 suppresses proliferation, migration and invasion of osteosarcoma by targeting c‐MET. Am J Cancer Res. 2016;6:2869‐2879. [PMC free article] [PubMed] [Google Scholar] [Retracted]
- 21. Wang K, Zhuang Y, Liu C, Li Y. Inhibition of c‐Met activation sensitizes osteosarcoma cells to cisplatin via suppression of the PI3K‐Akt signaling. Arch Biochem Biophys. 2012;526:38‐43. [DOI] [PubMed] [Google Scholar]
- 22. Zhang T, Li J, Yin F, et al. Toosendanin demonstrates promising antitumor efficacy in osteosarcoma by targeting STAT3. Oncogene. 2017;36:6627‐6639. [DOI] [PMC free article] [PubMed] [Google Scholar]
- 23. Lu H, Jiang T, Ren K, et al. RUNX2 plays an oncogenic role in esophageal carcinoma by activating the PI3K/AKT and ERK signaling pathways. Cell Physiol Biochem. 2018;49:217‐225. [DOI] [PubMed] [Google Scholar]
- 24. Sui X, Chen R, Wang Z, et al. Autophagy and chemotherapy resistance: a promising therapeutic target for cancer treatment. Cell Death Dis. 2013;4:e838. [DOI] [PMC free article] [PubMed] [Google Scholar]
- 25. Edlich F, Banerjee S, Suzuki M, et al. Bcl‐x(L) retrotranslocates Bax from the mitochondria into the cytosol. Cell. 2011;145:104‐116. [DOI] [PMC free article] [PubMed] [Google Scholar]
- 26. Lalaoui N, Lindqvist LM, Sandow JJ, Ekert PG. The molecular relationships between apoptosis, autophagy and necroptosis. Semin Cell Dev Biol. 2015;39:63‐69. [DOI] [PubMed] [Google Scholar]
- 27. Galluzzi L, Baehrecke EH, Ballabio A, et al. Molecular definitions of autophagy and related processes. EMBO J. 2017;36:1811‐1836. [DOI] [PMC free article] [PubMed] [Google Scholar]
- 28. Anding AL, Baehrecke EH. Autophagy in cell life and cell death. Curr Top Dev Biol. 2015;114:67‐91. [DOI] [PubMed] [Google Scholar]
- 29. Bhat TA, Chaudhary AK, Kumar S, et al. Endoplasmic reticulum‐mediated unfolded protein response and mitochondrial apoptosis in cancer. Biochim Biophys Acta. 2017;1867:58‐66. [DOI] [PMC free article] [PubMed] [Google Scholar]
- 30. Martinotti S, Ranzato E, Burlando B. (‐)‐ Epigallocatechin‐3‐gallate induces GRP78 accumulation in the ER and shifts mesothelioma constitutive UPR into proapoptotic ER stress. J Cell Physiol. 2018;233:7082‐7090. [DOI] [PubMed] [Google Scholar]
- 31. Lebeau J, Saunders JM, Moraes VWR, et al. The PERK arm of the unfolded protein response regulates mitochondrial morphology during acute endoplasmic reticulum stress. Cell Rep. 2018;22:2827‐2836. [DOI] [PMC free article] [PubMed] [Google Scholar]
- 32. Rodriguez D, Rojas‐Rivera D, Hetz C. Integrating stress signals at the endoplasmic reticulum: the BCL‐2 protein family rheostat. Biochim Biophys Acta. 2011;1813:564‐574. [DOI] [PubMed] [Google Scholar]
- 33. Li S, Zhang T, Xu W, et al. Sarcoma‐targeting peptide‐decorated polypeptide nanogel intracellularly delivers shikonin for upregulated osteosarcoma necroptosis and diminished pulmonary metastasis. Theranostics. 2018;8:1361‐1375. [DOI] [PMC free article] [PubMed] [Google Scholar]