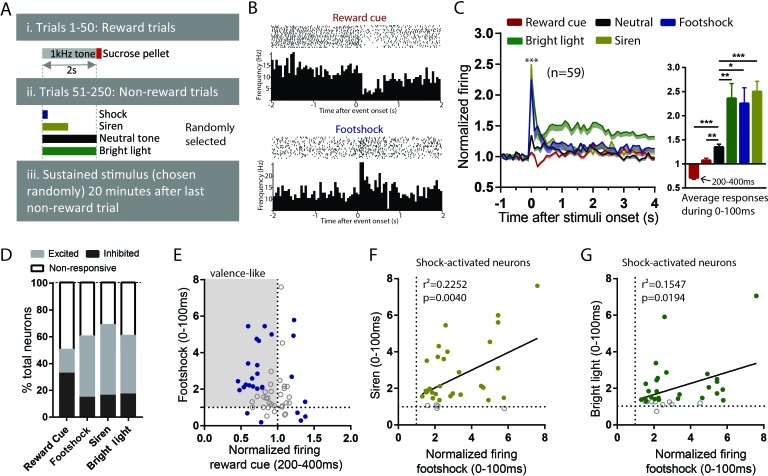
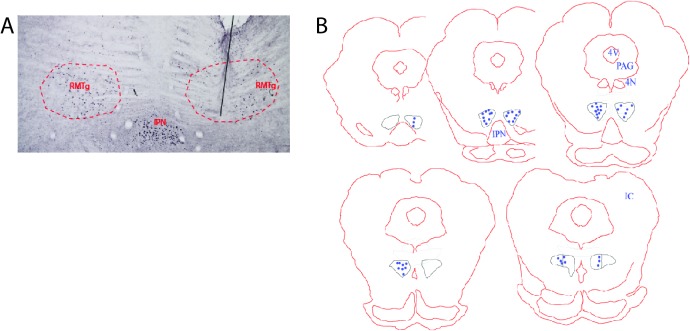
Figure 2. RMTg neurons are activated by diverse phasic aversive stimuli.
(A) Schematic of recording paradigm. (B) Raster plots of a representative RMTg neuron response to reward cues and footshocks. (C) RMTg neurons on average showed inhibition to reward-predictive cues during a 200–400 ms post-stimulus window, and small excitations to neutral tones and large excitations to footshock, siren, and bright light during a 0–100 ms post-stimulus windows. (D) Percentage of RMTg neurons that showed inhibition, excitation or no response to stimuli (200–400 ms window for reward cues, and 0–100 ms window for aversive or neutral stimuli). (E) Scatterplot of individual neurons’ responses to reward cues and footshocks. Many reward-cue inhibited neurons were also excited by footshocks, consistent with a valence-encoding pattern. Blue solid dots: neurons significantly responding to both reward cues and footshocks. Gray shaded box: neurons inhibited by reward cues and excited by footshocks, consistent with hypothesized valence-encoding. (F, G) RMTg neurons activated by footshocks tended to also be activated by siren and bright light, in proportion to the magnitude of response to footshock. Solid dots: neurons significantly responding to siren and bright light. * indicates p < 0.05, ** p < 0.01, *** < 0.0001.


