

Abstract
Background:
The diagnosis of type 1 diabetes (T1D) in youth is often associated with diabetic ketoacidosis (DKA). We aimed to evaluate if the presence of DKA at diagnosis of T1D is associated with less favorable hemoglobin A1c (HbA1c) trajectories over time.
Methods:
The SEARCH for Diabetes in Youth study of 1396 youth aged <20 years with newly diagnosed T1D were followed for up to 13 [median 8 (IQR 6-9)] years post-diagnosis. Of these, 397 (28%) had DKA (bicarbonate level<15 mmol/l and/or pH<7.25 (venous) or <7.30 (arterial or capillary) or mention of DKA in medical records) at diabetes onset. Longitudinal HbA1c levels were measured at each follow-up visit (average number of HbA1c measures 3.4). A linear piecewise mixed effects model was used to analyze the effect of DKA status at diagnosis of T1D on long-term glycemic control, adjusting for age at diagnosis, diabetes duration at baseline, sex, race/ethnicity, household income, health insurance status, time-varying insulin regimen and glucose self-monitoring, study site, and baseline fasting C-peptide level.
Results:
At baseline, HbA1c levels were significantly higher in youth with T1D diagnosed in DKA versus those who were not (9.9%±1.5% vs. 8.5%±1.4%, respectively). After the first year with diabetes, there was a significant difference in the rate of change in HbA1c levels by DKA status: HbA1c was 0.16% higher each year in youth with DKA compared to those without (interaction p-value<.0001), after adjusting for aforementioned covariates.
Conclusion/interpretation:
DKA at T1D diagnosis is associated with worsening glycemic control over time, independent of demographic, socioeconomic and treatment-related factors and baseline fasting C-peptide.
Keywords: Diabetic ketoacidosis, glycemic control, type 1 diabetes
Introduction
Diabetic ketoacidosis (DKA) is often the presenting and life threatening acute complication of newly diagnosed type 1 diabetes in youth1,2. The SEARCH for Diabetes in Youth (SEARCH) study previously reported that one in three U.S. youth with type 1 diabetes is diagnosed with DKA, and this proportion has not declined throughout the first decade of the 21st century1. Moreover, individuals diagnosed at a younger age, of Hispanic or non-Hispanic black race/ethnicity, from families with lower household income, and lack of private health insurance are more likely to experience DKA at onset of diabetes1.
The presence of DKA at onset of type 1 diabetes is associated with devastating immediate consequences such as increased mortality risk, but also longer hospitalizations, higher insulin requirements and a shorter remission period3-5. Presentation in DKA is thought to reflect more advanced pancreatic β-cell destruction during the pre-clinical evolution of the disease6. Importantly, youth participating in longitudinal studies that screen for genetic risk markers and islet autoantibodies, such as The Environmental Determinants of Diabetes in the Young (TEDDY) and Diabetes Autoimmunity Study in the Young (DAISY), have lower prevalence of DKA compared to youth in the general population diagnosed with type 1 diabetes7,8. It is believed that such youth screened for pre-clinical markers of type 1 diabetes are diagnosed at an earlier stage of disease, likely with higher residual insulin secretion9. While greater residual insulin secretion is associated with more favorable short-term clinical outcomes in individuals with type 1 diabetes10-12, our knowledge of whether presence of DKA at diagnosis of type 1 diabetes influences long-term glycemic control in youth with type 1 diabetes is limited.
Poor long-term glycemic control is a strong predictor of life-long chronic complications including proliferative retinopathy13, diabetic kidney disease14, and cardiovascular disease15,16, and adequate glycemic control is difficult to achieve, despite therapeutic advances17. A recent study in Colorado found a detrimental effect of DKA at diagnosis of type 1 diabetes in children on overall hemoglobin A1c (HbA1c) levels, an effect that was sustained for the following 15 years and was independent of socio-demographic factors18. In addition to replicating this finding, we tested the hypothesis that presence of DKA at diagnosis of type 1 diabetes in youth results not only in increased overall HbA1c levels, but also in a worse HbA1c trajectory (or rate of change) over time. Furthermore, we also assessed whether the effect of DKA on long-term HbA1c trajectory was related to lower residual insulin secretion at onset of diabetes.
Methods
Overview
Data for these analyses derive from the SEARCH for Diabetes in Youth prospective cohort study. A detailed description of SEARCH study methods has been published previously19. The SEARCH study has been conducting population-based ascertainment of youth and young adults with newly diagnosed diabetes when <20 years of age, starting in 2002 and ongoing. SEARCH recruited participants from four geographically defined populations in the U.S. (Ohio, Colorado, South Carolina and Washington) and also Indian Health Service beneficiaries from selected American Indian populations, and from enrollees in a managed healthcare plan (Kaiser Permanente) in Southern California19. Participants with newly diagnosed diabetes in 2002-2006 and 2008 were invited to participate in a baseline research visit, which occurred, on average, 9.3 months [SD, 6.4 months] after diagnosis, several follow-up visits centered around 12, 24 and 60 months after the initial baseline visit, and a final visit between 2011 and 2015 (mean of 7.9 years [SD, 1.9 years] from diagnosis20. The study was reviewed and approved by local Institutional Review Board(s) that had jurisdiction over the local study population and all participants provided written informed consent and/or assent.
Type of diabetes
Diabetes type was defined using an etiological classification21 based on one or more positive diabetes autoantibodies and estimated insulin sensitivity score which were validated against hyperinsulinemic-euglycemic clamps at baseline. Type 1 diabetes was defined as at least one positive antibody, regardless of insulin sensitivity, or no positive antibodies and an insulin sensitivity score ≥8.1520.
Study participants
The eligible study population for this report consisted of all SEARCH participants who were diagnosed in 2002-2006 and 2008, had a baseline visit and a diagnosis of type 1 diabetes as described above, and at least two follow-up HbA1c levels (n=2206). DKA status was missing among 810 of those participants, resulting in a final sample size 1396 youth. The sample was followed for up to 13 [median 8 (IQR 6-9)] years post-diagnosis, with an average number of 3.4 HbA1c measurements (on average 2.9 after the first year post-diabetes onset). The number of HbA1c measures over time did not differ by DKA status (DKA 3.3±1.0 vs. no DKA 3.4±1.1, p=0.26). There were no significant differences in age, sex, race/ethnicity, household income, health insurance status, insulin regimens, or glucose meter use between participants excluded from the analysis due to missing data and those who were not (data not shown).
Data collection
At each research visit fasting blood samples were obtained and medications, including short-acting insulin, were withheld the morning of the visit. Physical measurements were conducted and questionnaires were administered by trained research personnel. For race and ethnicity, US census methods22 were used that provide a series of fixed race and ethnicity categories, as well as an “other” option for the self-reported race/ethnicity. These were further categorized into non-Hispanic white and groups comprised of those of minority race/ethnicity, including Hispanic (regardless of race),non-Hispanic black, and non-Hispanic and of another race (“other”). Parental education level, household income, health insurance status, insulin regimen and blood glucose self-monitoring use were self-reported. Health insurance status was categorized as private, Medicare/Medicaid, self-pay and other; we did not combine the ‘other’ and ‘self-pay’ categories as we felt they represent two distinct groups (individuals who have insurance (just not private or Medicaid/Medicare) and individuals who do not have insurance at all).
Laboratory measures
At the baseline visit, specimens were analyzed for autoantibodies to glutamate decarboxylase (GADA) and insulinoma-associated-2 autoantibodies (IA-2A) at the central laboratory19 (Northwest Lipid Metabolism and Diabetes Research, Seattle, WA). Zinc transported eight autoantibodies (ZnT8A) were analyzed at the Eisenbarth laboratory (University of Colorado, Aurora, CO)23. Levels of fasting C-peptide (FCP) were determined by a two-site immunoenzymetric assay (Tosoh 1800; Tosoh Bioscience) with a sensitivity of 0.05 ng/ml24. HbA1c levels were measured at baseline and at each subsequent study visit by a dedicated ion-exchange high-performance liquid chromatography instrument (Tosoh Bioscience, San Francisco, CA)17. DKA at onset of diabetes was considered to be present if, in the context of hyperglycemia, any of the following were present: a blood bicarbonate level <15 mmol/L, and/or a pH < 7.25 (venous) or <7.30 (arterial or capillary), and/or a DKA diagnosis mentioned in the medical records1.
Statistical analysis
Baseline characteristics were compared between youth who presented in DKA and those who were not using t-tests for continuous variables and X2 test for categorical variables. Tests of normality were conducted with the Kolmogorov-Smirnov and Shapiro-Wilks tests. Variables that were positively skewed were natural log-transformed for analyses or nonparametric analogs were used. Pearson correlation coefficients were used to examine the correlation and covariance matrices for the repeated measures of HbA1c levels over time.
The relationship between DKA status at diabetes diagnosis and HbA1c levels over time (diabetes duration) was modeled using a piecewise linear mixed effects model with a knot at 1 year of diabetes duration. A knot was placed at year 1 because in many patients, the clinical course of type 1 diabetes during the first year is characterized by residual endogenous insulin secretion (the remission phase)4,25,26 and thus does not accurately represent the trajectory of long-term glycemic control. Random intercepts and slopes accounted for potential correlation of repeated measures on the same individual. Fixed effects included time (diabetes duration), DKA status at baseline, as well as an interaction term between DKA status and diabetes duration. The interaction term was included in order to explore whether differences in the slope of HbA1c levels changed over time as a function of DKA status. Models were adjusted for age at diagnosis, diabetes duration at baseline, sex, race/ethnicity, household income, health insurance status, time-varying insulin regimen and glucose self-monitoring, study site, and baseline fasting C-peptide level. Two separate models were developed, with and without adjusting for baseline fasting C-peptide, in order to assess the impact of baseline fasting C-peptide on the association of DKA status at diagnosis and long-term glycemic control; all other covariates listed previously remained in the model. All models were assessed for effect modification by race/ethnicity and age and the estimates were reported for a 1 unit change (equivalent to a 1% change) in HbA1c.
Model assumptions, such as a normally distributed outcome measure, were checked. Transformed residuals, using Cholesky decomposition technique, were examined to assess the adequacy of the fitted model and to look for any indication of outliers. Since the mixed model analyses assume data are missing at random, the missing data pattern was checked and the assumption was verified by plotting the means over time stratified by time of the last measure completed. For all analyses a p-value of <0.05 was considered statistically significant. The statistical analyses were performed using SAS software, version 9.3 (SAS Institute Inc., Cary, NC, USA).
Results
At the time of type 1 diabetes diagnosis, 28% (397/1396) of youth presented in DKA. The characteristics of the study population at the baseline visit stratified by DKA status are shown in Table 1. There were no significant differences in sex distribution or age at diagnosis between the two groups, although, by design, duration of diabetes at the baseline research visit was slightly longer in youth diagnosed in DKA. Youth who presented in DKA were more likely to be of minority race/ethnicity, to be uninsured or have government subsidized health insurance, and to have lower household income compared to youth without DKA at diagnosis. Baseline fasting C-peptide levels were lower (0.4 ng/dL vs 0.5 ng/mL), and baseline HbA1c levels higher (9.9% vs. 8.5%) in youth with DKA at diagnosis versus those without DKA.
Table 1:
Characteristics of youth with type 1 diabetes at baseline SEARCH visit, according to DKA status at diagnosis
| Variable | Missing | DKA (n=397) |
No DKA (n=999) |
p-value |
|---|---|---|---|---|
| Age at diagnosis (years) | 0 (0%) | 9.3 ± 3.9 | 9.4 ± 4.1 | 0.75 |
| Sex (female) | 0 (0%) | 198 (50%) | 471 (47%) | 0.36 |
| Race/Ethnicity | 0 (0%) | 0.005 | ||
| Non-Hispanic white | 287 (72%) | 802 (80%) | ||
| Non-Hispanic black | 46 (12%) | 86 (9%) | ||
| Hispanic | 50 (12%) | 96 (10%) | ||
| Other | 14 (4%) | 15 (1%) | ||
| Household Income | 94 (7%) | <.0001 | ||
| <$25K | 64 (18%) | 121 (13%) | ||
| $25-49K | 108 (30%) | 185 (20%) | ||
| $50-74K | 67 (18%) | 212 (22%) | ||
| $75K+ | 124 (34%) | 421 (45%) | ||
| Health Insurance Status | 10 (1%) | 0.001 | ||
| Private | 291 (74%) | 822 (82%) | ||
| Medicaid/Medicare | 82 (21%) | 148 (15%) | ||
| Self-pay | 11 (3%) | 9 (1%) | ||
| Other | 7 (2%) | 16 (2%) | ||
| Insulin Regimen | 59 (4%) | 0.17 | ||
| Injectable Insulin | 353 (93%) | 867 (90%) | ||
| Pump | 26 (7%) | 91 (10%) | ||
| Frequency of Glucose Monitoring | 59 (4%) | 0.08 | ||
| 4 or more times a day | 329 (86%) | 845 (88%) | ||
| 1-3 times a day | 45 (12%) | 108 (11%) | ||
| Less than once a day | 6 (2%) | 4 (1%) | ||
| Duration of diabetes at baseline (months) | 0 (0%) | 9.7 ± 6.1 | 9.0 ± 6.2 | 0.05 |
| Fasting C-peptide (ng/mL)a | 14 (1%) | 0.4 (0.2-0.9) | 0.5 (0.2-1.0) | 0.03 |
| Baseline HbA1c (%) | 7 (0.5%) | 9.9 ± 1.5 | 8.5 ± 1.4 | <.0001 |
| Number of HbA1c measures over time | 3.3 ± 1.0 | 3.4 ± 1.1 | 0.26 | |
| Follow-up time (months of diabetes duration) | 97.1 ± 29.6 | 97.0 ± 29.7 | 0.98 | |
Data are presented as mean ± SD and comparisons made using the unpaired Students t-test.
Categorical data are presented as number (%) and comparisons made using a chi-square test.
aData are presented as median (IQR) comparisons made using the Wilcoxon rank-sum test.
DKA = diabetic ketoacidosis. HbA1c = hemoglobin A1c
Table 2 shows the results of the multivariate piecewise linear mixed effects model examining the effects of DKA at diagnosis of diabetes and other risk factors on HbA1c levels over time. In Model 1, the significant interaction term between DKA status and diabetes duration after the first year indicates a difference in the rate of change in glycemic control: for each additional year with diabetes, youth diagnosed in DKA had 0.18 unit higher HbA1c levels than those without DKA (p<.0001). These associations were independent of age at diagnosis, sex, race/ethnicity, household income, health insurance status, time varying insulin regimens and glucose self-monitoring activities, study site, and diabetes duration at baseline (Model 1). When baseline fasting C-peptide was also added (Model 2) the difference in HbA1c levels per year between the two groups (DKA at onset versus not) does not change substantially (0.16 units higher HbA1c levels per year in youth with DKA compared to those without DKA and this remains statistically significant; p<.0001).
Table 2:
Results of the piecewise linear mixed effects model examining effects of DKA at diagnosis of diabetes and other risk factors on HbA1c levels over time
| Variable | Model 1 Estimate (SE) |
p-value | Model 2 Estimate (SE) |
p-value |
|---|---|---|---|---|
| Age at Diagnosis (per 1 year) | −0.01 (0.008) | 0.24 | −0.01 (0.008) | 0.91 |
| Sex (female vs male) | 0.11 (0.06) | 0.08 | 0.12 (0.06) | 0.05 |
| Race/Ethnicity | ||||
| Non-Hispanic white | Ref | − | Ref | − |
| Non-Hispanic black | 0.72 (0.12) | <.0001 | 0.78 (0.12) | <.0001 |
| Hispanic | 0.31 (0.12) | 0.01 | 0.35 (0.12) | 0.005 |
| Other | 0.20 (0.23) | 0.38 | 0.19 (0.23) | 0.40 |
| Household Income | ||||
| <$25K | Ref | − | Ref | − |
| $25-49K | −0.04 (0.12) | 0.74 | −0.05 (0.12) | 0.69 |
| $50-74K | −0.02 (0.14) | 0.90 | −0.05 (0.13) | 0.70 |
| $75K+ | −0.32 (0.13) | 0.02 | −0.35 (0.13) | 0.01 |
| Insurance Status | ||||
| Private | Ref | − | Ref | − |
| Medicaid/Medicare | 0.35 (0.12) | 0.004 | 0.32 (0.12) | 0.007 |
| Self-pay | 0.17 (0.28) | 0.54 | 0.26 (0.29) | 0.37 |
| Other | −0.07 (0.24) | 0.79 | −0.05 (0.24) | 0.85 |
| Insulin Regimen (time varying) | ||||
| Injectable Insulin | Ref | − | Ref | − |
| Pump | −0.16 (0.07) | 0.01 | −0.15 (0.07) | 0.02 |
| Frequency of Glucose Monitoring (time varying) | ||||
| 4 or more times a day | Ref | − | Ref | − |
| 1-3 times a day | 0.49 (0.06) | <.0001 | 0.49 (0.06) | <.0001 |
| Less than once a day | 0.93 (0.20) | <.0001 | 0.94 (0.20) | <.0001 |
| Baseline Fasting C-Peptide (per ng/mL) | − | − | −0.18 (0.05) | <.0001 |
| Rate of Change per Year in HbA1c <1 Year Diabetes Duration | ||||
| DKA Status (yes vs no) | −1.31 (0.81) | 0.11 | −1.33 (0.80) | 0.09 |
| Rate of Change per Year in HbA1c 1+ Years Diabetes Duration | ||||
| DKA Status (yes vs no) | 0.18 (0.01) | <.0001 | 0.16 (0.02) | <.0001 |
A linear mixed effects model examining the relationship between DKA status at baseline and change in HbA1c levels over the 9 year study. Models were additionally adjusted for duration of diabetes at baseline visit and study site. Model 1 unadjusted for baseline fasting C-peptide. Model 2 adjusted for baseline fasting C-peptide level. DKA = diabetic ketoacidosis; HbA1c = hemoglobin A1c; SE = standard error; T1D = type 1 diabetes.
In the fully adjusted model, we also examined the other factors associated with overall HbA1c levels over time, independent of DKA status (Table 2, Model 2). In this model, HbA1c levels over the entire range of diabetes duration were overall 0.35 units higher among Hispanics and 0.78 units higher among non-Hispanic blacks, compared to non-Hispanic white youth. HbA1c levels were 0.35 units lower in youth from households with incomes higher than $75,000 compared to households with less than $25,000; and 0.32 units higher in youth with government subsidized health insurance compared to those with private insurance. We also found a marginally significant association of 0.12 unit higher overall HbA1c levels in females compared to males. When examining factors related to clinical diabetes management, we found that overall HbA1c levels were higher with decreasing frequency of glucose testing at baseline and remained throughout the entire follow-up period in both youth diagnosed in DKA and those who were not (0.94 units higher for less than once a day and 0.49 units higher for 1-3 times a day compared to 4+ times a day, respectively). HbA1c levels were 0.15 units lower in youth who used a pump as compared to those who used injectable insulin. Finally, overall HbA1c levels were 0.18 units lower for every 1 ng/mL increase in baseline fasting C-peptide, after controlling for DKA status at diagnosis.
The predicted mean HbA1c levels over the study period by DKA status are presented in Figure 1. For both groups, as expected, there was a large reduction in HbA1c levels the first year post type 1 diabetes diagnosis followed by an increase in HbA1c levels over time. After the first year with diabetes, the mean difference in HbA1c levels between the two groups increased over time, from 0.12 units at one year to 1.18 units at 9 years of follow-up.
Figure 1: Model-based HbA1c levels over time according to DKA status at diagnosis with Type 1 Diabetes.
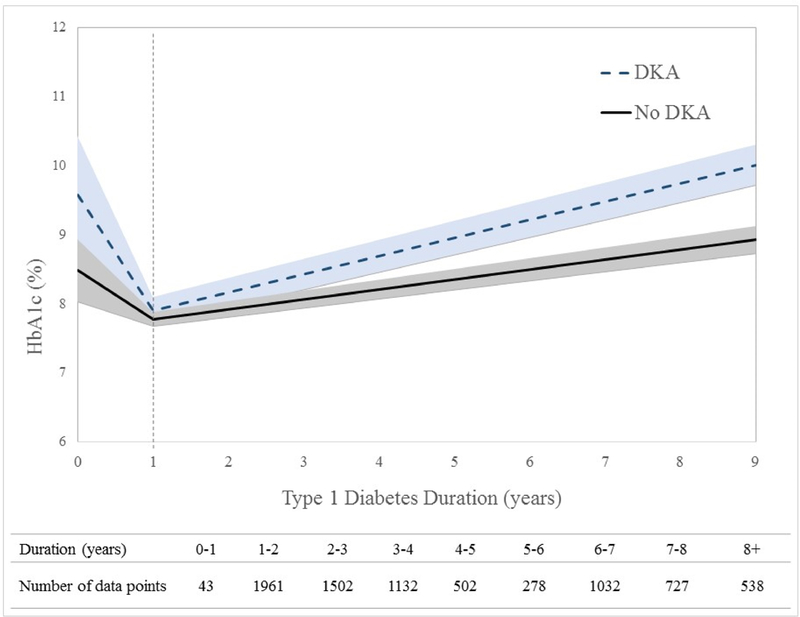
Data from piecewise linear mixed effects model with knot at 1 year diabetes duration (time 0 = diagnosis of type 1 diabetes). Time, as measured by diabetes duration, was assessed as a continuous variable and the shaded region corresponds to the 95% confidence interval. The number of data points contributing to each 1-year time interval are displayed in the table below the figure. Data are shown for up to 9 years post-diagnosis (the upper limit of the interquartile range).
Model adjusted for: age at diagnosis, diabetes duration at baseline, sex, race/ethnicity, household income, insurance status, time varying insulin regimen and glucose self-monitoring, study site, and baseline fasting C-peptide. P-value <.0001 for the difference in slopes after year 1 between youth diagnosed with diabetes in DKA compared to those who were not. Predicted mean levels of HbA1c for youth presenting in DKA at diagnosis versus those who did not are: Year 1: 7.90% vs. 7.78%; Year 5: 9.21% vs. 8.59%; Year 9: 10.07% vs 8.89%, respectively. DKA = diabetic ketoacidosis; HbA1c = hemoglobin A1c; T1D = type 1 diabetes.
Discussion
We found that DKA at diagnosis of type 1 diabetes is associated with overall worse glycemic control (higher overall HbA1c levels), but also with a worsening glycemic trajectory after the first year of disease. These associations were independent of demographic (sex, race/ethnicity and age at diagnosis), socioeconomic (household income and insurance status), treatment related factors (frequency of glucose monitoring and insulin regimen), and residual insulin secretion around the time of diagnosis, all of which are associated with both presence of DKA and long-term glycemic control. Our data provide strong and novel evidence that DKA at onset of type 1 diabetes is not just an acute complication but also a risk factor for long-term worsening glycemic control.
There are a number of cross-sectional studies examining differences in HbA1c levels between youth with and without DKA at diabetes onset, but few prospective studies exist. A recent study performed at the Barbara Davis Center for Diabetes in Colorado among 3364 youth (average age of 9 years at baseline) reported a sustained negative effect of DKA at diagnosis of type 1 diabetes on HbA1c levels during 15 years of follow up18. However, this study did not assess whether DKA at onset was associated with a worse HbA1c trajectory over time. Our findings substantially extend upon these observations by providing evidence that the effect of DKA at type 1 diabetes diagnosis on long-term HbA1c increases with duration of diabetes. Additionally, in our study, this relationship was independent of clinical management factors (diabetes treatment and glucose monitoring over time), suggesting that the effect of DKA at onset of diabetes on the trajectory of glycemic control is profound and likely not easily rectified with more intensive clinical care. Finally, our study shows that this association is not completely due to lower residual insulin secretion around the time of the baseline study visit, an average of 9.3 months [SD 6.4 months] after diabetes diagnosis. This is a novel and somewhat unexpected finding, which suggests that the effect of DKA at onset on long-term glycemic control operates through mechanisms that are in addition to those related to lower residual insulin secretion. This finding warrants further investigation.
Higher insulin requirements4 and worse glycemic control27 during the following 1-2 years have also been shown in children with DKA at presentation compared with those diagnosed with milder symptoms. DanDiabKids, a Danish national diabetes registry for children, found presence of DKA at diabetes onset in 18% of their type 1 diabetic youth; compared with 28% in our study. When examining long-term glycemic control they found 0.24 unit higher HbA1c levels over the 2 year study period for children diagnosed in DKA compared to controls27. Again, our observations extend upon these findings with longer follow-up time and ability to assess the trajectory of glycemic control over time. The DanDiabKids study also showed that pump use was associated with improvement in glycemic control over time reversing the effect of DKA at onset27. In contrast, in our study, adjustment for changes in insulin regimens over time did not influence the effect of DKA at onset on poor glycemic control over time.
Our study identified other predictors of higher HbA1c levels over time, independent of DKA status, including being of Hispanic or non-Hispanic black race/ethnicity, injectable insulin regimens (compared to pump use), less frequent glucose monitoring, being on Medicaid/Medicare insurance (compared to private health insurance) and lower fasting C-peptide levels at baseline. These results highlight socio-demographic and clinical management factors, other than DKA, that can be targeted to reduce poor long-term glycemic control and are consistent with findings previously reported18. All these factors have been shown to affect psychosocial contributors of poor glycemic control in youth with type 1 diabetes - likely exaggerating the detrimental effect28.
Several studies have demonstrated that the influence of poor glycemic control on risk for diabetes-related chronic complications is evident early during the course of the disease and persists for many years15,29. High HbA1c levels in the first five years of childhood onset of type 1 diabetes predicts microalbuminuria30 and retinopathy later in life31. The Diabetes Control and Complications Trial (DCCT) demonstrated that mean HbA1c levels during the trial were the strongest predictors of retinopathy progression, and that even what may seem like minimal changes in HbA1c actually translate into large reductions in the risk for disease development29. Specifically, the DCCT study found a 73% risk reduction for progression of retinopathy in the intensive therapy compared with the conventional therapy group, after adjusting for retinopathy level on entry and pre-DCCT level of hyperglycemia32. Furthermore, in DCCT, virtually all of the treatment effect on retinopathy progression was explained by a reduction in HbA1c levels comparable to the difference in HbA1c levels by DKA status observed in our study at 9 years duration.
The current study has inherent limitations and strengths. We were unable to explore psychological factors that may impact adherence to treatment especially during the transition into adolescence; however, we controlled for frequency of glucose monitoring as proxy. In addition, we were unable to explore general health awareness of study participants that may influence both diagnosis of DKA at diabetes onset as well as the number of study visits an individual may have participated in. For ~50% of participants only two time points were used to assess long-term glycemic control, though this did not differ by DKA status This study, however, has several important strengths. The study population was drawn from what is, to our knowledge, the largest multi-ethnic population-based registry of pediatric diabetes in the U.S., and has similar demographic and clinical characteristics to the overall population from which it draws33. HbA1c levels were measured during research visits, with standardized protocols, for up to 13 years after diagnosis, allowing for the determination of the relationship between DKA at onset and long-term glycemic control.
In summary, we found that presence of DKA at type 1 diabetes diagnosis is associated with worsening glucose control trajectories over time, independent of demographic, socioeconomic and diabetes treatment-related factors, as well as independent of residual insulin recreation around the time of diagnosis. To the extent that this association is further confirmed as causal, efforts to prevent DKA are warranted, as they may translate into improved glycemic control over time, which, in turn, may reduce the burden of diabetes-associated morbidity and mortality.
Acknowledgements:
The authors thank the SEARCH study investigators and participants for their valuable contributions. LMD researched data, analyzed data, and wrote the manuscript. DD, EMD, GI, CP, SS designed the study, helped with data acquisition, and contributed to the interpretation of results. DD and BAR helped with drafting of the manuscript. All authors critically reviewed the manuscript. All authors gave final approval of the version to be published. DD is the guarantor of this work, she had full access to the data and takes responsibility for the integrity of the data and accuracy of this analysis.
Funding Information: The SEARCH for Diabetes in Youth Cohort Study (1UC4DK108173) is funded by the National Institutes of Health (NIH), National Institute of Diabetes and Digestive and Kidney Diseases and supported by the Centers for Disease Control and Prevention (CDC). The Population Based Registry of Diabetes in Youth Study (1U18DP006131, U18DP006133, U18DP006134, U18DP006136, U18DP006138, U18DP006139) is funded by the CDC and supported by the NIH, National Institute of Diabetes and Digestive and Kidney Diseases.
Sites: Kaiser Permanente Southern California (U18DP006133, U48/CCU919219, U01 DP000246, and U18DP002714), University of Colorado-Denver (U18DP006139, U48/CCU819241-3, U01 DP000247, and U18DP000247-06A1), Cincinnati’s Children’s Hospital Medical Center (U18DP006134, U48/CCU519239, U01 DP000248, and 1U18DP002709), University of North Carolina at Chapel Hill (U18DP006138, U48/CCU419249, U01 DP000254, and U18DP002708), Seattle Children’s Hospital (U18DP006136, U58/CCU019235-4, U01 DP000244, and U18DP002710-01), and Wake Forest University School of Medicine (U18DP006131, U48/CCU919219, U01 DP000250, and 200-2010-35171).
Role of the Funder/Sponsor: Drs. Imperatore, and Saydah (CDC) were participating members of the study steering committee and the writing group for this manuscript because of the cooperative funding agreements. They were involved in the design of the study but not the conduct of the study; they were not involved in the collection, management, and analysis of the data, but were involved in interpretation of the data; they were involved in the preparation, review, and approval of the manuscript and the decision to submit the manuscript for publication.
SEARCH for Diabetes in Youth Research Group: California: Jean M. Lawrence, ScD, MPH, MSSA; Corinna Koebnick, PhD, MSc; Kristi Reynolds, PhD, MPH; Xia Li, MS; Eva Lustigova, MPH; and Kim Holmquist, BS, Certificate in Public Health for the Department of Research & Evaluation, Kaiser Permanente Southern California, Pasadena California, and David J. Pettitt, MD, Santa Barbara, California. Colorado: Dana Dabelea, MD, PhD, Richard F. Hamman, MD, DrPH, Lisa Testaverde, MS, Anna Bellatorre, PhD, for the Department of Epidemiology, Colorado School of Public Health, University of Colorado Denver, Georgeanna J. Klingensmith, MD, Marian J. Rewers, MD, PhD, David Maahs, MD and Paul Wadwa, MD for the Barbara Davis Center for Childhood Diabetes, Stephen Daniels, MD, PhD, Greta Wilkening, PsyD, Michael G. Kahn, MD, PhD, Department of Pediatrics and Children’s Hospital, Clifford A. Bloch, MD, for the Pediatric Endocrine Associates, Jeffrey Powell, MD, MPH, for the Navajo Area Indian Health Promotion Program, Kathy Love-Osborne, MD, for the Denver Health and Hospital Authority, and Diana C. Hu, MD for the Pediatrics Department, Tuba City Regional Health Care Center, Tuba City, AZ. Ohio: Lawrence M. Dolan, MD and Debra A. Standiford, MSN, CNP for the Cincinnati Children’s Hospital Medical Center. Carolinas: Elizabeth J. Mayer-Davis, PhD, Amy Mottl, MD, MPH, Joan Thomas MS, RD for the University of North Carolina, Chapel Hill, Christine Turley, Angela D. Liese, PhD, MPH, Malaka Jackson, MD, Lisa Knight, MD for the University of South Carolina, Deborah Bowlby, MD for the Medical University of South Carolina, James Amrhein, MD, Bryce Nelson, MD for Greenville Health System, and Eau Claire Cooperative Health Center. Washington: Catherine Pihoker, MD, Irl Hirsch, MD, Lenna L. Liu, MD, MPH, Maryam Afkarian, MD, Grace Kim, MD, Craig Taplin, MD, Faisal Malik, MD, MSHS, Angel Nip, MD, Joyce Yi-Frazier, PhD, Lina Merjaneh, MD, Davene Wright, PhD, and Alissa Roberts, MD for the University of Washington, Beth Loots, MPH, MSW, Natalie Beauregard, BA, Sue Kearns, RN, Mary Klingsheim, RN, Michael Pascual, BA and Cordelia Franklin, BS for Seattle Children’s Hospital, and Carla Greenbaum, MD for Benaroya Research Institute. Centers for Disease Control and Prevention: Giuseppina Imperatore, MD, PhD, Sharon H. Saydah, PhD. National Institute of Diabetes and Digestive and Kidney Diseases, NIH: Barbara Linder, MD, PhD. Central Laboratory: Santica M. Marcovina, PhD, ScD, Vinod P. Gaur, PhD, Greg Strylewicz, PhD, Alan Chait, MD and Jessica Harting for the University of Washington Northwest Lipid Research Laboratories. Coordinating Center: Ralph D’Agostino, Jr., PhD, Lynne E. Wagenknecht, DrPH, Jasmin Divers, PhD, Beth Reboussin, PhD, Elizabeth T. Jensen, PhD, Leora Henkin, MPH, MEd, Maureen T. Goldstein, BA, Carrie Williams, MA, CCRP, Scott Isom, MS, Jeanette Stafford, MS, Cynthia Suerken, MS, June Pierce, AB for Wake Forest School of Medicine.
Additional Contributions: We acknowledge the involvement of the Kaiser Permanente Southern California’s Clinical Research Center (funded by Kaiser Foundation Health Plan and supported in part by the Southern California Permanente Medical Group; South Carolina Clinical and Translational Research Institute at the Medical University of South Carolina, NIH/National Center for Advancing Translational Sciences (NCATS) grant UL1 TR001450; Seattle Children’s Hospital and the University of Washington, NIH/NCATS grant UL1 TR00423; University of Colorado Pediatric Clinical and Translational Research Center, NIH/NCATS grant UL1 TR000154; the Barbara Davis Center at the University of Colorado at Denver (Diabetes and Endocrinology Research Center NIH grant P30 DK57516); the University of Cincinnati, NIH/NCATS grant UL1 TR001425; and the Children with Medical Handicaps program managed by the Ohio Department of Health. This study includes data provided by the Ohio Department of Health, which should not be considered an endorsement of this study or its conclusions.
Abbreviations
- (DAISY)
Diabetes Autoimmunity Study in the Young
- (DKA)
Diabetic ketoacidosis
- (FCP)
Fasting C-peptide
- (GADA)
Glutamate decarboxylase
- (HbA1c)
Hemoglobin A1c
- (IA-2A)
Insulinoma-associated-2 autoantibodies
- (DCCT)
Diabetes Control and Complications Trial
- (TEDDY)
The Environmental Determinants of Diabetes in the Young
- (SEARCH)
The SEARCH for Diabetes in Youth study
- (ZnT8A)
Zinc transported eight autoantibodies
Footnotes
Disclosures: All authors have completed and submitted the ICMJE Form for Disclosure of Potential Conflicts of Interest. No potential conflicts of interest were disclosed.
Disclaimer: The findings and conclusions in this report are those of the authors and do not necessarily represent the official position of the CDC and the National Institute of Diabetes and Digestive and Kidney Diseases.
References
- 1.Dabelea D et al. Trends in the prevalence of ketoacidosis at diabetes diagnosis: the SEARCH for diabetes in youth study. Pediatrics 133, e938–945 (2014). [DOI] [PMC free article] [PubMed] [Google Scholar]
- 2.Rewers A et al. Presence of diabetic ketoacidosis at diagnosis of diabetes mellitus in youth: the Search for Diabetes in Youth Study. Pediatrics 121, e1258–1266 (2008). [DOI] [PubMed] [Google Scholar]
- 3.Dunger DB et al. European Society for Paediatric Endocrinology/Lawson Wilkins Pediatric Endocrine Society consensus statement on diabetic ketoacidosis in children and adolescents. Pediatrics 113, e133–140 (2004). [DOI] [PubMed] [Google Scholar]
- 4.Bowden SA, Duck MM & Hoffman RP Young children (<5 yr) and adolescents (>12 yr) with type 1 diabetes mellitus have low rate of partial remission: diabetic ketoacidosis is an important risk factor. Pediatr. Diabetes 9, 197–201 (2008). [DOI] [PubMed] [Google Scholar]
- 5.Böber E, Dündar B & Büyükgebiz A Partial remission phase and metabolic control in type 1 diabetes mellitus in children and adolescents. J. Pediatr. Endocrinol. Metab. JPEM 14, 435–441 (2001). [DOI] [PubMed] [Google Scholar]
- 6.Insel RA et al. Staging presymptomatic type 1 diabetes: a scientific statement of JDRF, the Endocrine Society, and the American Diabetes Association. Diabetes Care 38, 1964–1974 (2015). [DOI] [PMC free article] [PubMed] [Google Scholar]
- 7.Elding Larsson H et al. Reduced prevalence of diabetic ketoacidosis at diagnosis of type 1 diabetes in young children participating in longitudinal follow-up. Diabetes Care 34, 2347–2352 (2011). [DOI] [PMC free article] [PubMed] [Google Scholar]
- 8.Elding Larsson H et al. Children followed in the TEDDY study are diagnosed with type 1 diabetes at an early stage of disease. Pediatr. Diabetes 15, 118–126 (2014). [DOI] [PMC free article] [PubMed] [Google Scholar]
- 9.Steck AK et al. Residual beta-cell function in diabetes children followed and diagnosed in the TEDDY study compared to community controls. Pediatr. Diabetes 18, 794–802 (2017). [DOI] [PMC free article] [PubMed] [Google Scholar]
- 10.Vendrame F, Zappaterreno A & Dotta F Markers of beta cell function in type 1 diabetes mellitus. Minerva Med. 95, 79–84 (2004). [PubMed] [Google Scholar]
- 11.Steffes MW, Sibley S, Jackson M & Thomas W Beta-cell function and the development of diabetes-related complications in the diabetes control and complications trial. Diabetes Care 26, 832–836 (2003). [DOI] [PubMed] [Google Scholar]
- 12.Effect of intensive therapy on residual beta-cell function in patients with type 1 diabetes in the diabetes control and complications trial. A randomized, controlled trial. The Diabetes Control and Complications Trial Research Group. Ann. Intern. Med. 128, 517–523 (1998). [DOI] [PubMed] [Google Scholar]
- 13.Skrivarhaug T et al. Low cumulative incidence of proliferative retinopathy in childhood-onset type 1 diabetes: a 24-year follow-up study. Diabetologia 49, 2281–2290 (2006). [DOI] [PubMed] [Google Scholar]
- 14.Skrivarhaug T et al. Low risk of overt nephropathy after 24 yr of childhood-onset type 1 diabetes mellitus (T1DM) in Norway. Pediatr. Diabetes 7, 239–246 (2006). [DOI] [PubMed] [Google Scholar]
- 15.Stadler M et al. Long-term mortality and incidence of renal dialysis and transplantation in type 1 diabetes mellitus. J. Clin. Endocrinol. Metab. 91, 3814–3820 (2006). [DOI] [PubMed] [Google Scholar]
- 16.Giordano C et al. Predictors of microvascular complications in type 1 diabetic patients at onset: the role of metabolic memory. Eur. J. Intern. Med. 22, 266–274 (2011). [DOI] [PubMed] [Google Scholar]
- 17.Pihoker C et al. Insulin regimens and clinical outcomes in a type 1 diabetes cohort: the SEARCH for Diabetes in Youth study. Diabetes Care 36, 27–33 (2013). [DOI] [PMC free article] [PubMed] [Google Scholar]
- 18.Duca LM, Wang B, Rewers M & Rewers A Diabetic Ketoacidosis at Diagnosis of Type 1 Diabetes Predicts Poor Long-term Glycemic Control. Diabetes Care 40, 1249–1255 (2017). [DOI] [PubMed] [Google Scholar]
- 19.Hamman RF et al. The SEARCH for Diabetes in Youth study: rationale, findings, and future directions. Diabetes Care 37, 3336–3344 (2014). [DOI] [PMC free article] [PubMed] [Google Scholar]
- 20.Dabelea D et al. Association of Type 1 Diabetes vs Type 2 Diabetes Diagnosed During Childhood and Adolescence With Complications During Teenage Years and Young Adulthood. JAMA 317, 825–835 (2017). [DOI] [PMC free article] [PubMed] [Google Scholar]
- 21.Dabelea D et al. Etiological approach to characterization of diabetes type: the SEARCH for Diabetes in Youth Study. Diabetes Care 34, 1628–1633 (2011). [DOI] [PMC free article] [PubMed] [Google Scholar]
- 22.Ingram DD et al. United States Census 2000 population with bridged race categories. Vital Health Stat. 2 1–55 (2003). [PubMed] [Google Scholar]
- 23.Dabelea D et al. Development, validation and use of an insulin sensitivity score in youths with diabetes: the SEARCH for Diabetes in Youth study. Diabetologia 54, 78–86 (2011). [DOI] [PMC free article] [PubMed] [Google Scholar]
- 24.Dabelea D et al. Clinical evolution of beta cell function in youth with diabetes: the SEARCH for Diabetes in Youth study. Diabetologia 55, 3359–3368 (2012). [DOI] [PMC free article] [PubMed] [Google Scholar]
- 25.Mortensen HB et al. Multinational study in children and adolescents with newly diagnosed type 1 diabetes: association of age, ketoacidosis, HLA status, and autoantibodies on residual beta-cell function and glycemic control 12 months after diagnosis. Pediatr. Diabetes 11, 218–226 (2010). [DOI] [PubMed] [Google Scholar]
- 26.Fernandez Castañer M et al. Ketoacidosis at diagnosis is predictive of lower residual beta-cell function and poor metabolic control in type 1 diabetes. Diabetes Metab. 22, 349–355 (1996). [PubMed] [Google Scholar]
- 27.Fredheim S et al. Diabetic ketoacidosis at the onset of type 1 diabetes is associated with future HbA1c levels. Diabetologia 56, 995–1003 (2013). [DOI] [PubMed] [Google Scholar]
- 28.Delamater AM et al. ISPAD Clinical Practice Consensus Guidelines 2014. Psychological care of children and adolescents with type 1 diabetes. Pediatr. Diabetes 15 Suppl 20, 232–244 (2014). [DOI] [PubMed] [Google Scholar]
- 29.The relationship of glycemic exposure (HbA1c) to the risk of development and progression of retinopathy in the diabetes control and complications trial. Diabetes 44, 968–983 (1995). [PubMed] [Google Scholar]
- 30.Rudberg S, Ullman E & Dahlquist G Relationship between early metabolic control and the development of microalbuminuria--a longitudinal study in children with type 1 (insulin-dependent) diabetes mellitus. Diabetologia 36, 1309–1314 (1993). [DOI] [PubMed] [Google Scholar]
- 31.Svensson M, Eriksson JW & Dahlquist G Early glycemic control, age at onset, and development of microvascular complications in childhood-onset type 1 diabetes: a population-based study in northern Sweden. Diabetes Care 27, 955–962 (2004). [DOI] [PubMed] [Google Scholar]
- 32.Lachin JM et al. Effect of glycemic exposure on the risk of microvascular complications in the diabetes control and complications trial--revisited. Diabetes 57, 995–1001 (2008). [DOI] [PubMed] [Google Scholar]
- 33.Dabelea D et al. Prevalence of type 1 and type 2 diabetes among children and adolescents from 2001 to 2009. JAMA 311, 1778–1786 (2014). [DOI] [PMC free article] [PubMed] [Google Scholar]