

Abstract
Background:
Recent studies have suggested that vectorcardiographic measures predict left ventricular (LV) reverse remodeling and clinical outcome in patients receiving cardiac resynchronization therapy (CRT).
Objective:
To compare predictive abilities of different vectorcardiographic measures (QRS area and sum absolute QRS-T integral) and transformation methods (Kors and inverse Dowers), and to assess the independent association between the best predictor and outcomes in CRT recipients.
Methods:
Retrospective study including CRT recipients with a digital baseline electrocardiogram, QRS duration ≥120 ms, and ejection fraction ≤35%. The end point was a composite of heart transplantation, LV assist device implant, or death. Analyses were performed for the overall cohort and for a pre-specified subgroup of left bundle branch block (LBBB) patients.
Results:
Of 705 included patients with mean age of 66.6 years, 70% were males, 53% had ischemic heart disease, and 66% had LBBB. QRS area from vectorcardiograms derived via the Kors transformation demonstrated the best predictive value. In multivariable Cox regression, patients with a smaller QRS area (≤ 95 μVs) had an increased hazard in the overall cohort (adjusted hazard ratio: 1.65, p<0.001) and in the LBBB subgroup (adjusted hazard ratio: 1.95, p<0.001). QRS area was associated with outcome in patients with QRS duration ≥150 ms (unadjusted hazard ratio: 3.85, p<0.001), and in patients with QRS duration >150ms (unadjusted hazard ratio: 1.76, p<0.001).
Conclusion:
Vectorcardiographic QRS area is associated with survival free from heart transplantation and LV assist device implantation in CRT recipients.
Keywords: Cardiac resynchronization therapy, Heart failure, Vectorcardiography, QRS area, Sum absolute QRS-T integral, Left bundle branch block, QRS prolongation
Introduction
Although cardiac resynchronization therapy (CRT) has been an established treatment for patients with prolonged QRS duration and heart failure for several years,1–3 a substantial proportion of patients do not benefit from the treatment.4,5 In current guidelines, QRS morphology and duration are the two surrogates of dyssynchrony used for patient selection.6 Recently, two different vectorcardiographic measures of dyssynchrony have been proposed, namely QRS area and sum absolute QRS-T integral (SAI QRS-T), and these have been shown to identify delayed activation of the left ventricular (LV) lateral wall, predict echocardiographic response to CRT, and in a small, retrospective cohort study to predict survival following CRT.7–10 Currently, there are no published comparisons of these two vectorcardiographic measures or the different matrices (the Kors matrix and the inverse Dower matrix) used for the derivation of the vectorcardiogram from the digital 12-lead electrocardiogram (ECG).11,12
The objective of this study was to compare the predictive abilities of the two different vectorcardiographic measures and the two transformation matrices, and to assess the association between the best predictor and long-term outcome in CRT recipients.
Methods
This was a retrospective cohort study performed at Duke University Medical Center. The study was approved by the Duke Institutional Review Board and complies with the Declaration of Helsinki.
Study population
All patients who received a CRT with defibrillator from April 2006 to September 2015 were identified using an institutional dataset prepared for the National Cardiovascular Data Registry. We included patients who received a de novo CRT due to symptomatic heart failure with a LV ejection fraction ≤35% and had an available ECG with QRS duration ≥120 ms within 180 days before CRT implantation. Patients were excluded if the LV lead could not be implanted, the patient demonstrated 2nd or 3rd degree atrioventricular or had missing follow-up data.
Electro- and vectorcardiographic analyses
The ECG most proximal to CRT implantation was reanalyzed in the GE MUSE Cardiology Information System version 8.0.2.10132 with 12SL analysis software version 241 (GE Healthcare, Milwaukee, WI, USA) and exported in Extensible Markup Language (XML) format. QRS morphology was designated by two readers (DF and KE) blinded to outcome. Left bundle branch block (LBBB) morphology was further divided into strict and non-strict LBBB using the criteria described by Strauss et. al.13 QRS onset and offset and thereby QRS duration as detected by the 12SL software were verified or manually corrected if needed.
Vectorcardiograms were derived from the XML files using customized MATLAB software (MathWorks, Inc., Natick, MA, USA) using both the inverse Dower and the Kors matrices.11,12 Using the median beat, the QRS area and SAI QRS-T were calculated as described previously by others.8,9 The QRS area was calculated as (QRSx2 + QRSy2 + QRSz2)1/2, with QRSx/y/z being the integral between the ventricular deflection and the baseline from the onset to the offset of the QRS complex in the x, y, and z leads, respectively (Figure 1A). SAI QRS-T was calculated as the sum of the absolute areas between the deflection and the baseline of the entire QRS-T waveform from the x, y, and z-leads (Figure 1B). Thus, a total of 4 vectorcardiographic measures were derived:
-
-
QRS area (Kors)
-
-
QRS area (inverse Dower)
-
-
SAI QRS-T (Kors)
-
-
SAI QRS-T (inverse Dower)
Figure 1. – Examples of calculation of QRS area and SAI QRS-T from the vectorcardiogram.

QRS area (A) is calculated using the integral between the deflection and baseline from the onset to the offset of the QRS complex. SAI QRS-T (B) is calculated as the sum of the orthogonal leads’ absolute area under the QRS complex and T-wave deflections. The vertical lines mark the on- and offsets of the QRS complex and the T-wave offset.
SAI QRS-T = sum absolute QRS-T integral.
End points
The study end point was a composite of heart transplantation, LV assist device implantation, or all-cause death. End point ascertainment was performed on May 24, 2017 via a query of the Duke Enterprise Data Unified Content Explorer by incorporating data from billing claims, hospital records, and the Social Security Death Index.14
Statistical analyses
Continuous, normally distributed variables are reported as means ± SD and differences were tested using the Student t-test, while non-normally distributed variables are reported as median (25th–75th percentile) and differences were tested using the Wilcoxon rank-sum test. Categorical variables were compared using Fisher’s exact test.
Time-dependent receiver operating characteristics (ROC) curves were created to assess the ability of the 4 vectorcardiographic measures to predict the occurrence of the study end point and the vectorcardiographic measurement with the greatest AUC at 3 years after CRT implantation was used for all subsequent analyses. The median value for the overall cohort was used to separate cohorts into two groups.
Kaplan-Meier plots were used to depict the cumulative hazard of the composite outcome and differences were assessed using log-rank statistics. Cox proportional hazard models were used for assessing univariable and multivariable predictors of the composite outcome. Multivariable models were adjusted for ischemic heart disease, QRS morphology, QRS duration <150 milliseconds, atrial fibrillation/flutter, and univariable predictors with a p-value <0.10. Proportional hazards assumptions were verified graphically using plots of Schoenfeld’s residuals. Sensitivity analysis with stepwise removal of the covariates in the model was performed. Analyses were performed for the overall cohort and for the pre-specified subgroups of patients with LBBB and non-LBBB QRS morphologies.
All statistical analysis was performed in RStudio version 1.1.423 (RStudio, Inc, Boston, MA, USA) running R version 3.3.2 (R Foundation for Statistical Computing, Vienna, Austria). The R packages “survival”15 and “timeROC”16 were used for survival analyses and time-dependent ROC curves. A two-sided p-value <0.05 was considered statistically significant.
Results
A total of 1001 patients underwent CRT implant at the Duke University Medical Center during the study period. After excluding patients with a missing baseline digital ECG (n=159), prior LV lead (n=12), QRS duration <120 ms (n=56), a LV ejection fraction that was >35% (n=17) or missing (n=7), a failed LV lead (n=8), 2nd/3rd degree AV block (n=34), or missing follow-up data (n=3), a total of 705 patients remained. Of the included patients, 492 (70%) were males, the mean age was 66.6±11.5 years, 374 (53%) had ischemic heart disease, 465 (66%) had LBBB, and the mean QRS duration was 163±27 ms (Table 1).
Table 1. –
Baseline characteristics for the overall cohort
| All (N = 705) | QRS area <95 μVs (n = 353) | QRS area >95 μVs (n = 352) | p-value | |
|---|---|---|---|---|
| Days from ECG to CRT† | 6(1–23) | 7(1–24) | 5(1–22) | 0.22 |
| Age, years | 66.6±11.5 | 66.4±10.9 | 66.7±12.2 | 0.76 |
| Male | 492 (70%) | 270 (76%) | 222 (63%) | <0.001 |
| Ischemic Heart Disease | 374 (53%) | 216 (61%) | 158 (45%) | <0.001 |
| LVEF, % | 24±7 | 24±7 | 24±7 | 0.69 |
| NYHA class III/IV | 584 (83%) | 309 (88%) | 275 (78%) | 0.001 |
| QRS duration, ms | 163±27 | 153±25 | 174±26 | <0.001 |
| QRS duration < 150 ms | 239 (34%) | 186 (53%) | 53 (15%) | <0.001 |
| QRS morphology | ||||
| Strict LBBB | 358 (51%) | 120 (34%) | 238 (68%) | <0.001 |
| Non-strict LBBB | 107 (15%) | 85 (24%) | 22 (6%) | <0.001 |
| RV paced | 119 (17%) | 38 (11%) | 81 (23%) | <0.001 |
| RBBB | 27 (4%) | 26 (7%) | 1 (< 1%) | <0.001 |
| RBBB + LAFB | 49 (7%) | 44 (12%) | 5 (1%) | <0.001 |
| RBBB + LPFB | 5 (1%) | 5 (1%) | 0 | 0.06 |
| IVCD | 40 (6%) | 35 (10%) | 5 (1%) | <0.001 |
| PR interval, ms | 186±40 | 193±44 | 179±34 | <0.001 |
| 1st degree AV block | 118 (17%) | 78 (22%) | 40 (11%) | <0.001 |
| Atrial fibrillation/flutter | 243 (34%) | 127 (36%) | 116 (33%) | 0.43 |
| Hypertension | 513 (73%) | 259 (73%) | 254 (72%) | 0.74 |
| Diabetes | 266 (38%) | 144 (41%) | 122 (35%) | 0.10 |
| Cerebrovascular disease | 89 (13%) | 51 (14%) | 38 (11%) | 0.17 |
| Chronic lung disease | 151 (21%) | 83 (24%) | 68 (19%) | 0.20 |
| Creatinine, mg/dL† | 1.2 (1.0–1.6) | 1.3 (1.0–1.6) | 1.1 (0.9–1.4) | <0.001 |
| Creatinine > 1.2 mg/dL | 323 (46%) | 186 (53%) | 137 (39%) | <0.001 |
| ACE-inhibitor/ARB | 540 (77%) | 260 (74%) | 280 (80%) | 0.10 |
| Beta-blocker | 627 (90%) | 300 (86%) | 327 (93%) | 0.002 |
| Diuretics | 583 (84%) | 295 (85%) | 288 (82%) | 0.41 |
Median (25th–75th percentile), Wilcoxon rank sum test used for statistical testing.
ACE = angiotensin converting enzyme; ARB = angiotensin II-receptor blocker; AV = atrioventricular; CRT = cardiac resynchronization therapy; ECG = electrocardiogram; IVCD = non-specific interventricular conduction delay; LAFB = left anterior fascicular block; LBBB = left bundle branch block; LPFB = left posterior fascicular block; LVEF = left ventricular ejection fraction; NYHA = New York Heart Association; RBBB = right bundle branch block; RV = right ventricular.
Predictive ability of vectorcardiographic measurements
The Kors-derived QRS area predicted the probability of reaching the study end point 3 years after CRT implantation better than the inverse Dower-derived QRS area (AUC 0.645 vs 0.620, p=0.005), and the SAI QRS-T derived by either the Kors method (AUC 0.645 vs. 0.625, p=0.03) or the inverse Dower method (AUC 0.645 vs. 0.608, p=0.001) (Figure A.1). Based on these results, the Kors derived QRS area was used for all subsequent analyses.
Patient characteristics by QRS area
The median (25th–75th percentile) QRS area by the Kors method for the overall cohort was 95 (63–127) μVs. Patients with a QRS area ≤95 µVs were more often males with ischemic heart disease, more advanced New York Heart Association functional class, a longer PR interval, shorter QRS duration, higher serum creatinine, and were less likely to receive beta-blocker medication. Patients with a QRS area >95 µVs were more likely to have a strict LBBB or have right ventricular pacing, whereas all other QRS morphologies were more common in patients with a QRS area ≤95 µVs (Table 1).
Follow-up
Over a median follow-up of 3.1 years (1.8-5.4 years), 312 (44%) patients reached the study end point. The most common reason for reaching the end point was death (n=263, 37%) followed by LV assist device implantation (n=26, 4%) and heart transplantation (n=23, 3%). During follow-up, 194 (55%) patients with a QRS area ≤95 µVs experienced an end point, compared with 118 (34%) patients with a QRS area >95 µVs (Figure 2). QRS area was associated with the likelihood of reaching the study end point in both univariable (unadjusted hazard ratio: 2.11; 95% CI 1.68–2.65; p<0.001) and multivariable analyses adjusting for QRS duration and morphology, age, sex, ischemic heart disease, 1st degree atrioventricular block, atrial fibrillation/flutter, LV ejection fraction, New York Heart Association Functional Class, creatinine, cerebrovascular disease, chronic lung disease, angiotensin converting enzyme-inhibitor or angiotensin II-receptor blocker use, and beta-blocker use (adjusted hazard ratio: 1.65; 95% CI: 1.25–2.18; p<0.001) (Table 2).
Figure 2. – Kaplan-Meier plot of event-free survival for the overall cohort.

The curves are in relation to QRS area above (blue) or below (red) the median value (95 μVs). The hazard ratio is unadjusted.
CI = confidence interval; CRT = cardiac resynchronization therapy; LVAD = implantable left ventricular assist device.
Table 2. –
Association of QRS area and baseline variables to outcome in univariable and multivariable analyses for the overall cohort
| Univariable Cox Regression |
Multivariable Cox Regression |
|||||
|---|---|---|---|---|---|---|
| HR | 95% CI | p-value | HR | 95% CI | p-value | |
| Age, per 5-year increase | 1.05 | 1.00–1.10 | 0.05 | 0.98 | 0.93–1.04 | 0.54 |
| Male | 1.61 | 1.23 2.11 | <0.001 | 1.00 | 0.73–1.36 | 0.99 |
| Ischemic heart disease | 1.69 | 1.34 2.12 | <0.001 | 1.35 | 1.04–1.75 | 0.03 |
| QRS duration < 150 ms | 1.44 | 1.14–1.81 | 0.002 | 1.27 | 0.91–1.77 | 0.15 |
| QRS morphology | ||||||
| Strict LBBB | (1.00) | (1.00) | ||||
| Non-strict LBBB | 1.66 | 1.22–2.27 | 0.001 | 0.87 | 0.58–1.31 | 0.51 |
| RV paced | 1.49 | 1.10–2.02 | 0.01 | 1.17 | 0.82–1.67 | 0.38 |
| IVCD | 2.04 | 1.33–3.14 | 0.001 | 1.06 | 0.65–1.72 | 0.83 |
| RBBB + LAFB | 1.31 | 0.83–2.06 | 0.24 | 0.49 | 0.30–0.80 | 0.005 |
| RBBB + LPFB | 19.97 | 7.91–50.39 | <0.001 | 6.96 | 2.66–18.20 | < 0.001 |
| RBBB | 2.01 | 1.13–3.56 | 0.02 | 1.19 | 0.64–2.22 | 0.59 |
| 1st degree AV block | 1.63 | 1.24–2.13 | <0.001 | 1.79 | 1.33–2.41 | < 0.001 |
| Atrial fibrillation/flutter | 2.00 | 1.59–2.50 | <0.001 | 1.64 | 1.28–2.12 | < 0.001 |
| LVEF, per 5% increase | 0.91 | 0.84–0.99 | 0.03 | 0.91 | 0.83–1.00 | 0.05 |
| Hypertension | 1.13 | 0.87–1.45 | 0.36 | |||
| Diabetes | 1.18 | 0.94–1.48 | 0.15 | |||
| NYHA class III/IV | 1.90 | 1.28–2.82 | 0.001 | 1.49 | 0.99–2.26 | 0.06 |
| Creatinine > 1.2 mg/dL | 2.39 | 1.90–3.00 | <0.001 | 1.86 | 1.44–2.40 | < 0.001 |
| Cerebrovascular disease | 1.50 | 1.11–2.02 | 0.009 | 1.23 | 0.90–1.70 | 0.19 |
| Chronic lung disease | 1.72 | 1.35–2.20 | <0.001 | 1.39 | 1.07–1.80 | 0.01 |
| ACE-inhibitor/ARB | 0.44 | 0.34–0.56 | <0.001 | 0.57 | 0.44–0.74 | < 0.001 |
| Beta-blocker | 0.57 | 0.41–0.78 | <0.001 | 0.78 | 0.56–1.10 | 0.16 |
| Diuretics | 1.23 | 0.87–1.74 | 0.24 | |||
| QRS area < 95 μVs | 2.11 | 1.68–2.65 | <0.001 | 1.65 | 1.25–2.18 | < 0.001 |
ACE = angiotensin converting enzyme; ARB = angiotensin II-receptor blocker; AV = atrioventricular; IVCD = non-specific interventricular conduction delay; LAFB = left anterior fascicular block; LBBB = left bundle branch block; LPFB = left posterior fascicular block; LVEF = left ventricular ejection fraction; NYHA = New York Heart Association; RBBB = right bundle branch block; RV = right ventricular.
QRS area and outcomes among LBBB and non-LBBB subgroups
The median QRS area for the LBBB subgroup was 101 μVs, while it was 77 μVs for the non-LBBB subgroup (p<0.001). In the LBBB subgroup, 260 of the 465 (56%) patients had a QRS area >95 μVs. Baseline characteristics for the LBBB subgroup are described in Table A.1. Among patients with a QRS area ≤95 μVs, 109 (53%) reached the composite end point, compared to 77 (30%) patients with QRS area >95 μVs (unadjusted hazard ratio: 2.35; 95% CI: 1.75–3.15; p<0.001) (Figure 3A). In the adjusted model including the same covariates as the model for the overall cohort, QRS area remained significantly associated with composite outcome (adjusted hazard ratio: 1.95; 95% CI: 1.38–2.76; p<0.001) in patients with LBBB.
Figure 3. -. Kaplan-Meier plots of event-free survival for the LBBB (A) and non-LBBB (B) subgroups.
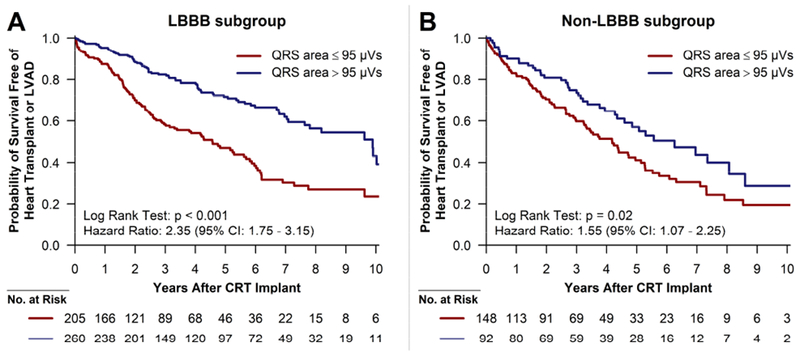
The curves are in relation to QRS area above (blue) or below (red) 95 μVs. The hazard ratios are unadjusted.
CI = confidence interval; CRT = cardiac resynchronization therapy; LBBB = left bundle branch block; LVAD = implantable left ventricular assist device.
Among patients without LBBB, a QRS area >95 μVs was much more common among patients with right ventricular pacing (68%, 81/119) compared to all other non-LBBB QRS morphologies (9%, 11/121). A QRS area ≤95 μVs was associated with the study outcome in univariable analysis (unadjusted hazard ratio: 1.55; 95% CI: 1.07–2.25; p=0.02) (Figure 3B). After adjusting for QRS duration and morphology, age, sex, ischemic heart disease, and atrial fibrillation/flutter, QRS area was not significantly associated with the study end point (adjusted hazard ratio: 1.50, 95% CI: 0.94–2.39, p=0.09) in patients without LBBB. Among the non-LBBB patients without right ventricular pacing, a QRS area <95 μVs demonstrated a non-significant association with worsened outcomes (unadjusted hazard ratio: 2.76; 95% CI: 0.86–8.80; p=0.09).
Outcome in relation to QRS area in combination with QRS duration
In patients with QRS duration <150 ms, 53 of 239 (22%) had a QRS area >95 μVs. In patients with QRS duration ≥150 ms, 167 of 466 (36%) had a QRS area ≤95 μVs. In the LBBB subgroup, 51 of 185 (28%) patients with QRS duration <150 ms had a QRS area ≤95 μVs, and 71 of 280 (25%) patients with QRS duration >150 ms had a QRS area ≤95 µVs. QRS area ≤95 µVs was associated with the study end point in univariable analysis in both patients with QRS duration <150 ms (unadjusted hazard ratio: 3.85, 95% CI: 2.02–7.37, p<0.001) (Figure 4A) and in patients with QRS duration ≥150 ms (unadjusted hazard ratio: 1.76, 95% CI: 1.32–2.34, p<0.001) (Figure 4B). Similar results were found in the LBBB subgroup when stratifying by QRS duration above/below 150 ms (Figure A.2).
Figure 4. – Kaplan-Meier plots of event-free survival for QRS duration below (A) or above (B) 150 ms for the overall cohort.

The curves are in relation to QRS area above (blue) or below (red) 95 μVs. The hazard ratios are unadjusted.
CI = confidence interval; CRT = cardiac resynchronization therapy; LVAD = implantable left ventricular assist device.
Discussion
This study found that a smaller baseline QRS area calculated from derived vectorcardiograms is associated with an increased hazard of death, heart transplant or LV assist device implant after CRT independently of critical baseline characteristics like QRS duration and morphology. Second, the study found that the Kors method is superior to the inverse Dower method for derivation of the vectorcardiogram for prediction of CRT outcome using QRS area. Third, it found that among the two most widely studied vectorcardiographic based measures of LV electrical delay, the QRS area is superior to the SAI QRS-T for prediction of adverse outcomes after CRT implantation. Finally, the study findings suggest that especially in patients with QRS duration <150 ms (i.e. patients without a current class I-indication for CRT), QRS area has important prognostic value.
Vectorcardiographic measures as predictors of CRT outcome
Vectorcardiography was developed in the 1950’s but has been seldom used clinically for the past 20 years. With the development of digital ECG signal processing, renewed interest in vectorcardiography has emerged, largely as a tool for patient selection in CRT. The digital 12-lead ECG allows for digital derivation of a vectorcardiogram that bears good resemblance and correlation with vectorcardiograms recorded with Frank’s method.17,18 Prior studies have demonstrated that QRS area identifies delayed LV lateral wall activation in CRT candidates, while SAI QRS-T correlates with a dyssynchrony index determined by non-invasive electrocardiographic mapping.7,19 Thus, these measures were proposed to reflect LV electrical dyssynchrony and thereby identify a substrate amendable to CRT. Subsequent studies demonstrated that QRS area and SAI QRS-T predicted LV reverse remodeling and long-term outcome after CRT.8–10
Current guidelines for selection of CRT candidates
Currently, QRS duration and morphology are the only ECG measures incorporated in guidelines for selection of CRT candidates.6 The presence of LBBB and a QRS duration ≥150 ms are associated with a high likelihood of a positive outcome following CRT implantation.20–23 However, this study found that within this cohort of patients with a current class I indication for CRT,6 about 25% have a QRS area ≤95 µVs and an increased hazard of adverse outcome after CRT implantation. Additionally, this study finds that QRS area is strongly associated with long-term outcome in patients with QRS duration <150 ms both in the overall cohort and in the LBBB subgroup, i.e. patients without a current class I indication for CRT.
Strict versus non-strict LBBB was a predictor of outcomes in unadjusted analyses; however, in adjusted models, strict versus non-strict LBBB was not a significant predictor, in contrast to QRS area, which remained a robust predictor of outcomes. Taken together, these data suggest that QRS area is a more powerful predictor of outcomes than strict versus non-strict LBBB.
In patients without LBBB, a smaller QRS area was also associated with an increased hazard of adverse outcome in the univariable analysis. However, the association was not significant in the multivariable analysis, albeit the estimated hazard ratio was not changed much (from 1.55 in univariable to 1.50 in multivariable analysis). In patients without LBBB or right ventricular pacing, less than 10% had a QRS area >95 µVs. Nevertheless, there was a trend towards these patients having a substantially better outcome than similar patients with QRS area ≤95 µVs. As the LV has a significantly larger myocardial mass than the right ventricle, QRS area is mainly determined by the electrical activation in the LV and is thought to reflect LV dyssynchrony. The results of this study suggest that an important minority of patients with a non-LBBB QRS morphology may have LV activation delay, which might be amenable to correction using CRT. However, due to the lack of statistical power in these exploratory analyses, further research is needed.
Limitations
The major limitation of this study is the retrospective nature and absence of a control group. To definitively establish that QRS area effectively identifies CRT candidates, studies that include a control group of patients not receiving CRT are needed. Vectorcardiography may simply identify patients with a high risk of adverse outcomes regardless of whether they benefit from CRT, for example by identifying patients with extensive myocardial scarring. Neither this study nor the previously mentioned studies8–10, included a control group who did not receive CRT, and despite efforts to adjust for confounding, the risk of residual confounding is inherent in the study design.
It is possible that the use of transformed 12-lead ECGs rather than vectorcardiograms may have led to patient misclassification. However, a prior study has shown good agreement between these methods17, and furthermore, 12-lead ECGs (and not vectorcardiograms) are ubiquitous in clinical practice.
Due to the relatively small study cohort, we were unable to separately test and validate the QRS area threshold in separate subpopulations. The findings should be replicated in a prospective study to confirm the predictive value of vectorcardiographic QRS area.
This study only included a clinical end point, and no data on LV reverse remodeling or symptomatic improvement were available. However, previous studies have shown that QRS area is associated with LV reverse remodeling and acute hemodynamic response to CRT.8,24 Additionally, the single center nature of the study may decrease generalizability of results.
Data on several device attributes and parameters were not included in our adjusted models, including LV lead type and position, percent biventricular pacing, and whether CRT optimization was performed. Finally, since many patients undergo CRT implant at Duke University Medical Center but have routine longitudinal care via referring providers, comprehensive data on post implantation device programming and management were not available.
Conclusion
Derived vectorcardiographic QRS area is independently associated with survival free from heart transplantation and LV assist device implantation regardless of QRS duration and the presence of LBBB. QRS area calculated from vectorcardiograms derived with the Kors method is superior to the QRS area derived by the inverse Dower method and to SAI QRS-T from vectorcardiograms derived with either method.
Supplementary Material
Acknowledgments
Funding sources
This work was supported by Gerda & Hans Hansen’s Foundation (KE), Knud Højgaard’s Foundation (KE), The Augustinus Foundation (KE), Danish Society of Cardiology (KE), Aalborg University (KE), and National Institutes of Health T 32 training grant HL069749 (DF). The funding sources had no influence on study design; collection, analysis, or interpretation of data; writing of the report; or decision to submit the article for publication.
Footnotes
Publisher's Disclaimer: This is a PDF file of an unedited manuscript that has been accepted for publication. As a service to our customers we are providing this early version of the manuscript. The manuscript will undergo copyediting, typesetting, and review of the resulting proof before it is published in its final citable form. Please note that during the production process errors may be discovered which could affect the content, and all legal disclaimers that apply to the journal pertain.
Conflicts of interest
Dr. Friedman has received educational grants from Boston Scientific, research grants from the National Cardiovascular Data Registry, Boston Scientific, and Biosense Webster, and has received funding via the National Institutes of Health T 32 training grant HL069749. Dr. Hansen has received research grants from the Danish Heart Foundation, the Laerdal Foundation and TrygFonden, and speaker’s honoraria from AstraZeneca. Dr. Atwater has received research grants from Boston Scientific and Abbott, consultation fees from Abbott, Medtronic, and Biotronik, and is a member of the Speakers Bureau for Medtronic and Biosense Webster.
References
- 1.Moss AJ, Hall WJ, Cannom DS, et al. : Cardiac-resynchronization therapy for the prevention of heart-failure events. N Engl J Med 2009; 361:1329–1338. [DOI] [PubMed] [Google Scholar]
- 2.Cleland JGF, Daubert J- C, Erdmann E, Freemantle N, Gras D, Kappenberger L, Tavazzi L: The effect of cardiac resynchronization on morbidity and mortality in heart failure. N Engl J Med 2005; 352:1539–1549. [DOI] [PubMed] [Google Scholar]
- 3.Bristow MR, Saxon LA, Boehmer J, Krueger S, Kass DA, De Marco T, Carson P, DiCarlo L, DeMets D, White BG, DeVries DW, Feldman AM: Cardiac-resynchronization therapy with or without an implantable defibrillator in advanced chronic heart failure. N Engl J Med 2004; 350:2140–2150. [DOI] [PubMed] [Google Scholar]
- 4.Ellenbogen K a Gold MR, Meyer TE, et al. : Primary results from the SmartDelay determined AV optimization: a comparison to other AV delay methods used in cardiac resynchronization therapy (SMART-AV) Trial. Circulation 2010; 122:2660–2668. [DOI] [PubMed] [Google Scholar]
- 5.Khan FZ, Virdee MS, Palmer CR, Pugh PJ, O’Halloran D, Elsik M, Read P a, Begley D, Fynn SP, Dutka DP: Targeted left ventricular lead placement to guide cardiac resynchronization therapy: the TARGET study: a randomized, controlled trial. J Am Coll Cardiol 2012; 59:1509–1518. [DOI] [PubMed] [Google Scholar]
- 6.Tracy CM, Epstein AE, Darbar D, et al. : 2012 ACCF/AHA/HRS Focused Update Incorporated Into the ACCF/AHA/HRS 2008 Guidelines for Device-Based Therapy of Cardiac Rhythm Abnormalities. J Am Coll Cardiol 2013; 61:e6–e75. [DOI] [PubMed] [Google Scholar]
- 7.Mafi Rad M, Wijntjens GWM, Engels EB, Blaauw Y, JGLM Luermans, L Pison, HJ Crijns, FW Prinzen, K Vernooy: Vectorcardiographic QRS area identifies delayed left ventricular lateral wall activation determined by electroanatomic mapping in candidates for cardiac resynchronization therapy. Hear Rhythm 2016; 13:217–225. [DOI] [PubMed] [Google Scholar]
- 8.van Deursen CJM, Vernooy K, Dudink E, Bergfeldt L, HJGM Crijns, FW Prinzen, L Wecke: Vectorcardiographic QRS area as a novel predictor of response to cardiac resynchronization therapy. J Electrocardiol 2015; 48:45–52. [DOI] [PubMed] [Google Scholar]
- 9.Tereshchenko LG, Cheng A, Park J, Wold N, Meyer TE, Gold MR, Mittal S, Singh J, Stein KM, Ellenbogen KA: Novel measure of electrical dyssynchrony predicts response in cardiac resynchronization therapy: Results from the SMART-AV Trial. Heart Rhythm 2015; 12:2402–2410. [DOI] [PMC free article] [PubMed] [Google Scholar]
- 10.Jacobsson J, Borgquist R, Reitan C, Ghafoori E, Chatterjee NA, Kabir M, Platonov PG, Carlson J, Singh JP, Tereshchenko LG: Usefulness of the Sum Absolute QRST Integral to Predict Outcomes in Patients Receiving Cardiac Resynchronization Therapy. Am J Cardiol 2016; 118:389–395. [DOI] [PMC free article] [PubMed] [Google Scholar]
- 11.Kors JA, van Herpen G, Sittig AC, van Bemmel JH: Reconstruction of the Frank vectorcardiogram from standard electrocardiographic leads: diagnostic comparison of different methods. Eur Heart J 1990; 11:1083–1092. [DOI] [PubMed] [Google Scholar]
- 12.Edenbrandt L, Pahlm O: Vectorcardiogram synthesized from a 12-lead ECG: superiority of the inverse Dower matrix. J Electrocardiol 1988; 21:361–367. [DOI] [PubMed] [Google Scholar]
- 13.Strauss DG, Selvester RH, Wagner GS: Defining left bundle branch block in the era of cardiac resynchronization therapy. Am J Cardiol 2011; 107:927–934. [DOI] [PubMed] [Google Scholar]
- 14.Horvath MM, Winfield S, Evans S, Slopek S, Shang H, Ferranti J: The DEDUCE Guided Query Tool: Providing Simplified Acces to Clinical Data for Research and Quality Improvement. J Biomed Inform 2011; 44:266–276. [DOI] [PMC free article] [PubMed] [Google Scholar]
- 15.Therneau TM: Package “survival”: Survival Analysis [Internet]. 2018. [cited 2018 May 11]. Available from: https://cran.r-project.org/web/packages/survival/survival.pdf
- 16.Blanche P: Package “timeROC”: Time-Dependent ROC Curve and AUC for Censored Survival Data [Internet]. 2015. [cited 2018 May 11]. Available from: https://cran.r-project.org/web/packages/timeROC/timeROC.pdf
- 17.Engels EB, Alshehri S, van Deursen CJM, Wecke L, Bergfeldt L, Vernooy K, Prinzen FW: The synthesized vectorcardiogram resembles the measured vectorcardiogram in patients with dyssynchronous heart failure. J Electrocardiol 2015; 48:586–592. [DOI] [PubMed] [Google Scholar]
- 18.Frank E: An Accurate, Clinically Practical System For Spatial Vectorcardiography. Circulation 1956; 13:737–749. [DOI] [PubMed] [Google Scholar]
- 19.Tereshchenko LG, Ghafoori E, Kabir MM, Kowalsky M: Electrical Dyssynchrony on Noninvasive Electrocardiographic Mapping Correlates with SAI QRST on Surface ECG. Comput Cardiol 2015; 42:69–72. [PMC free article] [PubMed] [Google Scholar]
- 20.Zareba W, Klein H, Cygankiewicz I, et al. : Effectiveness of Cardiac Resynchronization Therapy by QRS Morphology in the Multicenter Automatic Defibrillator Implantation Trial-Cardiac Resynchronization Therapy (MADIT-CRT). Circulation 2011; 123:1061–1072. [DOI] [PubMed] [Google Scholar]
- 21.Sipahi I, Chou JC, Hyden M, Rowland DY, Simon DI, Fang JC: Effect of QRS morphology on clinical event reduction with cardiac resynchronization therapy: meta-analysis of randomized controlled trials. Am Heart J 2012; 163:260–267. [DOI] [PMC free article] [PubMed] [Google Scholar]
- 22.Hsu JC, Solomon SD, Bourgoun M, McNitt S, Goldenberg I, Klein H, Moss AJ, Foster E: Predictors of super-response to cardiac resynchronization therapy and associated improvement in clinical outcome: the MADIT-CRT (multicenter automatic defibrillator implantation trial with cardiac resynchronization therapy) study. J Am Coll Cardiol 2012; 59:2366–2373. [DOI] [PubMed] [Google Scholar]
- 23.Cleland JG, Abraham WT, Linde C, Gold MR, Young JB, Claude Daubert J, Sherfesee L, Wells G a., Tang ASL: An individual patient meta-analysis of five randomized trials assessing the effects of cardiac resynchronization therapy on morbidity and mortality in patients with symptomatic heart failure. Eur Heart J 2013; 34:3547–3556. [DOI] [PMC free article] [PubMed] [Google Scholar]
- 24.De Pooter J, El Haddad M, De Buyzere M, et al. : Biventricular Paced QRS Area Predicts Acute Hemodynamic CRT Response Better Than QRS Duration or QRS Amplitudes. J Cardiovasc Electrophysiol 2017; 28:192–200. [DOI] [PubMed] [Google Scholar]
Associated Data
This section collects any data citations, data availability statements, or supplementary materials included in this article.