Abstract
The CO2 photoreduction process to produce light hydrocarbons is known to be influenced by the presence of CuO nanoparticles, but the actual role of this material, whether as a catalyst or a reactant, has not yet been revealed. In this work, we investigate the role of CuO nanoparticles produced by a solvothermal method as a catalyst in CO2-saturated water reaction media under UV light, considering the effects of different electrolytes (Na2C2O4, KBrO3, and NaOH) and temperatures on nanoparticle phase and activity. The electrolyte strongly influenced product selectivity (NaOH led to evolution of CH4, Na2C2O4 to CO, and KBrO3 to O2) and induced CuO phase change. A long-term analysis of these processes indicated that during the initial steps, CuO acted as a reactant, rather than as a catalyst, and was converted to CuCO3.Cu(OH)2, while the as-converted material acted as a catalyst in CO2 photoreduction, with conversion values comparable to those reported in the literature.
Introduction
The increase in use of fossil fuels for energy production raises serious concerns from the environmental point of view. Allied to this energy demand, the emission of carbon dioxide (CO2), the most significant gas related to the greenhouse effect, contributes significantly to climate change, requiring new strategic approaches and control of emissions1,2. In order to contribute to achieving sustainable sources of energy, photocatalytic materials have been developed for the conversion of CO2 to useful chemical compounds and fuels, employing solar ultraviolet (UV) and visible radiation in a so-called artificial photosynthesis process3–5.
In heterogeneous photocatalysis, when semiconductors are illuminated with energy equal to or greater than the energy of the band gap, electron transfer from the valence band (VB) to the conduction band (CB) generates electron/hole pairs, providing reductive and oxidative sites, respectively6. Photogenerated electrons in the conduction band can then react with molecules adsorbed on the material surface, such as CO2, which is reduced to carbon monoxide, methane, ethanol, formic acid, and other added-value chemicals2,6–8.
Understanding of the various stages of the process is fundamental for the development of materials with appropriate characteristics for this application, as well as to improve the reaction conditions by the elimination of interferents and the addition of species able to enhance the photoreduction efficiency. However, although high CO2 conversion values have been reported in the literature, the roles of different materials in this reaction were not revealed and there is no consensus concerning the most suitable material for catalysis of this reaction. The most studied semiconductor for this application is TiO2, however its low absorption in the visible region makes difficult the use of solar radiation in this process. Thus, a semiconductor that has been showing good results is copper oxide, but uncertainty remains about its actual role in the CO2 photoreduction, whether as a catalyst or as a reactant9–12. In addition, it is necessary to propose feasible photoreduction mechanisms and to determine the ways in which the most important reactive species influence product selectivity. To this end, evaluation of the effect of addition of electrolytes that act as radical, electron, or hole scavengers can clarify their roles in CO2 photoreduction13–15.
In this work, we systematically investigate CO2 photoreduction on CuO nanoparticles synthesized by a solvothermal method, employing different electrolytes and temperatures. The results revealed that CuO acted as a reactant, while as-formed copper carbonate could act as a catalyst in this reaction. The electrolytes influenced CuO phase change and product selectivity, helping to elucidate the ways in which the CO2 photoreduction process was assisted by this material.
Results and Discussion
Characterization
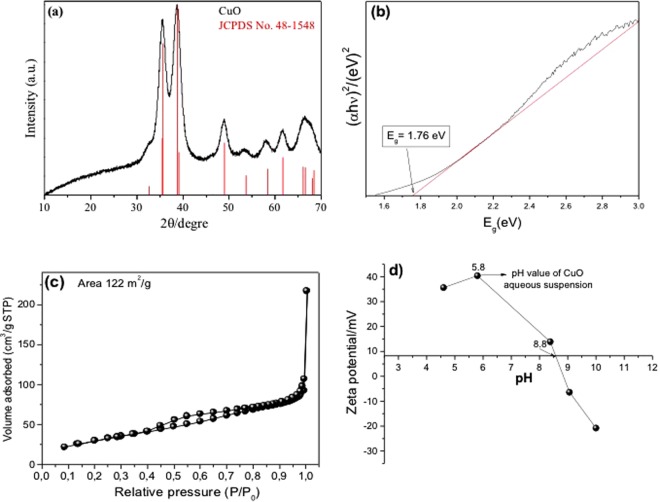
The XRD diffraction pattern of the CuO is shown in Fig. 1a. All the diffraction peaks could be indexed to a monoclinic structure (JCPDS 48–1548) and no impurities (such as Cu(OAc)2) were observed16. The optical characteristics of the CuO were determined by UV-visible diffuse reflectance spectroscopy (Fig. 1b). The band gaps of the CuO were determined by fitting the optical transition at the absorption edges using the Tauc model, assuming that CuO has an indirect-type transition17. The band gap value was obtained from the x-intecept of the tangent line for a plot of (αhν)2 against energy (hν), the measured band gap value was 1.76 eV18–21.
Figure 1.
Analysis of the CuO: (a) XRD patterns, (b) UV-Vis diffuse reflectance spectra, (c) BET adsorption isotherm, and (d) zeta potential.
The porosity property of the CuO was investigated by N2 adsorption-desorption method (Fig. 1c). From this isotherm, it is observed that synthesized CuO nanoparticles exhibited type IV isotherm and the specific surface area was calculated by Brunauer, Emmett, and Teller (BET) method and the obtained value was 122 m2 g−1 22. Zeta potential analysis was performed to determine the CuO surface charge characteristics as a function of pH, since pH exerted a strong influence on the interaction between CO2 and the CuO surface. Figure 1d shows the CuO zeta potential plotted as a function of pH, with a predominantly positive charge density in an aqueous medium. The suspension was at pH 6.0 without any electrolyte, and the isoelectric point of the CuO was at pH ≈ 8.8.
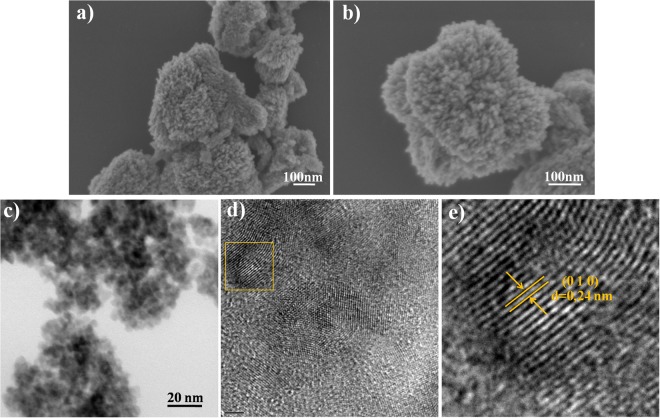
The morphology of the CuO was analyzed by FESEM and HRTEM. The FESEM image (Fig. 2) revealed that the nanoparticles presented a homogeneous coral-like architecture composed of aggregates of CuO nanospheres. The HRTEM measurements (Fig. 2e) confirmed that synthesis of the CuO nanoparticles by the solvothermal method resulted in the formation of a monoclinic crystalline structure, in agreement with previous work of our group16.
Figure 2.
Electron microscopy analysis of CuO: (a,b) FESEM images; (c,d) low-magnification TEM images; (e) HRTEM image of selected area in (d).
Photoreduction tests
Effect of the electrolytes
Evaluation of the photocatalytic activity of the CuO for CO2 photoreduction in aqueous solutions of Na2C2O4, KBrO3, and NaOH, as well as in pure water, was performed under UV irradiation (Fig. 3). Four blank condition tests were conducted in order to obtain baselines, with irradiation in the absence of the catalyst (see Supplementary Information).
Figure 3.
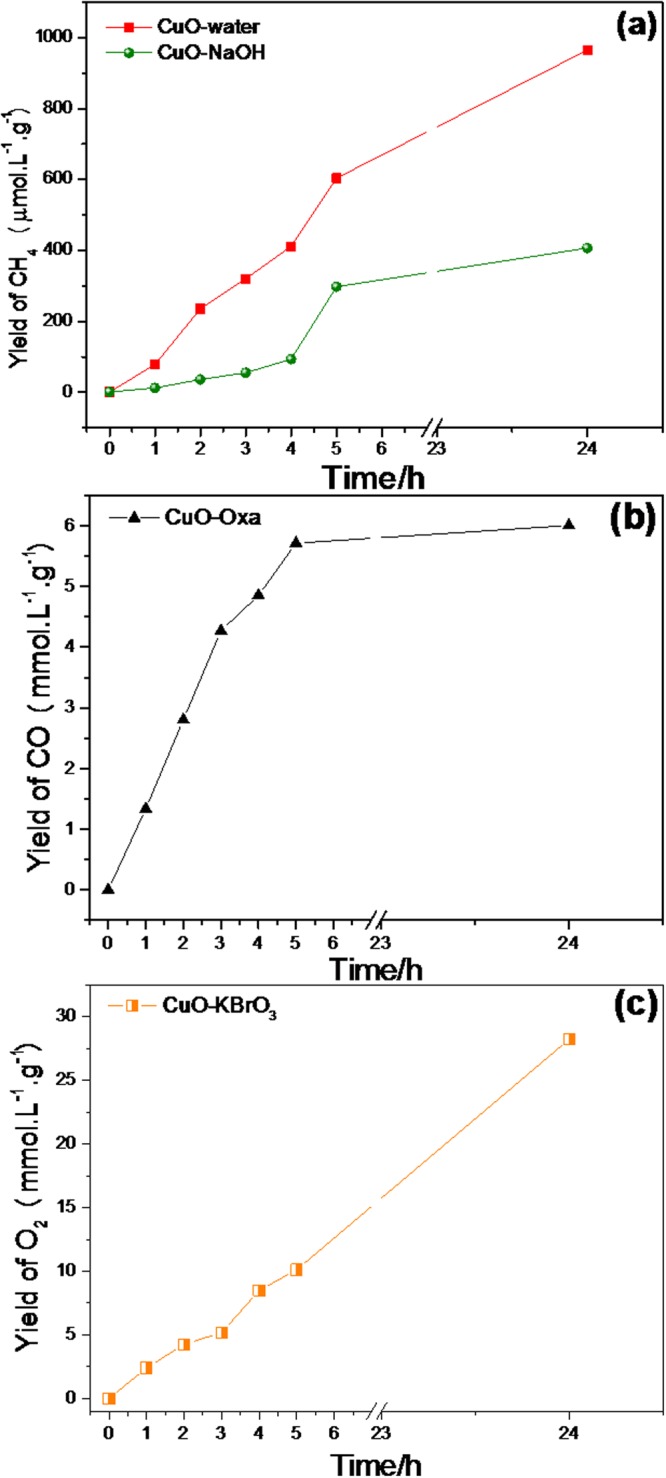
Products distribution for the photocatalytic reduction of CO2 with (a) H2O and NaOH, (b) sodium oxalate, and (c) KBrO3.
Analysis of the gas samples indicated that only CH4 was formed when the CO2 photoreduction was carried out in water or in sodium hydroxide solution. Increasing formation of CH4 was observed during 24 h under continuous irradiation (Fig. 3a), and the results indicated that water was more effective than aqueous sodium hydroxide solution for the reduction of CO2 to CH4. This was probably related to the isoelectric point of CuO (Fig. 1d), which was at pH ≈ 8.8. Considering that the NaOH solution had pH ≈ 9–10, this indicated that the CuO surface charge was negative under this condition, with electron migration to the surface being less probable and CO2 adsorption not being favored. This was because at higher pH, the solubility of CO2 increases (forming CO32−), hence influencing the adsorption process and interfering in the CO2 photoreduction23. However, the specie prevailing in equilibrium in our system (using other electrolytes) is HCO3−, which was assumed to be the main reactant since all reactions occurred at pH ranging from 7 to 9 in non-saline medium (in this range, at least 80% of total dissolved carbon is HCO3−)24.
In the first step of the photocatalytic process, CO2 adsorbed on the CuO catalyst surface reacted with electrons to produce carbon dioxide radicals (CO2•−), which then reacted with H+ to form surface CO and C, ultimately producing CH4 10,25:
| 1 |
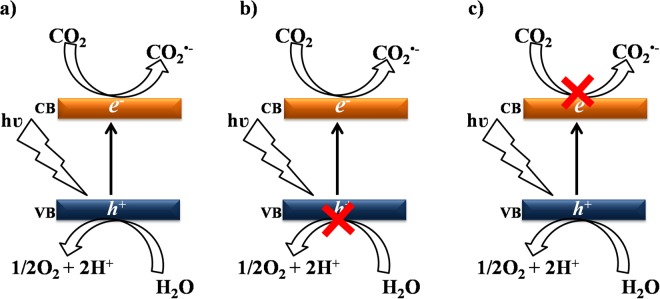
The importance of the participation of water splitting by the holes in the formation of certain products such as CH4 can be elucidated by the addition of species that inject electrons preferentially into the semiconductor. Sodium oxalate, for example, can be used26, since it reacts directly with the holes, as represented by Equation 2, so H+ generation is suppressed, favoring only the CO formation reaction (Equation 3) (Fig. 4b)27,28. However, when the reaction was carried out in aqueous KBrO3 solution, only O2 was detected, as shown in Fig. 3c. Sodium oxalate is consumed in the reaction that generates electrons, as shown in Equations 2 and 3.
| 2 |
| 3 |
Figure 4.
Schematic representation of the effect of the electrolyte in the photoreduction process: (a) pure water and NaOH, (b) sodium oxalate, and (c) KBrO3.
In the case of O2 evolution, BrO3− acts as an electron scavenger, hence suppressing any CO2 reduction. It is therefore expected that this compound will be reduced in the same way, forming Br−. The participation of electrons in the photoreduction process was related to the ability to reduce the CO2 present in the reaction medium to the radical29. The addition of KBrO3 at low concentrations impaired formation of the radical, due to its high capacity to capture electrons. On the other hand, it hindered recombination by generating more holes for the reaction with water molecules, hence damaging the photoreduction process (Fig. 4c).
It can be seen in Fig. 5 that the amount of CO2 present in the headspace remained practically constant throughout the reaction (24 hours). The small oscillations observed are attributed to the displacement caused by the system in search of a chemical equilibrium between the CO2 dissolved in the liquid phase and that in the gas phase. The CO2 dissolved is consumed during the photoreaction reaction and to maintain the CO2 saturated medium, the gaseous CO2 moves into the liquid. It is worth mentioning that the long-term CO2 level was around 149–151 μmol.L−1.g−1 for all samples, indicating that despite the small variation observed, CO2 concentration could be considered constant over long periods of reaction.
Figure 5.
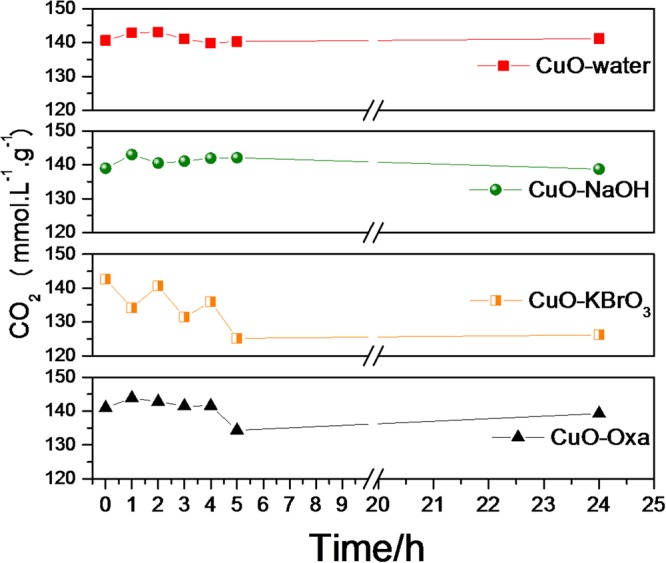
Concentration of CO2 as a function of UV irradiation time.
Effect of temperature
Figure 6 shows the temperature dependence of the photoreduction of CO2 to CH4 in pure water, from which it can be seen that there was an optimum temperature for the process. This could be due to lower CO2 saturation (see Supplementary Material: Table S1)30. Therefore, very high temperatures could negatively affect the reaction rate, due to the shift of CO2 saturation towards lower values31. It can be seen from Fig. 6 that the best temperature for the photoreduction of CO2 to CH4 was around 25 ± 3 °C.
Figure 6.
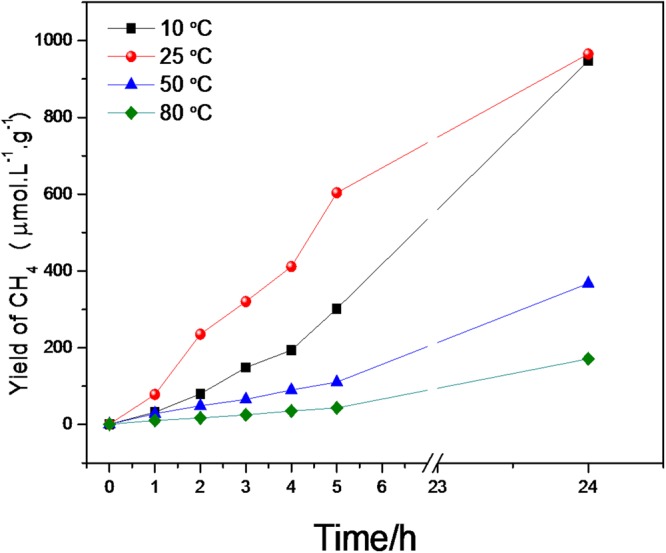
Kinetics of CO2 photoreduction at different temperatures.
The activity was measured by the CH4 yields (Equation 4) and rates (Equation 5):
| 4 |
| 5 |
The production rates of CH4 in 5 h of reaction at different temperatures are shown in Table 1. The reaction conducted at temperature of 25 °C showed the highest rate of approximately 121 μmol/L.gcat.h, being 13 higher than the reaction conducted at 80 °C.
Table 1.
Yields and Rate constants for the CO2 photoreduction reaction catalyzed by CuO at different temperatures under UV irradiation after 5 h of reaction.
| Temperature (°C) | Yield (μmol/L.gcat) | Rate (μmol/L.gcat.h−1) |
|---|---|---|
| 10 | 299 | 59.8 |
| 25 | 606 | 121.2 |
| 50 | 110 | 22.0 |
| 80 | 44 | 8.8 |
The reutilization of CuO in the CO2 photoreduction process was evaluated in four successive runs, while keeping the experimental conditions unchanged. As shown in Fig. 7, there was a high decrease (to ≈78%) after the first photoreduction cycle, due to the conversion of CuO to copper carbonate, while the CO2 photoreduction became stabilized after three cycles.
Figure 7.
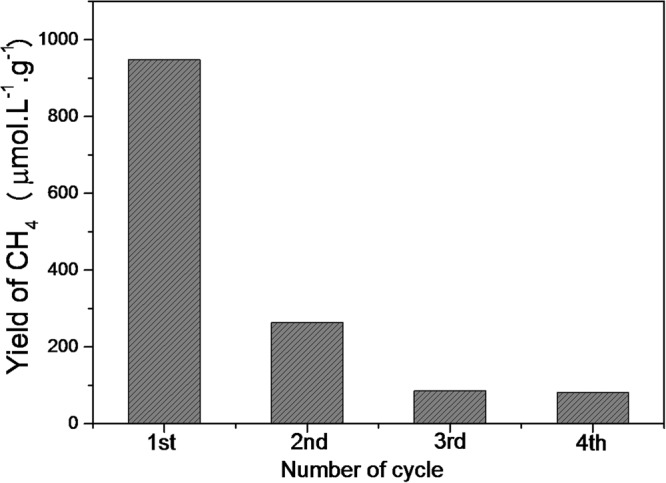
Activity of CuO after 24 h in successive cycles of the photocatalytic reduction of CO2 in H2O at 25 ± 3 °C.
All the reduction experiments (Fig. 3) showed saturation profiles, which was probably due to saturation of the headspace and consumption of the CO2 available for reaction (since all the experiments were performed in batch mode). However, this profile could also be related to catalyst poisoning, or to the consumption or transformation of CuO during the experiment (with the CuO acting as a reactant, rather than purely as a catalyst). In order to elucidate these possible paths, the material was characterized after the reduction reaction under each tested condition.
The XRD patterns revealed noticeable changes in the structures of the materials after the reactions (Fig. 8). In the reaction using sodium oxalate solution, the material presented 2θ peaks at 43.5° and 50.5°, corresponding to planes (111) and (200), respectively, related to metallic copper (JCPDS 04-0836), together with peaks centered at 2θ of 36.5° and 61.0°, related to Cu2O, showing that after 24 h the material had undergone a reduction process. On the other hand, when the reaction was performed using KBrO3 or NaOH solutions, or pure water, the materials showed diffraction peaks related to copper carbonate (malachite, CuCO3.Cu(OH)2) (JCPDS 01-0959). In fact, the first evidence of reaction of CO2 with CuO was a color change from brown to light green, indicative of copper carbonate formation32,33:
| 6 |
Figure 8.
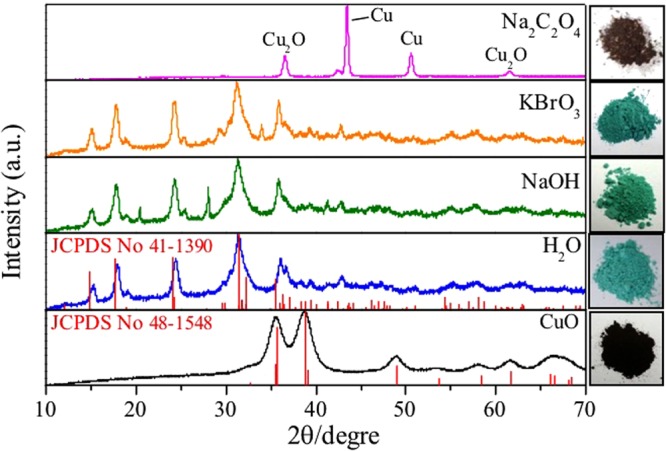
XRD patterns of catalysts before (CuO) and after reaction for 24 h under different conditions at 25 ± 3 °C.
The FTIR spectra of the CuO surface before and after UV irradiation for 24 h are shown in Fig. 9. The FTIR spectrum of the as-prepared CuO showed a broad band at approximately 400–600 cm−1, attributed to the vibrations of Cu-O, and bands at 1623 and 1405 cm−1, related to asymmetric stretching of C-O and asymmetric bending of CH3 of the copper acetate precursor, respectively23. After the CO2 photoreduction using different electrolytes the FTIR spectra showed a different profile of the CuO sample before the reaction. Bands at 1510 cm−1 and 1403 cm−1 were related to C-O stretching modes, while those at 885 and 816 cm−1 were due to C-O bending vibration modes. Bands at 3414 and 3338 cm−1 could be attributed to O-H stretching modes, reflecting the presence of two different OH groups in the copper carbonate crystal lattice34–36.
Figure 9.
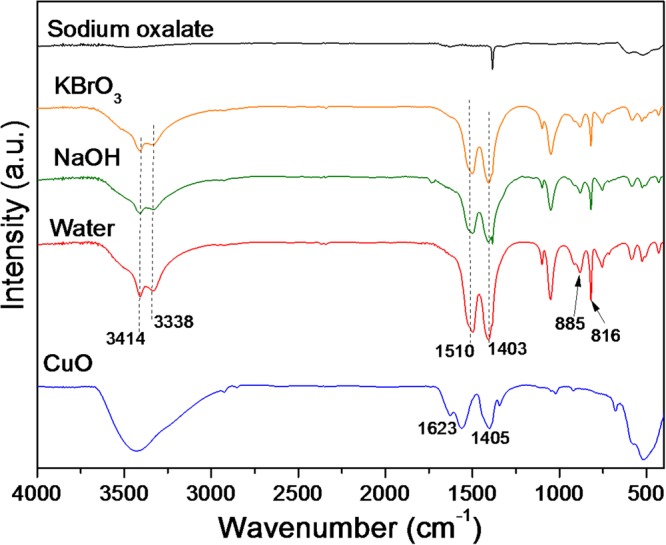
FTIR spectra of the materials after CO2 photoreduction.
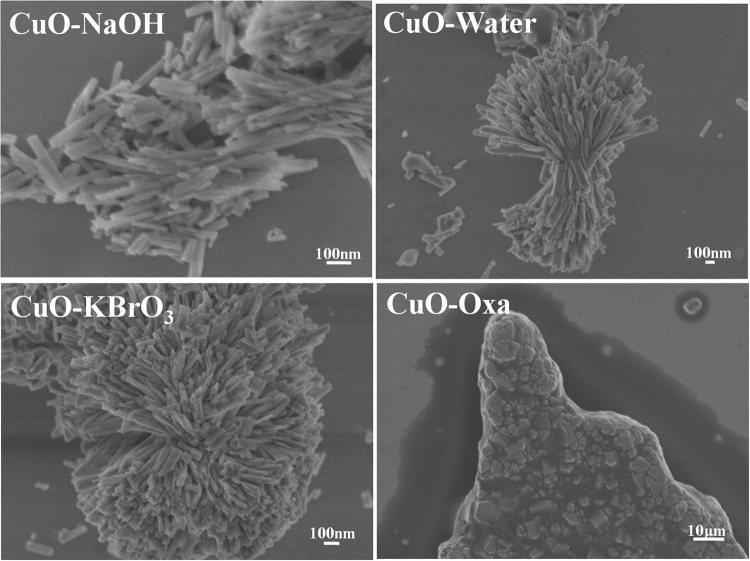
FESEM and HRTEM was employed to examine morphological features of the materials after the photoreduction process (Figs 10 and 11). It was observed that not only did the CuO structure change, but the morphology also altered. The reactions performed in the presence of pure water and aqueous solutions of NaOH or KBrO3 led to the formation of nanorods, while the reaction carried out in the presence of aqueous sodium oxalate solution led to the formation of metallic copper plates.
Figure 10.
FESEM images of the materials after 24 h of reaction.
Figure 11.
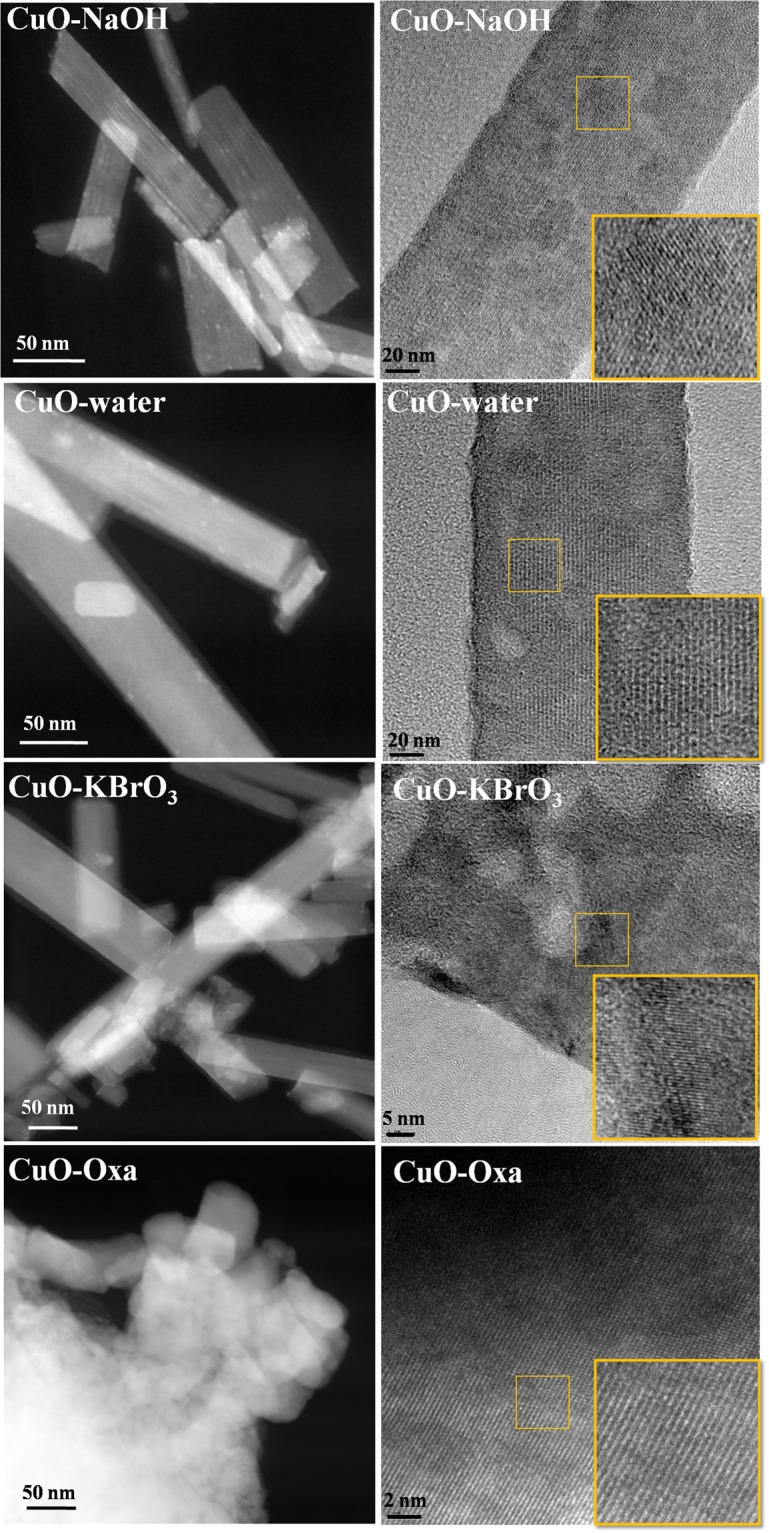
HRTEM images of the materials after 24 h of reaction.
The findings were supported by comparison with conversion levels reported in the literature (Table 2). Considering studies with copper oxide and CuO-related materials, stable CO2 conversions catalyzed by malachite were within the same range, suggesting that the same phenomenon was probably being observed (despite the fact that in all the earlier studies it was stated that the actual catalyst present was copper oxide).
Table 2.
CuO-based photocatalytic systems for CO2 reduction to CH4.
| Catalysts | Condition | Irradiance | CH4 (μmol.g−1 h−1) | Ref. |
|---|---|---|---|---|
| CuO | 300 W Xe lamp | 100 mW cm−2 | 2.96 | 9* |
| CuO | 100 W Xenon solar | — | 19.7 | 10* |
| Cu2O | 125 W Hg lamp | — | 16.0 | 11 |
| Cu2O/TiO2 | 300 W Xe lamp | 20.5 mW cm−2 | 0.99 | 12 |
| CuO | 5 W UVC lamp | 5.5 mW cm−2 | 39.5 | This work |
*Normalized units.
From these results, we propose that the actual catalyst for CO2 reduction was the as-formed malachite phase, acting by surface adsorption and possible structural exchange. CO2 could be bonded to the surface of the material in three different ways, as monodentate carbonate, bidentate carbonate, and bidentate bicarbonate, as shown in Fig. 12 4. Under UV irradiation, the species adsorbed on the material surface could be easily transformed to CO2•−, which is a key intermediate in CO2 photoreduction.
Figure 12.
Schematic diagram of species adsorbed on the CuO surface in the CO2 adsorption process.
Methods
Solvothermal synthesis of CuO
The CuO nanoparticles were synthesized by adding 50 mL of a 0.05 M solution of copper acetate in ethanol (99.5%, Synth) to a 100 mL poly(tetrachlorethylene) capsule and then placing the capsule in an autoclave, under constant magnetic stirring37. The solvothermal treatment was performed at 110 °C for 20 h. After the reaction, the autoclave was cooled naturally to room temperature. The product was recovered by centrifugation, washed two times in ethanol, and then dried in air at 60 °C for 4 h.
Characterization
The CuO powder was characterized by X-ray diffraction (XRD), using CuKα radiation with λ = 0.15406 nm, employing a Shimadzu XRD 6000 diffractometer operated at 30 mA and 30 kV, in the 2θ range from 20 to 80°, with a scan step of 0.02°. The morphologies of the materials were characterized by high resolution transmission electron microscopy (HRTEM), using a TECNAI G2 F20 microscope (FEI) operated at 200 kV, and by field emission scanning electron microscopy (FESEM), using a JSM 6701 F microscope (JEOL) operated at 5 kV. The HRTEM samples were prepared by wetting carbon-coated copper grids with a drop of the colloidal suspensions and then drying in air.
The specific surface areas of the materials were measured using nitrogen adsorption at 77 K (ASAP-2020, Micromeritics), with calculation according to the Brunauer-Emmett-Teller (BET) method. Prior to the analyses, the samples were pre-treated (degassed) by heating at 70 °C under vacuum until reaching a pressure of less than 20 mm Hg. Diffuse reflectance spectra (DRS) in the ultraviolet-visible region were recorded between 200 and 800 nm, at room temperature, using a Cary 5 G instrument (Varian) operated in diffuse reflectance mode. The band gaps of the samples were determined according to the method proposed by Tauc38,39. Infrared (FTIR) spectra of the materials were obtained in the range from 4000 to 400 cm−1, with 32 scans and 4 cm−1 resolution, using a Spectrum 1000 spectrophotometer (Perkin Elmer). The zeta potentials of dilute suspensions of the materials were measured with a Zeta Sizer nano-ZS instrument (Malvern Instruments), in the pH range from 11 to 4, with the pH adjusted by adding 0.1 M HCl or 0.1 M NaOH.
CO2 photoreduction
The CO2 photoreduction was performed in a 500 mL capacity cylindrical acrylic reactor, covered with borosilicate glass. A 0.3 g quantity of the catalyst was suspended in 300 mL of solutions of NaOH (0.1 M), Na2C2O4 (0.1 M), or KBrO3 (0.1 M), or in pure water. Ultrapure CO2 was bubbled through the reactor for at least 20 min to ensure that all the dissolved oxygen was eliminated. The illumination system employed a 5 W UVC lamp (Philips) with a wavelength of 253.7 nm, positioned in the center of the reactor. The measured intensity of the incident light was 5.5 mW cm−2. A detailed description of the photoreactor system is provided in the Supplementary Information.
The progress of the reaction was monitored by collecting and analyzing samples at regular intervals. Gaseous products were determined by GC-TCD and GC-FID (model CP-3800 gas chromatograph, Varian), using a packed column (HayeSep N, 0.5 m × 1/8″). The gas flow rates were 30 mL min−1 (H2), 300 mL min−1 (air), and 30 mL min−1 (N2). The injector, TCD, and FID temperatures were 150, 200, and 150 °C, respectively. The sample injection volume was 2 μL, and the yield was calculated using injections of standard gaseous mixtures. Blank reactions were carried out to ensure that the CH4 and CO originated from the photoreduction of CO2 see Supplementary Information. In the first blank reactions, no catalyst was added, and all other conditions were maintained the same, in the second test the reaction was conducted in nitrogen atmosphere.
Conclusion
Concluding, we observed that CuO was not stable during the CO2 photoreduction process, with CuO changing to malachite (CuCO3.Cu(OH)2). However, significant CO2 conversion was observed during the CuO carbonation process, and the performance of malachite as a catalyst was comparable to results reported in the literature, where the catalyst was assumed to be CuO. The nature of the electrolyte influenced product selectivity, with CuO phase change participating in the processes. The results reported here contribute to elucidation of the role of CuO in the CO2 photoreduction process, providing important information for the rational development of Cu-based catalysts for this process.
Electronic supplementary material
Acknowledgements
The authors are grateful to the Ministry of Science, Technology, and Innovation (through SisNANO Program – National System of Laboratories in Nanotechnology), the National Council for Scientific and Technological Development (CNPq, Brazil China Virtual Center in Nanotechnology Project and grant #402.287/2013-4), Coordination for the Improvement of Higher Education Personnel (CAPES, grants CAPES-Embrapa and CAPES-Humboldt, Finance Code 001), Sao Paulo Research Foundation (FAPESP #15/14330-8, #16/09746-3, #16/21515-7 and #14/09014-7), and Embrapa Rede AgroNano for their financial support. Caue Ribeiro also acknowledge Chinese Academy of Sciences (CAS) President's International Fellowship Initiative (PIFI) by financial support and Alexander von Humboldt Foundation Fellowship for Experienced Researchers (Finance Code 001 - CAPES Process 88881.145566/2017-1. We thank the Brazilian Nanotechnology Laboratory for Research in Energy and Materials (LNNano) and the Structural Characterization Laboratory (LCE) for technical support during the X-ray photoelectron spectroscopy (grant #13839) and transmission electron microscopy experiments, respectively.
Author Contributions
A.E.N. and C.R. designed research; A.E.N., J.A.O. and G.T.S.T.S. conducted the experiment; A.E.N., J.A.O. and G.T.S.T.S. and C.R. wrote the paper. All authors reviewed the manuscript.
Competing Interests
The authors declare no competing interests.
Footnotes
Publisher’s note: Springer Nature remains neutral with regard to jurisdictional claims in published maps and institutional affiliations.
Electronic supplementary material
Supplementary information accompanies this paper at 10.1038/s41598-018-36683-8.
References
- 1.Das S, Daud W. A review on advances in photocatalysts towards CO2 conversion. RSC Advances. 2014;4:20856–20893. doi: 10.1039/c4ra01769b. [DOI] [Google Scholar]
- 2.Zhou R, Guzman MI. CO2 Reduction under Periodic Illumination of ZnS J. Phys. Chem. C. 2014;118:11649–11656. doi: 10.1021/jp4126039. [DOI] [Google Scholar]
- 3.Liu L, Li Y. Understanding the Reaction Mechanism of Photocatalytic Reduction of CO2 with H2O on TiO2 -Based Photocatalysts: A Review Aerosol. Air Qual. Res. 2014;2:453–469. doi: 10.4209/aaqr.2013.06.0186. [DOI] [Google Scholar]
- 4.Wang Y, et al. CO2 photoreduction with H2O vapor on highly dispersed CeO2/TiO2 catalysts: Surface species and their reactivity. J. Catal. 2016;337:293–302. doi: 10.1016/j.jcat.2015.12.030. [DOI] [Google Scholar]
- 5.Aguirre ME, Zhou R, Eugene AJ, Guzman MI, Grela MA. Environmental Cu2O/TiO2 heterostructures for CO2 reduction through a direct Z-scheme: Protecting Cu2O from photocorrosion. Appl. Catal. B. 2017;217:485–493. doi: 10.1016/j.apcatb.2017.05.058. [DOI] [Google Scholar]
- 6.Fujishima A, Inoue T, Konishi S, Honda K. Photoelectrocatalytic reduction of carbon dioxide in aqueous suspensions of semiconductor powders. Nature. 1979;277:637–638. doi: 10.1038/277637a0. [DOI] [Google Scholar]
- 7.Mao J, Li K, Peng T. Recent advances in the photocatalytic CO2 reduction over semiconductors. Catal. Sci. and Tech. 2013;3:2481. doi: 10.1039/c3cy00345k. [DOI] [Google Scholar]
- 8.Zhou R, Guzman MI. Photocatalytic Reduction of Fumarate to Succinate on ZnS MineralSurfaces. J. Phis. Chem. C. 2016;120:7349–7357. doi: 10.1021/acs.jpcc.5b12380. [DOI] [Google Scholar]
- 9.In SL, Vaughn DD, Schaak RE. Hybrid CuO-TiO2 À x N x Hollow Nanocubes for Photocatalytic Conversion of CO2 into Methane under Solar Irradiation. Angew. Chem. 2012;51:3915–3918. doi: 10.1002/anie.201108936. [DOI] [PubMed] [Google Scholar]
- 10.Park S, et al. Hybrid CuxO−TiO2 Heterostructured Composites for Photocatalytic CO2 Reduction into Methane Using Solar Irradiation. ACS Omega. 2016;1:868–875. doi: 10.1021/acsomega.6b00164. [DOI] [PMC free article] [PubMed] [Google Scholar]
- 11.Ovcharov ML, Mishura AM, Shcherban ND, Filonenko SM, Granchak VM. Photocatalytic reduction of CO2 using nanostructured Cu2O with foam-like structure. Solar Energy. 2016;139:452. doi: 10.1016/j.solener.2016.10.010. [DOI] [Google Scholar]
- 12.Zhuo X, et al. Selective photocatalytic reduction of CO2 into CH4 over Pt-Cu2O TiO2 nanocrystals: The interaction between Pt and Cu2O cocatalysts. Appl. Catal. B. 2017;202:695–703. doi: 10.1016/j.apcatb.2016.10.001. [DOI] [Google Scholar]
- 13.Li Y, Wang J, Yao H, Dang L, Li Z. Efficient decomposition of organic compounds and reaction mechanism with BiOI photocatalyst under visible light irradiation. J. Mol. Catal. A, Chem. 2011;334:116–122. doi: 10.1016/j.molcata.2010.11.005. [DOI] [Google Scholar]
- 14.Renaudde R, Ming T, Davies P, Wei L, Sylvain C. Removal of non-CO2 greenhouse gases by large-scale atmospheric solar photocatalysis. Prog. Energy Combust. Sci. 2017;60:68–96. doi: 10.1016/j.pecs.2017.01.001. [DOI] [Google Scholar]
- 15.Villa K, Murcia-lópez S, Andreu T, Ramón J. Mesoporous WO3 photocatalyst for the partial oxidation of methane to methanol using electron scavengers. Appl. Catal. B. 2015;163:150–155. doi: 10.1016/j.apcatb.2014.07.055. [DOI] [Google Scholar]
- 16.Nogueira AE, Giroto AS, Neto ABS, Ribeiro C. CuO synthesized by solvothermal method as a high capacity adsorbent for hexavalent chromium Colloids. Surfaces A Physicochem. Eng. Asp. 2016;498:161–167. doi: 10.1016/j.colsurfa.2016.03.022. [DOI] [Google Scholar]
- 17.Radhakrishnan AA, Beena BB. Structural and Optical Absorption Analysis of CuO Nanoparticles. Indian J. of Adv. Chem. Sci. 2014;2:158–161. [Google Scholar]
- 18.Roy SC, Varghese OK, Paulose M. Toward Solar Fuels: Photocatalytic Conversion of Carbon Dioxide to Hydrocarbons. ACS Nano. 2010;4:1259–1278. doi: 10.1021/nn9015423. [DOI] [PubMed] [Google Scholar]
- 19.Heinemann M, Eifert B, Heiliger C. Band structure and phase stability of the copper oxides Cu2O, CuO, and Cu4O3. Phys. Rev. B - Condens. Matter Mater. Phys. 2013;87:3–7. doi: 10.1103/PhysRevB.87.115111. [DOI] [Google Scholar]
- 20.Mallick P, Sahu S. Structure, Microstructure and Optical Absorption Analysis of CuO Nanoparticles Synthesized by Sol-Gel Route. Nanosci. Nanotechnol. 2012;2:71–74. doi: 10.5923/j.nn.20120203.05. [DOI] [Google Scholar]
- 21.Marabelli F, Parravicini GB, Salghetti-Drioli F. Optical gap of CuO. Phys. Rev. B. 1995;52:1433–1436. doi: 10.1103/PhysRevB.52.1433. [DOI] [PubMed] [Google Scholar]
- 22.Matthias T, et al. Physisorption of gases, with special reference to the evaluation of surface area and pore size distribution (IUPAC Technical Report) Pure Appl. Chem. 2015;87:1051–1069. [Google Scholar]
- 23.Roldan A, et al. Bio-inspired CO2 conversion by iron sulfide catalysts under sustainable conditions. Chem. Commun. 2015;51:7501–7504. doi: 10.1039/C5CC02078F. [DOI] [PubMed] [Google Scholar]
- 24.Mook, W. Environmental Isotopes in the Hydrological Cycle: Principles and Applications, Chapter “Chemistry of carbonic acid in water” pp. 143–165, INEA/UNESCO: Paris (2000).
- 25.Kwak BS, Kang M. Photocatalytic reduction of CO2 with H2O using perovskite CaxTiyO3. Appl. Surf. Sci. 2015;337:138–144. doi: 10.1016/j.apsusc.2015.02.078. [DOI] [Google Scholar]
- 26.Ju P, Wang Y, Sun Y, Zhang D. Controllable one-pot synthesis of a nest-like Bi2WO6/BiVO4 composite with enhanced photocatalytic antifouling performance under visible light irradiation. Dalton Trans. 2016;45:4588–4602. doi: 10.1039/C6DT00118A. [DOI] [PubMed] [Google Scholar]
- 27.Karamian E, Sharifnia S. On the general mechanism of photocatalytic reduction of CO2. J. CO2 Util. 2016;16:194–203. doi: 10.1016/j.jcou.2016.07.004. [DOI] [Google Scholar]
- 28.Yue M, Wang R, Cheng N, Gao W, Yang T. ZnCr2S4: Highly effective photocatalyst converting nitrate into N2 without over-reduction under both UV and pure visible light. Sci. Rep. 2016;6:1–11. doi: 10.1038/s41598-016-0001-8. [DOI] [PMC free article] [PubMed] [Google Scholar]
- 29.Nikokavoura A, Trapalis C. Alternative photocatalysts to TiO2 for the photocatalytic reduction of CO2. Appl. Surf. Sci. 2017;391:149–174. doi: 10.1016/j.apsusc.2016.06.172. [DOI] [Google Scholar]
- 30.Carroll JJ, Slupsky JD, Mather AE. The Solubility of Carbon Dioxide in Water at Low Pressure. J. Phys. Chem. Ref. Data. 1991;20:1201–1209. doi: 10.1063/1.555900. [DOI] [Google Scholar]
- 31.Fogler, S. H. Elements of Chemical Reaction Engineering. (Prentice Hall, 2016).
- 32.Xi T, Hong S, Xia F. Green synthesis of CuO nano fl akes from CuCO3·Cu(OH)2 powder and H2O2 aqueous solution. Powder Technol. 2012;228:128–130. doi: 10.1016/j.powtec.2012.05.007. [DOI] [Google Scholar]
- 33.Yu-Kai L, et al. Efficient hydrogen production using Cu-based catalysts prepared via homogeneous precipitation. J. Mat. Chem. 2009;19:9186–9194. doi: 10.1039/b912253b. [DOI] [Google Scholar]
- 34.Stoilova D, Koleva V, Vassileva V. Spectrochim. Infrared study of some synthetic phases of malachite (Cu2(OH)2CO3)– hydrozincite (Zn5(OH)6(CO3)2) series. Acta A Mol. Biomol. Spectrosc. 2002;58:2051–2059. doi: 10.1016/S1386-1425(01)00677-1. [DOI] [PubMed] [Google Scholar]
- 35.Schmidt M, Lutz HD. Hydrogen Bonding in Basic Copper Salts: a Spectroscopic Study of Malachite, Cuz(OH)zCO3, and Brochantite, Cu4(OH)6SO4. Phys. Chem. Miner. 1993;2:27–32. [Google Scholar]
- 36.Lutz HD. Structure and strength of hydrogen bonds in inorganic solids. J. Mol. Struct. 2003;646:227–236. doi: 10.1016/S0022-2860(02)00716-0. [DOI] [Google Scholar]
- 37.Nogueira AE, Lopes OF, Neto ABS, Ribeiro C. Enhanced Cr(VI) photoreduction in aqueous solution using Nb2O5/CuO heterostructures under UV and visible irradiation. Chem. Eng. J. 2017;312:220–227. doi: 10.1016/j.cej.2016.11.135. [DOI] [Google Scholar]
- 38.Tolvaj L, Mitsui K, Varga D. Validity limits of Kubelka – Munk theory for DRIFT spectra of photodegraded solid wood. Wood Sci. Tech. 2011;45:135–146. doi: 10.1007/s00226-010-0314-x. [DOI] [Google Scholar]
- 39.Wood, D. L. & Tauc, J. Weak Absorption Tails in Amorphous Semiconductors. Phisical Rev. 5 (1972).
Associated Data
This section collects any data citations, data availability statements, or supplementary materials included in this article.


