Abstract
Several long non‐coding RNAs (lncRNAs) act as regulators of cellular homeostasis; however, few of these molecules were functionally characterized in a mature human tissue environment. Here, we report that the lncRNA LINC00941 is a crucial regulator of human epidermal homeostasis. LINC00941 is enriched in progenitor keratinocytes and acts as a repressor of keratinocyte differentiation. Furthermore, LINC00941 represses SPRR5, a previously uncharacterized molecule, which functions as an essential positive regulator of keratinocyte differentiation. Interestingly, 54.8% of genes repressed in SPRR5‐deficient epidermal tissue are induced in LINC00941‐depleted organotypic epidermis, suggesting a common mode of action for both molecules.
Keywords: differentiation, epidermis, LINC00941, long non‐coding RNA, SPRR5
Subject Categories: Development & Differentiation, RNA Biology
Introduction
The epidermis is a stratified surface epithelium that provides a protective barrier to the external environment and constantly self‐renews approximately every 28 days. During this regeneration process, progenitor cells settled in the basal layer divide and the daughter cells undergo a terminal differentiation program. A precise balance between keratinocytes in the progenitor compartment and terminally differentiated layers is crucial to ensure formation of a functional epidermis with an intact water barrier 1. Disrupted expression of genes controlling proliferation and differentiation occurs in numerous skin diseases and epidermal cancers 2. Thus, further understanding of these processes will give insight into normal tissue homeostasis and may provide new targets for the prevention and treatment of disorders of epidermal growth, differentiation, and regeneration.
Long non‐coding RNAs (lncRNAs) have emerged as key regulators of gene expression in many different cellular pathways and were frequently shown to act as part of protein‐containing complexes 3. Nevertheless, the exact genomic annotations and functional significance for most lncRNAs are still unknown to date. Few lncRNAs were shown to be functionally involved in normal human epidermal homeostasis: ANCR, TINCR, and SMRT‐2 appear to regulate differentiation, while PRINS is a stress‐regulated lncRNA involved in psoriasis 4, 5, 6, 7, 8, 9. However, the majority of functionally characterized lncRNAs regulate developmental processes and their potential role in controlling mature tissue homeostasis and differentiation remains largely uncharacterized.
Here, we show that the long non‐coding RNA LINC00941 functions as a crucial regulator of human epidermal homeostasis. LINC00941 is enriched in progenitor keratinocytes and acts as a repressor of keratinocyte differentiation in cells and tissue. LINC00941 represses SPRR5, a previously uncharacterized predicted protein, which we show functions as an essential regulator of keratinocyte differentiation. SPRR5 is located within the epidermal differentiation complex (EDC) and controls expression of the small proline‐rich region (SPRR) and late cornified envelope (LCE) differentiation gene clusters. Thus, LINC00941 appears to inhibit premature differentiation in weakly differentiated strata of the human epidermis, at least in part, through repression of SPRR5.
Results and Discussion
The long non‐coding RNA LINC00941 is enriched in human progenitor keratinocytes
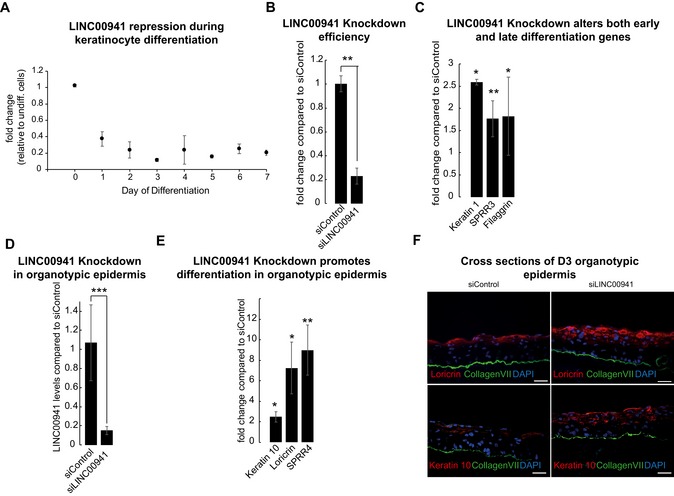
To identify previously unrecognized lncRNAs involved in human epidermal homeostasis, we recently conducted transcriptome sequencing analyses of non‐differentiated and differentiated human keratinocytes and revealed a number of lncRNAs dynamically regulated throughout this process 5, 6. One of these lncRNAs, LINC00941, which is encoded on chromosome 12, was most highly expressed in undifferentiated progenitor keratinocytes (on average approximately. 59 ± 14 copies per cell) and significantly reduced in abundance upon onset of terminal differentiation. Correspondingly, qRT–PCR analysis confirmed reduction of LINC00941 expression throughout all time points of calcium‐induced differentiation of human keratinocyte cultures (Fig 1A). While LINC00941 was recently reported to play a role in development of hepatocellular carcinoma 10, nothing is known about its role in regulation of tissue homeostasis. LINC00941 is expressed in multiple human tissues (Fig EV1A) and annotated as a lncRNA with two isoforms with a length of 1,895 and 1,355 nucleotides, respectively (Fig EV1B).
Figure 1. LINC00941 acts as a negative regulator of keratinocyte differentiation.
-
AqRT–PCR analysis of LINC00941 repression during keratinocyte differentiation in primary keratinocyte cultures from three different donors compared to undifferentiated keratinocytes (D0) (n = 6 biological replicates). Data are presented as mean ± SD.
-
B, CsiPool‐mediated LINC00941 knockdown (B) in calcium‐induced keratinocyte differentiation results in increased abundance of early and late differentiation marker transcripts on day 3 of differentiation (C) (n = 3 biological replicates/knockdown group). Data are presented as mean ± SD. Statistical significance was tested by an unpaired t‐test and corrected for multiple testing after Bonferroni (*adj. P‐value < 0.05, **adj. P‐value < 0.01).
-
D, ELINC00941 knockdown in day 3 (D3) organotypic epidermal tissue cultures (D) results in increased expression of key differentiation genes (E) (n = 3–4 tissue cultures/knockdown group). Data are presented as mean ± SD. Statistical significance was tested by an unpaired t‐test and corrected for multiple testing after Bonferroni (*adj. P‐value < 0.05, **adj. P‐value < 0.01, ***adj. P‐value < 0.001).
-
FImmunofluorescence analysis shows increased levels of early and late differentiation proteins. Collagen VII (col VII, green) stain indicates the basement membrane, nuclei are shown in blue, and the differentiation proteins keratin 10 and loricrin are shown in red (n = 3–4 tissue cultures/knockdown group; one exemplary picture for each group is depicted). Scale bar: 50 μm.
Figure EV1. Coding potential of LINC00941 and validation of RNA‐Seq results.
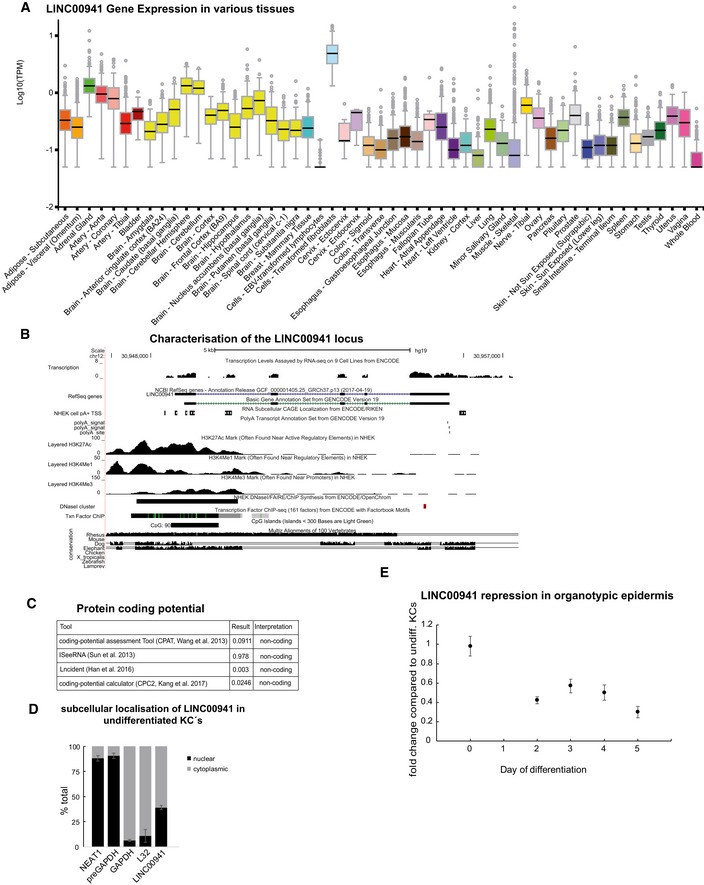
- Utilization of the GTEx Portal to access the expression of LINC00941 in various tissues. Boxplot displaying the distribution of log10 transformed TPM. Mid‐line represents median. Whiskers display the upper and lower extreme.
- UCSC view showing the genomic locus of LINC00941 with two different Isoforms. Transcription start sites and poly‐A sites as well as chromatin marks are included.
- Usage of different bioinformatical algorithms to investigate the protein‐coding potential of LINC00941.
- qRT–PCR analysis for LINC00941 subcellular localization in undifferentiated keratinocytes (D0) (n = 3 biological replicates). Data are presented as mean ± SD.
- qRT–PCR analysis of LINC00941 repression during keratinocyte differentiation organotypic epidermal tissue compared to undifferentiated keratinocytes (D0) (n = 3 biological replicates). Data are presented as mean ± SD.
To verify the annotation of LINC00941 as a long non‐coding RNA, we utilized Coding‐Potential Assessment Tool (CPAT 11, iSeeRNA 12, Lncident 13, and Coding Potential Calculator CPC2 14) to assess the coding potential of the nucleotide sequences (Fig EV1C). We could confirm lack of protein‐coding potential with either of the algorithms used, strongly indicating that LINC00941 solely acts as a long non‐coding RNA (Fig EV1C). Cellular fractionation of undifferentiated human keratinocytes indicated presence of LINC00941 in both cytoplasmic and nuclear compartments, with an increased nuclear enrichment compared to mRNAs (Fig EV1D). To assess LINC00941 localization in epidermal tissue, we measured LINC00941 abundance at different time points of organotypic epidermal tissue regeneration. In agreement with LINC00941 dynamic regulation during keratinocyte differentiation, we observed highest LINC00941 abundance at day zero of epidermis development (Fig EV1E).
LINC00941 prevents premature differentiation of human keratinocytes
Since LINC00941 abundance decreases upon keratinocyte differentiation, we postulated a role for this lncRNA in non‐ or poorly differentiated strata of the epidermis. To test this hypothesis, we generated LINC00941‐deficient keratinocytes by transfection of a pool of 30 siRNAs and found that loss of LINC00941 resulted in an increased abundance of mRNA levels for early and late differentiation genes, suggesting a functional relevance of LINC00941 in preventing premature progression of the terminal differentiation program (Fig 1B and C).
To analyze the impact of LINC00941 on the homeostatic balance of human epidermal tissue, we generated LINC00941‐deficient human organotypic epidermis and compared it with matching control tissue (Fig 1D). Similar to results observed with primary keratinocytes, LINC00941‐deficient organotypic epidermis differentiated prematurely, as indicated by increased mRNA and protein abundances of keratin 10, crucial for early differentiation, as well as late differentiation genes SPRR4 and Loricrin (Fig 1E and F). These results indicate an important role for LINC00941 in repressing premature keratinocyte differentiation in cells and human epidermal tissue.
LINC00941 regulates transcript abundance of early and late differentiation genes
To probe the global impact of LINC00941 deficiency on gene expression during human epidermal homeostasis, we performed whole transcriptome sequencing analysis of LINC00941‐depleted as well as control organotypic epidermis (Fig 2A and B) at days 2 and 3 after onset of epidermal homeostasis and identified 240 and 314 genes, respectively, that were deregulated upon LINC00941 loss (Figs 2C and EV2A–C, Dataset EV1A and B). Gene ontology (GO) term analysis of deregulated genes in LINC00941‐deficient tissue showed strong enrichment of genes involved in processes crucial for epidermal differentiation, such as keratinization, keratinocyte differentiation, generation of a cornified envelope, and peptide cross‐linking (Figs 2D and EV2B). These findings provide further evidence for a role of LINC00941 in repressing the epidermal differentiation program. To investigate potential hot spots of LINC00941‐regulated genes across the human genome, we analyzed enrichment of LINC00941‐altered genes compared to the relative distribution of Ensembl genes across all human chromosomes. The strongest enrichment could be detected on chromosome one (Fig EV2D), with a significant accumulation of altered genes in the epidermal differentiation complex (1q21.3; EDC; Fig 3A). The EDC spans 1.9 Mb and harbors roughly sixty genes, many of which coding for proteins involved in keratinocyte differentiation and epidermal barrier formation 15, 16. Correspondingly, 28 well‐characterized genes crucial for epidermal differentiation located within the EDC show premature expression in LINC00941‐depleted epidermal tissue (Fig 2C). These include Loricrin, SPRR4, and 16 out of 18 LCE genes. Thus, LINC00941 is capable of repressing key differentiation genes and preventing premature onset of differentiation in human epidermal tissue.
Figure 2. LINC00941 is a suppressor of keratinocyte differentiation.
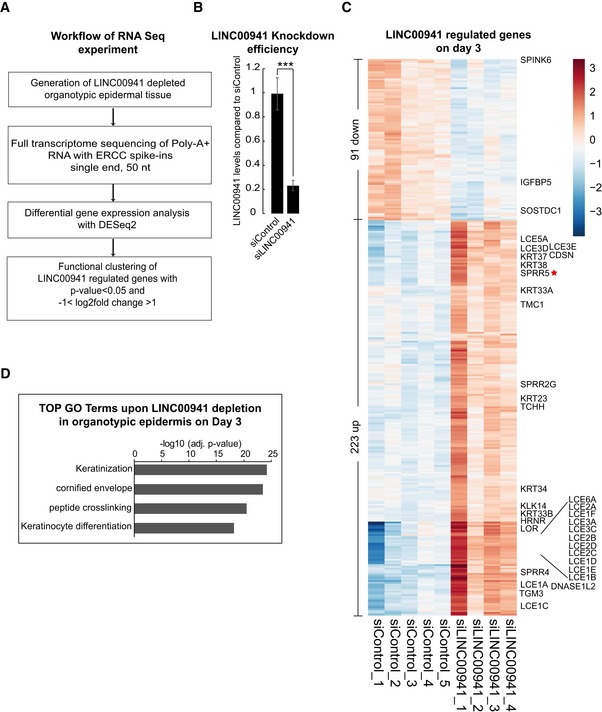
- Workflow of the performed RNA‐sequencing experiment.
- LINC00941 knockdown efficiency (siLINC00941) in epidermal tissue on day 3 of differentiation as obtained by qRT–PCR measurements (n = 4–5 epidermal tissue cultures/knockdown group). Data are presented as mean ± SD. Statistical significance was tested by an unpaired t‐test and corrected for multiple testing after Bonferroni (***adj. P‐value < 0.001).
- Heatmap of differentially expressed genes (P adj < 0.05 and −1 > log2FC > 1) upon LINC00941 depletion on day 3 in organotypic epidermal tissue with marked keratinocyte differentiation genes (n = 4–5 epidermal tissue cultures/knockdown group).
- GO term analysis of downregulated (P adj < 0.05 and −1 > log2FC < 1) genes in LINC00941‐deficient organotypic epidermal tissue on day 3 (n = 4–5 epidermal tissue cultures/knockdown group).
Figure EV2. RNA‐Seq validation of LINC00941 depletion.
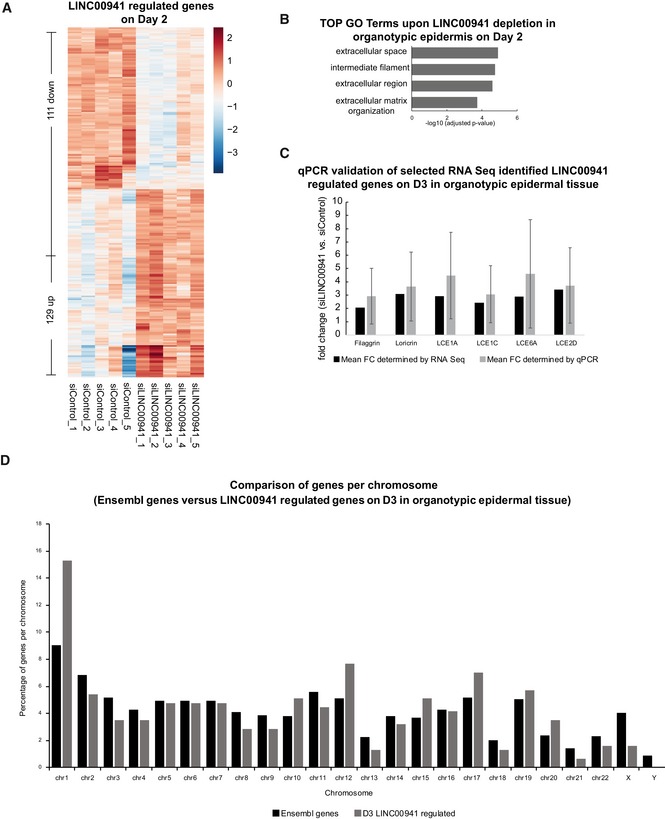
- Heatmap of differentially expressed genes (P adj < 0.05 and −1 > log2FC > 1) upon LINC00941 depletion on day 2 in organotypic epidermal tissue with marked keratinocyte differentiation genes (n = 5 epidermal tissue cultures/knockdown group).
- GO term analysis of downregulated (P adj < 0.05 and −1 > log2FC < 1) genes in LINC00941‐deficient organotypic epidermal tissue on day 2 (n = 5 epidermal tissue cultures/knockdown group).
- qRT–PCR validation of the obtained RNA‐Seq results for the expression of selected genes on day 3 in LINC00941‐depleted organotypic epidermal tissue (n = 4–5 epidermal tissue cultures/knockdown group). Data are presented as mean ± SD.
- Comparison of the genomic localization of LINC00941‐regulated genes (P adj < 0.05 and −1 > log2FC > 1) on day 3 (D3) and distribution of Ensembl genes per chromosome (n = 4–5 epidermal tissue cultures/knockdown group).
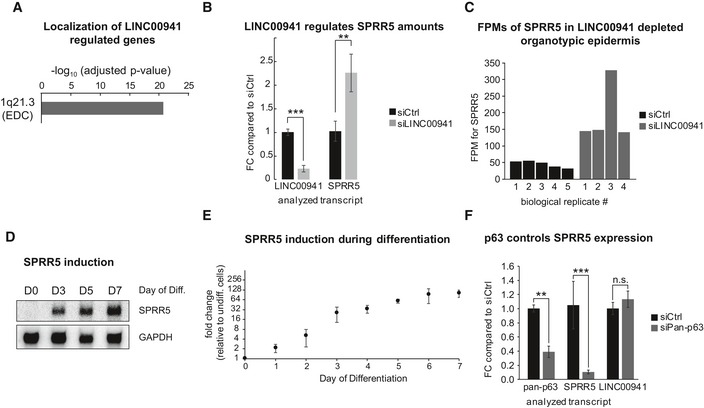
Figure 3. LINC00941 and p63 control SPRR5, which is induced during differentiation and different from other human SPRRs.
-
ADifferentially expressed genes in day 3 LINC00941‐depleted epidermal tissue cluster within the epidermal differentiation complex (EDC) (n = 4–5 biological replicates/knockdown group).
-
BLINC00941 knockdown on day 3 in calcium‐induced keratinocyte differentiation cultures results in increased expression of SPRR5 (FC = fold change; n = 3 biological replicates/knockdown group). Data are presented as mean ± SD. Statistical significance was tested by an unpaired t‐test and corrected for multiple testing after Bonferroni (**adj. P‐value < 0.01, ***adj. P‐value < 0.001).
-
CDetected fragments per million (FPM) for SPRR5 in control (siCtrl) as well as LINC00941‐deficient (siLINC00941) epidermal tissue for all biological replicates on day 3 (D3) of differentiation as obtained by DeSeq2 (FC = fold change; n = 4–5 epidermal tissue cultures/knockdown group).
-
D, EPRR5 induction during the course of keratinocyte (KC) differentiation is shown by northern blot (D) as well as by qRT–PCR analysis (E) for four different primary keratinocyte isolates and compared to undifferentiated keratinocytes (n = 8 biological replicates). Data are presented as mean ± SD.
-
Fp63 knockdown on day 3 of keratinocyte differentiation leads to decreased SPRR5 transcript levels (FC = fold change; n = 3–4 biological replicates/knockdown group). Data are presented as mean ± SD. Statistical significance was tested by an unpaired t‐test and corrected for multiple testing after Bonferroni (*adj. P‐value < 0.05, **adj. P‐value < 0.01, ***adj. P‐value < 0.001, and n.s. = not significant).
SPRR5 is a LINC00941‐ and p63‐regulated uncharacterized gene induced in keratinocyte differentiation
In addition to well‐characterized early and late differentiation genes, LINC00941 deficiency led to induced expression of an uncharacterized gene locus comprising the long non‐coding RNA LINC01527, as well as the recently annotated SPRR5 transcript, which is located within the EDC, 35‐kb downstream of Involucrin and 21‐kb upstream of the small proline‐rich protein gene cluster (Fig EV3A). Interestingly, a significant induction of SPRR5 (but not LINC01527) could be detected in all biological replicates used in the transcriptome sequencing analysis and was confirmed in qRT–PCR analysis of LINC00941 deficient vs. control tissue (Fig 3B and C).
Figure EV3. SPRR5 transcript characterization.
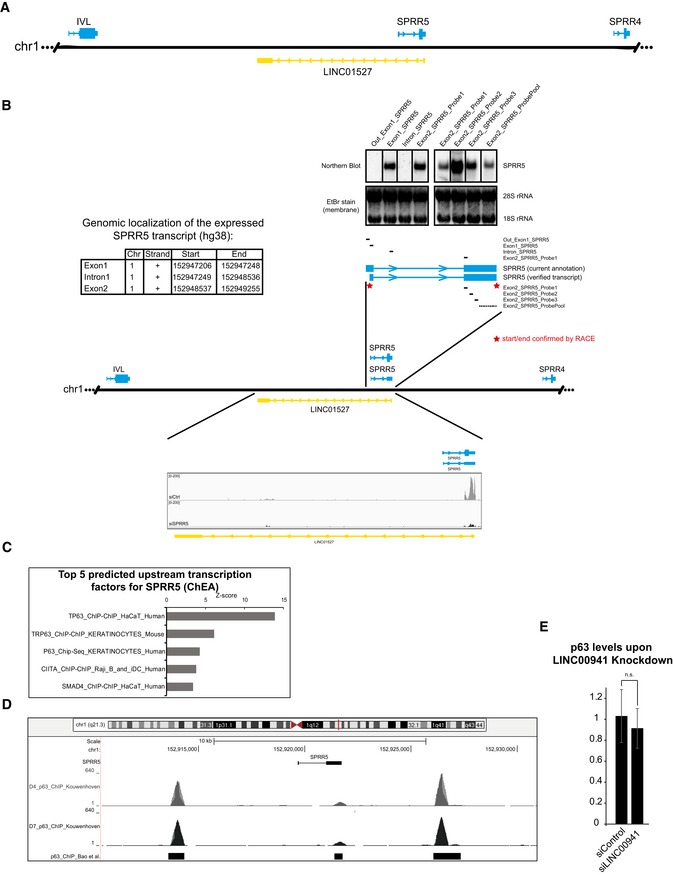
- Schematic overview of the genomic localization of SPRR5.
- Exact genomic coordinates for the verified SPRR5 transcript (genome release: hg38) and exemplary pictures of aligned and mapped RNA‐Seq reads for control (siCtrl) and SPRR5 knockdown (siSPRR5) with respect to LINC01527 (lower part). The top part indicates the localization of the utilized probes for northern blot mapping as well as the results from hybridization of membranes with RNA from differentiated keratinocytes. Furthermore, the verified transcript and the Ensembl annotated version are shown and red stars indicate the RACE (rapid amplification of cDNA ends) verification of start and end points of the transcript.
- Upstream transcription factor predictions for SPRR5 obtained by ARCHS4.
- UCSC view showing the genomic locus of SPRR5 as well as the p63 ChIP‐Seq peaks from studies by Kouwenhoven et al and Bao et al.
- Knockdown of LINC00941 does not affect pan‐p63 levels in human epidermal tissue (n = 3–4 epidermal tissue cultures/knockdown group). Data are presented as mean ± SD.
Employing northern blot as well as qRT–PCR analysis, we found SPRR5 expression to be barely detectable in non‐differentiated, primary human keratinocytes. Upon onset of epidermal differentiation however, SPRR5 abundance was strongly increased, with the highest levels at late differentiation stages (Fig 3D and E). For in‐depth characterization of the SPRR5 gene locus, we performed a combination of northern blot mapping and rapid amplification of cDNA ends (RACE) analysis and found that the SPRR5 transcript in human primary keratinocytes does not match the recent Ensembl annotation. Instead, we could verify a shorter transcript with a length of 762 nucleotides, consisting of two exons (Figs EV3B and EV4A). The annotated lncRNA LINC01527, located in antisense direction to SPRR5, showed no detectable expression with all detection methods employed in this study. In order to identify additional regulators of SPRR5 expression, computational predictions of upstream transcription factors for SPRR5 were performed. We observed strong enrichment of p63 (Fig EV3C), a transcription factor known to act as a master regulator of human and mouse epidermal homeostasis 17, 18, 19. P63 is well known to act is an important regulator of epidermal commitment, keratinocyte proliferation, and also of differentiation 19, 20, 21, 22. Correspondingly, ChIP sequencing analyses published recently 20, 21 indicated sites of p63 occupancy 5 kb upstream and 4 kb downstream of the SPRR5 gene locus (Fig EV3D). To test whether SPRR5 expression might indeed be regulated by p63, we knocked down p63 in differentiated human keratinocytes and observed a strong reduction of SPRR5 transcript abundance by 91%. Interestingly, knockdown of p63 did not significantly affect abundance of LINC00941, suggesting that LINC00941 is transcriptionally regulated independently of p63 (Fig 3F). Additionally, knockdown of LINC00941 in human epidermal tissue does not affect p63 (Fig EV3E). Together, these findings show that SPRR5 is controlled by the transcription factor p63 and prematurely induced in LINC00941‐deficient human organotypic epidermis.
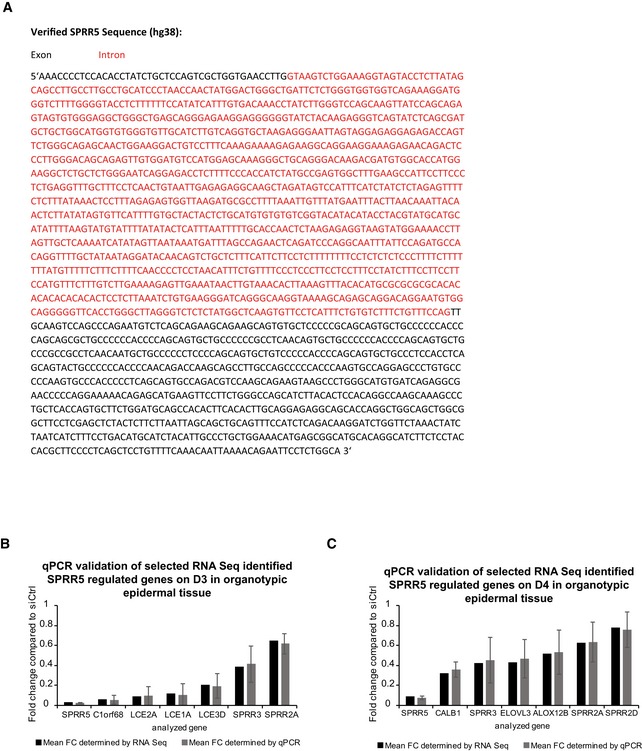
Figure EV4. Sequence of the human SPRR5 transcript and validation of RNA‐Seq results.
-
AThe SPRR5 sequence as well as the exon (black)/intron (red) structure of the human SPRR5 transcript are shown.
-
B, CqRT–PCR validation of the obtained RNA‐Seq results for selected genes on day 3 (D3; B) or day 4 (D4; C) in SPRR5‐depleted organotypic epidermal tissue (n = 3–5 epidermal tissue cultures/knockdown group). Data are presented as mean ± SD.
SPRR5 is essential for human epidermal differentiation
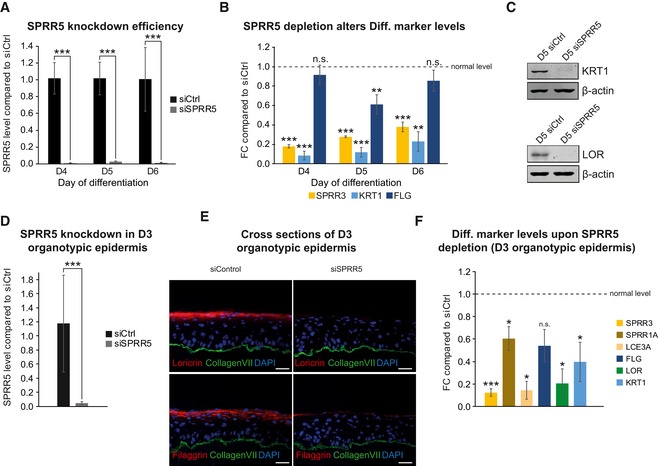
To analyze a potential functional impact of SPRR5 on epidermal differentiation, we depleted SPRR5 in human keratinocytes with a siRNA pool and measured mRNA and protein abundances of key differentiation genes at days 4, 5, and 6 of keratinocyte differentiation using qRT–PCR and Western blot analysis. Interestingly, SPRR5 deficiency led to a decreased expression of early and late differentiation genes during all time points analyzed (Fig 4A–C). In order to verify the observed functional impact of SPRR5 in a mature human tissue environment, we generated SPRR5‐deficient human organotypic epidermis. Similar to results seen with primary keratinocytes, SPRR5‐deficient epidermal tissue displays defective differentiation as seen by reduced levels of a plethora of early and late differentiation mRNAs and proteins (Fig 4D–F).
Figure 4. SPRR5 is indispensable for proper keratinocyte differentiation.
-
A–CsiPool‐mediated SPRR5 knockdown on day 4 to day 6 (D4–D6) of calcium‐induced keratinocyte differentiation (A) leads to decreased expression of key differentiation markers as shown by qRT–PCR (B) (FC = fold change) as well as Western blot analysis (C) (n = 3–5 cultures/knockdown group). Data are presented as mean ± SD. Statistical significance was tested by an unpaired t‐test and corrected for multiple testing after Bonferroni (**adj. P‐value < 0.01, ***adj. P‐value < 0.001, and n.s. = not significant).
-
DSPRR5 knockdown efficiency in day 3 (D3) organotypic epidermal tissue (n = 4 epidermal tissue cultures/knockdown group). Data are presented as mean ± SD. Statistical significance was tested by an unpaired t‐test and corrected for multiple testing after Bonferroni (***adj. P‐value < 0.001).
-
ESPRR5 depletion in regenerated organotypic epidermal tissue results in drastically reduced expression of differentiation proteins as shown by immunofluorescence analysis. Collagen VII (Col VII, green) stain indicates the basement membrane, nuclei are shown in blue, and the differentiation proteins filaggrin and loricrin are shown in red (n = 4 tissue cultures/knockdown group; one exemplary picture for each group is depicted). Scale bar: 50 μm.
-
FSPRR5 knockdown in regenerated epidermal tissue results in reduced transcript levels of key differentiation genes as obtained by qRT–PCR (n = 4 epidermal tissue cultures/knockdown group). Data are presented as mean ± SD. Statistical significance was tested by an unpaired t‐test and corrected for multiple testing after Bonferroni (*adj. P‐value < 0.05, ***adj. P‐value < 0.001, and n.s. = not significant).
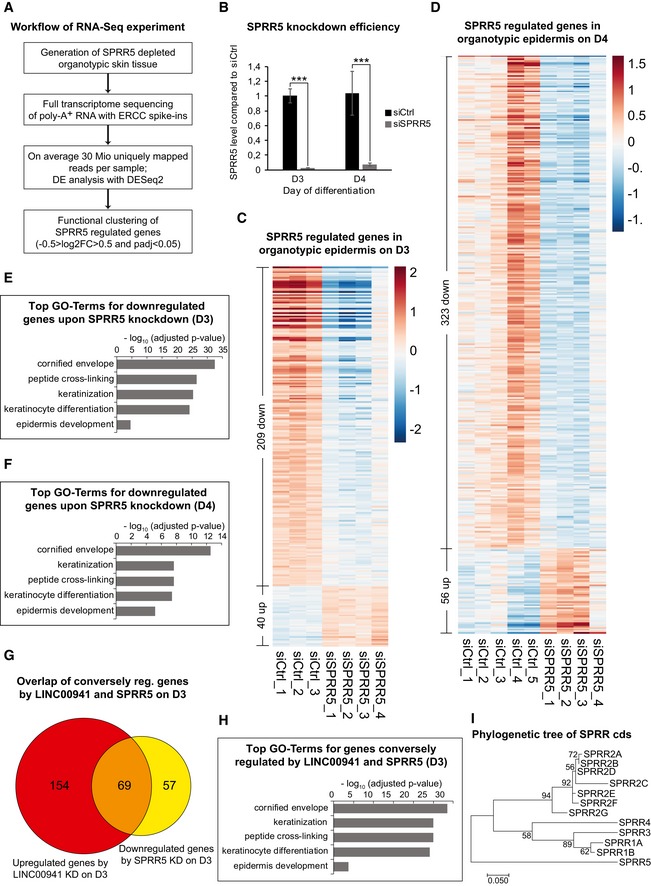
For a more comprehensive insight on the functional impact of this previously uncharacterized molecule on epidermal homeostasis, we performed full transcriptome sequencing with RNA isolated from SPRR5‐deficient and control organotypic epidermis at two different time points of tissue growth (Fig 5A and B). SPRR5 depletion resulted in abnormal abundance of 249 and 379 transcripts at days 3 and 4 of epidermal regeneration, respectively (Figs 5C and D, and EV4B and C, Dataset EV1C and D). Furthermore, the top five gene ontology terms of transcripts downregulated in SPRR5‐deficient tissue were keratinocyte differentiation, keratinization, cornified envelope, epidermis development, and peptide cross‐linking—all representing key processes of terminal differentiation (Fig 5E and F). As we mapped all SPRR5‐regulated genes to the human genome, we observed a strong enrichment within the EDC where over 50% of genes exhibited altered expression after SPRR5 depletion. In summary, these data suggest a crucial role for SPRR5 in regulating and maintaining the terminal differentiation program in human epidermal tissue by inducing genes strongly associated with epidermal differentiation, many of which are located within the EDC.
Figure 5. SPRR5 controls the keratinocyte differentiation program on a global level.
-
AWorkflow of the performed RNA‐sequencing experiment (DE = differentially expressed, log2FC = log2(fold change), P adj = adjusted P‐value).
-
BOverview of SPRR5 levels in control (siCtrl) and SPRR5‐deficient (siSPRR5) epidermal tissue on day 3 and day 4 as obtained by qRT–PCR analysis (n = 3–5 epidermal tissue cultures/knockdown group). Data are presented as mean ± SD. Statistical significance was tested by an unpaired t‐test and corrected for multiple testing after Bonferroni (***adj. P‐value < 0.001).
-
C, DHeatmaps of differentially expressed genes (P adj < 0.05 and −0.5 > log2FC > 0.5) upon SPRR5 depletion on day 3 (C) or day 4 (D) in organotypic epidermal tissue (n = 3–5 epidermal tissue cultures/knockdown group).
-
E, FGO term analysis of downregulated (P adj < 0.05 and −0.5 > log2FC) genes in SPRR5‐deficient organotypic epidermal tissue on day 3 (E) and day 4 (F) (n = 3–5 epidermal tissue cultures/knockdown group).
-
GVenn diagram of genes that are upregulated (P adj < 0.05 and log2FC > 1) after LINC00941 depletion (red) and downregulated (P adj < 0.05 and −1 > log2FC) in SPRR5‐deficient (yellow) organotypic epidermal tissue on day 3 (n = 3–5 epidermal tissue cultures/knockdown group).
-
HGO term analysis of genes conversely (upregulated in LINC00941‐deficient and downregulated in SPRR5‐deficient samples) regulated by LINC00941 and SPRR5 in day 3 epidermal tissue (n = 3–5 epidermal tissue cultures/knockdown group).
-
IPhylogenetic analysis of all known human SPRR coding sequences (cds) by means of a maximum‐likelihood approach. The length of the horizontal bar indicates 0.05 mutations/site. Sequence similarity suggests a common ancestor of all SPRRs, but a distinct composition of SPRR5.
LINC00941 prevents premature differentiation partially through inhibition of SPRR5
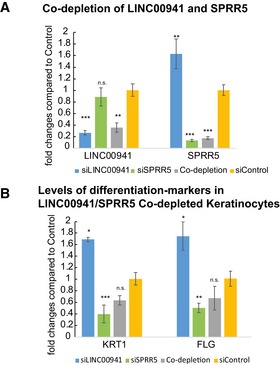
Our findings indicate that LINC00941 represses premature differentiation in weakly differentiated strata, while SPRR5 promotes terminal differentiation of human epidermal tissue. To investigate whether the lncRNA LINC00941 and SPRR5 conversely regulate a common set of genes, we analyzed the overlap between transcripts induced upon LINC00941 depletion (223 in total) and mRNAs downregulated in SPRR5‐deficient tissue (Fig 5G and Dataset EV1E). Interestingly, 54.8% (69 from a total of 126) of genes repressed in SPRR5‐deficient epidermal tissue were induced in LINC00941‐depleted organotypic epidermis, including many members of the human LCE gene family. GO term analysis of conversely regulated genes resulted in enrichment of epidermal differentiation processes, indicating that premature induction of differentiation in LINC00941‐deficient epidermis appears to be caused—at least in part—by de‐repression of SPRR5 (Fig 5H). To get further insight into the interrelationship between LINC00941 and SPRR5, we co‐depleted both molecules in human keratinocytes at day 3 of differentiation and measured levels of several mRNAs that were inversely regulated upon single depletion of either LINC00941 or SPRR5. Interestingly, we found that double depletion of both LINC00941 and SPRR5 led to reduced levels of keratin 1 and filaggrin (Fig EV5A and B). These data suggest that LINC00941‐mediated repression of differentiation might indeed at least in part be mediated by repression of SPRR5. Taking into account that co‐depletion of both LINC00941 and SPRR5 resulted in a reduction of differentiation gene expression to levels approaching the effects seen in SPRR5 depletion, one could hypothesize that SPRR5 levels need to be tightly regulated in weakly differentiated strata of the epidermis. This process appears to be controlled—at least in part—by LINC00941.
Figure EV5. Co‐depletion of LINC00941 and SPRR5.
-
A, BsiPool‐mediated LINC00941, SPRR5 knockdown, and co‐depletion of LINC00941 and SPRR5 on day 3 (D3) of calcium‐induced keratinocyte differentiation (n = 3 biological replicates/knockdown group). Data are presented as mean ± SD. Statistical significance was tested by an unpaired t‐test and corrected for multiple testing after Bonferroni (*adj. P‐value < 0.05, **adj. P‐value < 0.01, ***adj. P‐value < 0.001, and n.s. = not significant).
Interestingly, SPRR5 was only recently annotated as a predicted protein. Its novel gene identifier (SPRR5), localization downstream of the SPRR gene cluster as well as the general existence of repetitive proline‐rich sequences suggest functional similarity of SPRR5 to other SPRR proteins which act as structural proteins involved in the formation of the cornified envelope. However, to our knowledge, depletion of none of the previously known SPRR proteins resulted in significant phenotypic abnormalities of the murine epidermal differentiation program. In contrast to this, we were able to show that SPRR5 deficiency leads to a highly impaired differentiation pattern in epidermal tissue. To approach this discrepancy between observed phenotypic effects of SPRR5 and predicted functional similarity to other SPRRs, we analyzed evolutionary relationships among all human SPRR proteins and SPRR5 generating a phylogenetic tree. Interestingly, SPRR5 did not cluster in one of the two SPRR subfamilies but lies isolated (Fig 5I). These findings suggest that phylogenetically as well as functionally, SPRR5 drastically differs from other members of the human SPRR family by operating as a crucial regulator of human epidermal differentiation. Furthermore, SPRR5 appears to act downstream of LINC00941 which exerts at least parts of its function for epidermal homeostasis by repressing SPRR5 in weakly differentiated strata of the human epidermis. Based on our observation of inverse regulation of LINC00941 and SPRR5 in epidermal homeostasis, we analyzed regulation of both molecules in basal and squamous cell carcinoma and in psoriasis using publicly available RNA‐Seq datasets as described in the Method section (Dataset EV2). This analysis suggested converse regulation of LINC00941 and SPRR5, which is in agreement with the proposed suppression of SPRR5 by LINC00941 and highlights the importance of both molecules for maintaining a proper epidermal homeostasis. While the modes of action of LINC00941‐ and SPRR5‐mediated regulation of skin homeostasis remain unclear, we observed increased nuclear enrichment of LINC00941 compared to mRNAs and identified a role in repressing premature activation of LCE and SPRR gene clusters. These findings might suggest a potential role of LINC00941 in trans as a transcriptional regulator of these two gene clusters, including the SPRR5 gene. Nevertheless, significant amounts of LINC00941 were also detected in the cytoplasm. While more work is needed to illuminate the mode of action of LINC00941, the data at hand show clear differences to ANCR and TINCR, two other lncRNAs involved in regulation of human epidermal homeostasis. In contrast to LINC00941, TINCR was shown to be enriched in highly differentiated strata of the epidermis and plays a role as a positive regulator of epidermal differentiation. ANCR, on the other hand, showed an enrichment in non‐differentiated keratinocytes, similar to LINC00941. However, ANCR appears to play a role in maintaining the epidermal progenitor state, likely by mediating epigenetic repression of transcription factors MAF and MAFB 8. Based on the data shown here, LINC00941 might play an important role in weakly differentiated keratinocytes of human epidermis, likely repressing premature differentiation by modulating SPRR5 abundance. Therefore, all three lncRNAs appear to have distinct roles and modes of action in the regulation of human epidermal homeostasis.
In conclusion, these results shed light onto another aspect of the highly complex regulatory network of epidermal homeostasis, which might be crucial for comprehending epidermis development and the molecular basis of skin diseases.
Materials and Methods
Tissue culture
Pooled primary human keratinocytes from different donors were obtained from PromoCell (Lot.No.: 1020401, 1040101, and 407Z001) or Lonza (Lot.No.: 0000402834) and grown in a 1:1 mixture of KSF‐M (Gibco) and Medium 154 for keratinocytes (Gibco), supplemented with Human Keratinocyte Growth Supplement, epidermal growth factor, bovine pituitary extract, and 1× Antibiotic‐Antimycotic (all supplements from Gibco). Cells were cultured at 37°C in a humidified chamber with 5% CO2. In vitro keratinocyte differentiation was induced by raising the calcium concentration in the medium to 1.2 mM and seeding cells at full confluency.
RNA knockdown
siRNA pools of 11–30 different siRNAs, combining potent on‐target gene silencing with negligible off‐target effects, were synthesized and obtained from siTOOLs 23. Pan‐p63 siRNAs (sense: 5′cgacagucuuguacaauuu3′, antisense: 5′aaauuguacaagacugucg3′) and siRNA Control (sense: 5′guagauucauauuguaagg3′, antisense: 5′ccuuacaauaugaaucuac3′) were purchased from biomers.net and annealed in annealing buffer (30 mM HEPES, 2 mM MgAc, 100 mM KAc) by heating to 95°C for 3 min followed by 1‐h incubation at 37°C. For siRNA transfer, 5–6 million primary human keratinocytes were electroporated with 1 nmol annealed siRNAs or siPools, respectively, using the Amaxa human keratinocyte Nucleofector kit (Lonza) according to the manufacturer's instructions and the program T‐018 of the Amaxa Nucleofector II device. Co‐depletion experiments were performed with a total of 2 nmol siRNA. After nucleofection, cells recovered for 12–24 h.
Organotypic human epidermal tissue
For the generation of organotypic human epidermal tissue, 500,000 human keratinocytes that have been nucleofected with siRNAs were seeded onto a devitalized dermal matrix and raised to the air–liquid interface to initiate stratification and differentiation, as described previously 19, 24.
Immunofluorescence and tissue analysis
Seven micrometer thick cross sections of human organotypic skin cultures were fixed in either 100% acetone, ethanol, or methanol for 10 min at −20°C followed by blocking in PBS with 10% bovine calf serum (BCS) for 20 min at RT. Antibodies were diluted in PBS with 1% BCS and incubated with the sections for 1 h or overnight. Primary antibodies included the following: collagen type VII (Calbiochem, 234192 for rabbit; Merck Millipore, MAB1345 for mouse) at 1:400 (rabbit) or 1:800 (mouse) dilution, filaggrin (Santa Cruz, sc‐66192) at 1:50 dilution, keratin 10 (NeoMarkers, MS‐611‐P) at 1:400 dilution, and loricrin (Covance, PRB‐145P) at 1:800 dilution. Alexa‐555‐conjugated goat anti‐mouse and goat anti‐rabbit IgG (Molecular Probes, 1:300 dilution), and Alexa‐488‐conjugated goat anti‐rabbit and goat anti‐mouse IgG (Molecular Probes, 1:300 dilution) were used as secondary antibodies. Unbound antibodies were washed off with PBS (three times, 5 min, RT), and nuclei were stained with 4 mg/l Hoechst 33342 (Thermo Fisher Scientific, H1399) in PBS. Finally, slides were mounted in ProLong Gold Antifade Mountant (Thermo Fisher Scientific) and analyzed with an Axiovert 200M fluorescence microscope and the AxioVision Software (Carl Zeiss).
Western blot
Protein lysates from in vitro differentiated keratinocytes were obtained by scraping cells into a suitable amount of RIPA buffer and snap‐freezing. Lysates were cleared for 15 min, full speed, 4°C, and the protein concentration was determined via Bradford assay. Thirty micrograms of total protein was separated on a 10% SDS–PAGE and transferred onto the Amersham Hybond ECL membrane by semi‐dry blot. Blocking and antibody dilution was done in 5% milk in TBS‐T. Primary antibodies included keratin 1 (Covance, PRB‐149P) at 1:1,000 dilution, loricrin (Covance, PRB‐145P) at 1:1,000 dilution, and β‐actin (Abcam, ab6276) at 1:10,000 dilution. Secondary antibodies utilized were IRDye 800CW goat anti‐rabbit and IRDye 680 goat anti‐mouse (PN 926‐32220), both at a 1:15,000 dilution. Signals were analyzed with the Odyssey Infrared Imager (LI‐COR Biosciences).
qRT–PCR analysis
Total RNA from keratinocytes was isolated with TRIzol (Invitrogen) according to the manufacturer's instructions and quantified by NanoDrop. Total RNA from organotypic skin cultures was isolated using the RNeasy Plus mini kit (Qiagen) according to the manufacturer's instructions. One microgram total RNA was subjected to reverse transcription with the iScript cDNA synthesis kit (Bio‐Rad). For RNA isolated with TRIzol, genomic DNA was removed using DNAse I (Thermo Fisher Scientific) prior to cDNA synthesis. For qRT–PCR measurements, SsoFast EvaGreen (Bio‐Rad) or the Takyon Mix (Eurogentec) was used with the CFX96 Touch Real‐Time PCR Detection System (Bio‐Rad). Samples were run at least in duplicates and normalized to ribosomal protein L32 mRNA. Statistical significance was tested by an unpaired t‐test and corrected for multiple testing after Bonferroni et al (*adj. P‐value < 0.05, **adj. P‐value < 0.01, ***adj. P‐value < 0.001, and n.s. = not significant). For a list of primer sequences see Table 1.
Table 1.
List of utilized qRT–PCR primers
| Name | Sequence (5′–3′) |
|---|---|
| L32_F | AGGCATTGACAACAGGGTTC |
| L32_R | GTTGCACATCAGCAGCACTT |
| SPRR5_F | AGCAGCTGCAGTTTCCATCT |
| SPRR5_R | AAACAGGAGCTGAGGGGAAG |
| Pan‐p63_F | GACAGGAAGGCGGATGAAGATAG |
| Pan‐p63_R | TGTTTCTGAAGTAAGTGCTGGTGC |
| FLG_F | AAAGAGCTGAAGGAACTTCTGG |
| FLG_R | AACCATATCTGGGTCATCTGG |
| LOR_F | CTCTGTCTGCGGCTACTCTG |
| LOR_R | CACGAGGTCTGAGTGACCTG |
| KRT1_F | TGAGCTGAATCGTGTGATCC |
| KRT1_R | CCAGGTCATTCAGCTTGTTC |
| KRT10_F | GCAAATTGAGAGCCTGACTG |
| KRT10_R | CAGTGGACACATTTCGAAGG |
| SPRR1A_F | CAGCCCATTCTGCTCCGTAT |
| SPRR1A_R | GGCTGGCAAGGTTGTTTCAC |
| SPRR2A_F | ACACAGGGAGCTTCTTTCTCC |
| SPRR2A_R | CCAGGACTTCCTTTGCTCAGT |
| SPRR2D_F | TCGTTCCACAGCTCCACTTG |
| SPRR2D_R | CAGGCCACAGGTTAAGGAGA |
| SPRR3_F | CCTCGACCTTCTCTGCACAG |
| SPRR3_R | GGTTGTTTCACCTGCTGCTG |
| LCE1A_F | GAAGCGGACTCTGCACCTAGAA |
| LCE1A_R | AGGAGACAGGTGAGGAGGAAATG |
| LCE 1E_F | TGAAGTGGACCTTGACTTCCTC |
| LCE 1E_R | CTCCAGGCAAGACTTCAAGC |
| LCE2A_F | TGGAGAAACTTGCAACCAGGA |
| LCE2A_R | CCTCACAAGGTGTGTCAGCC |
| LCE2D_F | GGACGTGTCTGTGCTTTTGC |
| LCE2D_R | CTTGGGAGGACATTTGGGAGG |
| LCE3A_F | TGTCTGCCTCCAGCTTCCT |
| LCE3A_R | AGTTGGAGCTCTGGCAACG |
| LCE3D_F | TCTTGATGCATGAGTTCCCAGA |
| LCE3D_R | TGGACATCAGACAGGAAGTGC |
| LCE4A_F | CCCCCTCCCAAGTGTCCTAT |
| LCE4A_R | GAGCCACAGCAGGAAGAGAT |
| LCE5A_F | CCCAGGTGCTGAAGATGTGT |
| LCE5A_R | ATGGAGTGAACATGGGCAGG |
| LCE6A_F | GTCCTGATCTCTCCTCTCGTCT |
| LCE6A_R | CAAGATTGCTGCTTCTGCTGT |
| LINC00941_F | GACCTTTTCAGGCCAGCATT |
| LINC00941_R | ACAATCTGGATAGAGGGCTCA |
| Linc01527_F1 | GCCTCTCCTGCAAGTGTGA |
| Linc01527_R1 | TCCTCATTTATGACATTTTCAGTCTC |
| Linc01527_F2 | ACATGCCAGTGAAGTCTGTTCA |
| Linc01527_R2 | AGTCATGTGAGGCAGTTCCA |
| Linc01527_F3 | TCCCCCTACCTCTCATAGGC |
| Linc01527_R3 | AGATGAACAGACTTCACTGGCA |
| C1orf68_F | TTCTGGCCCCCTCTCTGTTA |
| C1orf68_R | GGGACTGTACTAACTCTGGC |
| CALB1_F | TGGCTTTGTCGGATGGAGGG |
| CALB1_R | GGTTGCGGCCACCAACTCTA |
| ELOVL3_F | TTCGAGGAGTATTGGGCAAC |
| ELOVL3_R | GAAGATTGCAAGGCAGAAGG |
| ALOX12B_F | AGACTGCAATTCCGGATCAC |
| ALOX12B_R | TGTGGAATGCACTGGAGAAG |
| NEAT1_F | TTGCATAGCTGAGCGAGCCC |
| NEAT1_R | CTGCTGCGGCCTATTCCTCC |
| GAPDH_F | GAAGAGAGAGACCCTCACTGCTG |
| GAPDH_R | ACTGTGAGGAGGGGAGATTCAGT |
| preGAPDH_F | CCAGACTGTGGGTGGCAGTG |
| preGAPDH_R | TGGCTGCAACTGAAGGCTCC |
Subcellular fractionation
Cell fractionation was performed as described 25 with modifications described below. All subsequent steps have been conducted on ice or at 4°C and in the presence of 50 units RiboLock RNase Inhibitor (ThermoFisher, EO0381) and Protease inhibitors cOmplete (Roche, 11873580001) according to manufacturer's instructions using RNase‐free equipment. After incubation with cytoplasmic lysis buffer for 10 min on ice, it was layered onto 500 μl sucrose buffer and centrifuged at 16,000 g for 10 min. The supernatant corresponding to the cytoplasmic fraction was carefully removed. The nuclei pellet was gently resuspended in nuclei wash buffer and centrifuged at 1,500 g for 1 min. The RNA was extracted as described before.
Quantification of RNA molecules per cell
An artificial RNA control was generated with the SP6 RNA Polymerase in vitro transcription system (NEB, M0207) according to manufacturer's instructions and quantified by NanoDrop. The reaction was carried out at 37°C for 2 h. Residual plasmid DNA was removed using DNAse I (Thermo Fisher Scientific) prior to cDNA synthesis. In vitro transcribed RNA was subjected to reverse transcription with the iScript cDNA synthesis kit (Bio‐Rad). The cDNA products were diluted in series to generate a standard curve ranging 103–106 copies. qPCR data analysis was performed essentially as described before with total RNA extracted from 1–5 × 10⁶ keratinocytes and recalculated to reflect single‐cell analysis.
Northern blot analysis
15–25 μg total RNA from keratinocytes in different differentiation states was separated on a formaldehyde agarose gel. After blotting the RNA onto Amersham Hybond‐N+ membrane and UV‐crosslink at 254 nm, the membrane was prehybridized at 40–50°C with 1 mg herring sperm DNA (Promega) in hybridization solution (5xSSC, 20 mM Na2HPO4, 7% SDS, 0.02% albumin fraction V, 0.02% Ficoll400, 0.02% polyvinylpyrrolidone K30). For transcript detection, 20 pmol antisense DNA‐oligos (see Table 2) was labeled in a 20 μl T4 PNK reaction (Thermo Fisher Scientific) with 20 μCi 32P, purified with a G‐25 column (GE Healthcare), and incubated with the prehybridized membrane overnight. After washing of the membrane (10 min each, 40–50°C, twice with 5× SSC and 1% SDS, and once with 1× SSC and 1% SDS), a phosphorimager screen was used to accumulate the radioactive signal, which was detected with the Personal Molecular Imager (Bio‐Rad).
Table 2.
Utilized probes for northern blot analysis
| Name | Sequence (5′–3′) |
|---|---|
| GAPDH #1 | CATGGACTGTGGTCATGAGTCCTTCCACGATACCAAAGTT |
| GAPDH #2 | GAATTTGCCATGGGTGGAATCATATTGGAACATGTAAACCATGTAGTTGAGG |
| Out_Exon1_SPRR5 | GATGCTCTGAGCCTATCTACCTTTTATATACCTCTCATCCCTGCCTGAGG |
| Exon1_SPRR5 | CAAGGTTCACCAGCGACTGGAGCAGATAGGTGTGGAGGGGTTT |
| Intron_SPRR5 | CCCACACTACTCTGCTGGATAACTTGCTGGACCCAAGATAGGTTTGTCAC |
| Exon2_SPRR5_Probe1 | CACACTGCTTCTGCTTCTGCTGAGACATTCTGGGCTGGACTTGCAACTGG |
| Exon2_SPRR5_Probe2 | CAAGGCTGCTTGGTCTGTTGGGGTGGGGGGCAGTAC |
| Exon2_SPRR5_Probe3 | GATCACATGCCCAGGGCTTACTTCTGCTTGGACGTCTGGCAC |
| Exon2_SPRR5_ProbePool_1 | TGTGGAGTGTAAGATGCTGG |
| Exon2_SPRR5_ProbePool_2 | AGAGTAGAGCTCGAGGAAGC |
| Exon2_SPRR5_ProbePool_3 | CAGGGCAATGTAGATGCATG |
| Exon2_SPRR5_ProbePool_4 | GCCAGAGGAATTCTGTTTTA |
| Exon2_SPRR5_ProbePool_5 | TGCTGGCCCAGAAGGAACTT |
| Exon2_SPRR5_ProbePool_6 | TGGTGAGCAGGGCTTTGCTT |
| Exon2_SPRR5_ProbePool_7 | TGTGGCTGCATCCAGAAGCA |
| Exon2_SPRR5_ProbePool_8 | CCTCTCCTGCAAGTGTGAAG |
| Exon2_SPRR5_ProbePool_9 | ACTGCAGCTGCTAATTAAGA |
| Exon2_SPRR5_ProbePool_10 | GATCCTTGTCTGAGATGGAA |
| Exon2_SPRR5_ProbePool_11 | CATGCCGCTCATGTTTCCAG |
| Exon2_SPRR5_ProbePool_12 | GGTAGGAGAAGATGCCTGTG |
Full transcriptome RNA sequencing
Organotypic epidermal tissue was harvested on days 2, 3, or 4, and RNA was isolated using the RNeasy Plus mini kit (Qiagen), according to the manufacturer's instructions. Library preparation and mRNA sequencing were carried out according to the Illumina TruSeq Stranded mRNA Sample Preparation Guide, the Illumina HiSeq 1000 System User Guide (Illumina), and the KAPA Library Quantification Kit—Illumina/ABI Prism User Guide (Kapa Biosystems), with minor modifications. In brief, mRNA molecules were purified using oligo‐dT probes immobilized on magnetic beads starting with 250 ng of total RNA supplied with ERCC spike‐ins 26. Chemical fragmentation of the mRNA to an average insert size of 200–400 bases was performed using divalent cations under elevated temperature (94°C, 4 min). First‐strand cDNA was produced by reverse transcription with random primers. Actinomycin D was added to improve strand specificity by preventing spurious DNA‐dependent synthesis. Blunt‐ended second‐strand cDNA was synthesized using DNA polymerase I, RNase H, and dUTP nucleotides. The resulting cDNA fragments were adenylated at the 3′ ends, the indexing adapters were ligated, and subsequently, specific cDNA libraries were created by PCR enrichment. The libraries were quantified using the KAPA SYBR FAST ABI Prism Library Quantification Kit. Equimolar amounts of each library were used for cluster generation on the cBot (TruSeq SR Cluster Kit v3). The sequencing run was performed on a HiSeq 1000 instrument using the indexed, 1 × 50 cycles single‐end protocol and TruSeq SBS v3 reagents according to the Illumina HiSeq 1000 System User Guide. Image analysis and base calling resulted in .bcl files, which were converted into .fastq files by the CASAVA1.8.2 software. Library preparation and RNA‐Seq were performed at the service facility “KFB” (Regensburg).
Bioinformatic and statistical analysis of RNA‐sequencing data
Preprocessing: Quality of sequencing data from the RNA‐Seq libraries was examined using FASTQC (http://www.bioinformatics.babraham.ac.uk/projects/fastqc/), and size, adapter, and quality trimming was performed using Trimmomatic (ver. 0.32 27, ILLUMINACLIP:TruSeq_s tranded_SE.fa:2:30:10 HEADCROP:0 TRAILING:26 LEADING:26 SLIDINGWINDOW:4:15 MINLEN:25). Trimmed reads were aligned to the Homo sapiens genome (ftp://ftp.ensembl.org/pub/release-85/fasta/homo_sapiens/dna/Homo_sapiens.GRCh38.dna.primary_assembly.fa.gz) combined with ERCC sequence information 26 using STAR 28. The mapped reads were then assessed on the gene level using featureCounts from the Rsubread R‐library 29 based on annotation information from Ensembl (GRCh38.p7 release‐85). Following alignment, further quality control was performed using QoRTs 30.
Differential expression analysis: Count data at the gene level were analyzed with DESeq2 31 using ERCC spike‐ins for library size normalization. All treatment comparisons were performed and corrected for multiple testing using FDR 32. Genes that met the indicated log2(fold change) restraint and a false discovery rate < 0.05 (“P adj”) were considered significant differentially expressed.
Heatmap generation and functional annotation: Heatmaps were generated with pheatmap 29 after variance stabilization transformation of count data with DeSeq2. Functional annotation clustering was performed using the David 6.8 database 33, 34 as well as the Enrichr tool 35, 36.
Phylogenetic analysis of human SPRRs
The coding sequences for all human SPRR proteins were extracted from Ensembl 37, and the evolutionary history was inferred by using the maximum‐likelihood method based on the Tamura–Nei model 38. The tree with the highest log‐likelihood (−761.45) is shown. The percentage of trees in which the associated taxa clustered together is shown next to the branches. Initial tree(s) for the heuristic search were obtained automatically by applying Neighbor‐Join and BioNJ algorithms to a matrix of pairwise distances estimated using the maximum composite likelihood (MCL) approach and then selecting the topology with superior log‐likelihood value. A discrete gamma distribution was used to model evolutionary rate differences among sites [five categories (+G, parameter = 5.2252)]. The tree is drawn to scale, with branch lengths measured in the number of substitutions per site. Codon positions included were 1st + 2nd + 3rd + non‐coding. All positions containing gaps and missing data were eliminated. There were a total of 137 positions in the final dataset. Evolutionary analyses were conducted in MEGA7 39, and 1,000 bootstrap iterations were performed.
External datasets and publicly available analysis tools
The protein‐coding potential of LINC00941(Ref_SeqID NR_040245.1) was calculated with the Coding‐Potential Assessment Tool (CPAT 11, iSeeRNA 12, Lncident 13, and Coding Potential Calculator CPC2 14 ). Analysis of LINC00941 regulated genes per chromosome was done in comparison with the Human genes (GRCh38.p10) downloaded from BioMart (Ensembl). For p63 regulation of SPRR5 in keratinocytes, published p63 ChIP‐Seq datasets from Kouwenhoven et al 20 (GSE59827) and Bao et al 21 (GSE67382) keratinocytes were downloaded from the Gene Expression Omnibus (GEO) database 40 and uploaded into UCSC 41 to visualize the peak location with respect to SPRR5. Furthermore, the prediction of upstream transcription factors for SPRR5 was done with the ARCHS4 tool from the Ma'ayan Lab 42.
Inverse regulation of SPRR5 and LINC00941 was tested using publicly available RNA‐Seq datasets from squamous cell carcinoma (GSE84293), basal cell carcinoma (GSE58375; both Smoothened inhibitor‐sensitive and Smoothened inhibitor‐resistant cancer types) and psoriasis (GSE83645) by mapping the reads to hg38 with Bowtie2 (version 2.3.3.1; for GSE83645) 43 or STAR (version 2.5.2b) 28 in either paired or single‐stranded mode, depending on the nature of the RNA‐Seq data with default settings (except for GSE58375, which was done with –outFilterScoreMinOverLread 0,–outFilterMatchNminOverLread 0, and –outFilterMatchNmin 0). The resulting aligned reads were counted on the gene level with HTSeq 44 (version 0.6.1.post1, ‐m union, ‐a 10, ‐s no) using a hg38 gtf file downloaded from UCSC table browser (download date 2016‐02) that was supplemented with the coordinates for the SPRR5 gene. Count data were analyzed with DESeq2 31 using standard settings, and SPRR5 or LINC00941 was considered as differentially expressed when either −0.5 > log2(fold change) or log2(fold change) > 0.5 was met.
RACE analysis
RACE (rapid amplification of cDNA ends) was performed with the FirstChoice RLM‐RACE Kit (Ambion) according to the manufacturer's instructions in combination with the Expand Long Template PCR system (Roche), RNA obtained from differentiated keratinocytes, and gene‐specific primers. PCR products were isolated via the NucleoSpin Gel and PCR Clean‐up kit (Macherey‐Nagel), cloned into pGEM‐TEasy (Promega) and sequenced by Macrogen. Primer sequences were 5′outer: CTGCCAGAGGAATTCTGTTTTAATTG, 5′inner: GAACCAGATCCTTGTCTGAGAT, 3′outer: CAAGTCCAGCCCAGAATGTCTC, 3′inner: TCTCAGCAGAAGCAGAAGCAGT. PCR conditions were as follows:
| Initial denaturation | 94°C | 3 min | |
| Amplification | 94°C | 30 s | 25–30× |
| 57°C | 30 s | ||
| 68°C | 90 s | ||
| Final extension | 68°C | 7 min |
Author contributions
CZ and JG designed and executed experiments, analyzed data, and wrote the manuscript. SF, JS, and BF executed experiments and analyzed data. NS analyzed data. RS, AB, and RM analyzed data and designed experiments. SH and MK designed experiments, analyzed data, and wrote the manuscript.
Conflict of interest
The authors declare that they have no conflict of interest.
Supporting information
Expanded View Figures PDF
Dataset EV1
Dataset EV2
Review Process File
Acknowledgements
We thank Thomas Stempfl (genomics core facility, “KFB” at the University of Regensburg) as well as Andrea Eder, Johanna Heimbucher, and Gerhard Lehmann for technical assistance and Gunter Meister, Julia Engelmann and Jörn Hendrik Reuter for discussions. Our research is supported in part by grants from the Deutsche Forschungsgemeinschaft (SFB 960 to M.K., research grant KR 3468/2‐1 to M.K.) and the Beiersdorf AG.
EMBO Reports (2019) 20: e46612
Data availability
The RNA‐sequencing data from this publication have been deposited to the NCBI's Gene Expression Omnibus database and assigned the identifier GSE118077 (https://www.ncbi.nlm.nih.gov/geo/query/acc.cgi?acc=GSE118077). Itemized lists of utilized qRT–PCR primers and northern blot probes (Tables 1 and 2).
References
- 1. Blanpain C, Fuchs E (2009) Epidermal homeostasis: a balancing act of stem cells in the skin. Nat Rev Mol Cell Biol 10: 207–217 [DOI] [PMC free article] [PubMed] [Google Scholar]
- 2. Lopez‐Pajares V, Yan K, Zarnegar BJ, Jameson KL, Khavari PA (2013) Genetic pathways in disorders of epidermal differentiation. Trends Genet 29: 31–40 [DOI] [PMC free article] [PubMed] [Google Scholar]
- 3. Kopp F, Mendell JT (2018) Functional classification and experimental dissection of long noncoding RNAs. Cell 172: 393–407 [DOI] [PMC free article] [PubMed] [Google Scholar]
- 4. Bari L, Bacsa S, Sonkoly E, Bata‐Csörgő Z, Kemény L, Dobozy A, Széll M (2011) Comparison of stress‐induced PRINS gene expression in normal human keratinocytes and HaCaT cells. Arch Dermatol Res 303: 745–752 [DOI] [PubMed] [Google Scholar]
- 5. Kretz M, Webster DE, Flockhart RJ, Lee CS, Zehnder A, Lopez‐Pajares V, Qu K, Zheng GXY, Chow J, Kim GE et al (2012) Suppression of progenitor differentiation requires the long noncoding RNA ANCR. Genes Dev 26: 338–343 [DOI] [PMC free article] [PubMed] [Google Scholar]
- 6. Kretz M, Siprashvili Z, Chu C, Webster DE, Zehnder A, Qu K, Lee CS, Flockhart RJ, Groff AF, Chow J et al (2013) Control of somatic tissue differentiation by the long non‐coding RNA TINCR. Nature 493: 231–235 [DOI] [PMC free article] [PubMed] [Google Scholar]
- 7. Lee CS, Mah A, Aros CJ, Lopez‐Pajares V, Bhaduri A, Webster DE, Kretz M, Khavari PA (2018) Cancer‐associated long noncoding RNA SMRT‐2 controls epidermal differentiation. J Invest Dermatol 138: 1445–1449 [DOI] [PMC free article] [PubMed] [Google Scholar]
- 8. Lopez‐Pajares V, Qu K, Zhang J, Webster DE, Barajas BC, Siprashvili Z, Zarnegar BJ, Boxer LD, Rios EJ, Tao S et al (2015) A LncRNA‐MAF:MAFB transcription factor network regulates epidermal differentiation. Dev Cell 32: 693–706 [DOI] [PMC free article] [PubMed] [Google Scholar]
- 9. Sonkoly E (2005) Identification and characterization of a novel, psoriasis susceptibility‐related noncoding RNA gene, PRINS. J Biol Chem 280: 24159–24167 [DOI] [PubMed] [Google Scholar]
- 10. Yan X, Zhang D, Wu W, Wu S, Qian J, Hao Y, Yan F, Zhu P, Wu J, Huang G et al (2017) Mesenchymal stem cells promote hepatocarcinogenesis via lncRNA–MUF interaction with ANXA2 and miR‐34a. Cancer Res 77: 6704–6716 [DOI] [PubMed] [Google Scholar]
- 11. Wang L, Park HJ, Dasari S, Wang S, Kocher J‐P, Li W (2013) CPAT: coding‐potential assessment tool using an alignment‐free logistic regression model. Nucleic Acids Res 41: e74 [DOI] [PMC free article] [PubMed] [Google Scholar]
- 12. Sun K, Chen X, Jiang P, Song X, Wang H, Sun H (2013) iSeeRNA: identification of long intergenic non‐coding RNA transcripts from transcriptome sequencing data. BMC Genom 14: S7 [DOI] [PMC free article] [PubMed] [Google Scholar]
- 13. Han S, Liang Y, Li Y, Du W (2016) Lncident: a tool for rapid identification of long noncoding RNAs utilizing sequence intrinsic composition and open reading frame information. Int J Genomics 2016: 9185496 [DOI] [PMC free article] [PubMed] [Google Scholar]
- 14. Kang Y‐J, Yang D‐C, Kong L, Hou M, Meng Y‐Q, Wei L, Gao G (2017) CPC2: a fast and accurate coding potential calculator based on sequence intrinsic features. Nucleic Acids Res 45: W12–W16 [DOI] [PMC free article] [PubMed] [Google Scholar]
- 15. Kypriotou M, Huber M, Hohl D (2012) The human epidermal differentiation complex: cornified envelope precursors, S100 proteins and the ‘fused genes’ family: human epidermal differentiation complex. Exp Dermatol 21: 643–649 [DOI] [PubMed] [Google Scholar]
- 16. Mischke D, Korge BP, Marenholz I, Volz A, Ziegler A (1996) Genes encoding structural proteins of epidermal cornification and S100 calcium‐binding proteins form a gene complex (‘epidermal differentiation complex’) on human chromosome 1q21. J Invest Dermatol 106: 989–992 [DOI] [PubMed] [Google Scholar]
- 17. Mills AA, Zheng B, Wang X‐J, Vogel H, Roop DR, Bradley A (1999) p63 is a p53 homologue required for limb and epidermal morphogenesis. Nature 398: 708–713 [DOI] [PubMed] [Google Scholar]
- 18. Romano R‐A, Smalley K, Magraw C, Serna VA, Kurita T, Raghavan S, Sinha S (2012) ΔNp63 knockout mice reveal its indispensable role as a master regulator of epithelial development and differentiation. Development 139: 772–782 [DOI] [PMC free article] [PubMed] [Google Scholar]
- 19. Truong AB, Kretz M, Ridky TW, Kimmel R, Khavari PA (2006) p63 regulates proliferation and differentiation of developmentally mature keratinocytes. Genes Dev 20: 3185–3197 [DOI] [PMC free article] [PubMed] [Google Scholar]
- 20. Kouwenhoven EN, Oti M, Niehues H, van Heeringen SJ, Schalkwijk J, Stunnenberg HG, van Bokhoven H, Zhou H (2015) Transcription factor p63 bookmarks and regulates dynamic enhancers during epidermal differentiation. EMBO Rep 16: 863–878 [DOI] [PMC free article] [PubMed] [Google Scholar]
- 21. Bao X, Rubin AJ, Qu K, Zhang J, Giresi PG, Chang HY, Khavari PA (2015) A novel ATAC‐seq approach reveals lineage‐specific reinforcement of the open chromatin landscape via cooperation between BAF and p63. Genome Biol 16: 284 [DOI] [PMC free article] [PubMed] [Google Scholar]
- 22. Cavazza A, Miccio A, Romano O, Petiti L, Malagoli Tagliazucchi G, Peano C, Severgnini M, Rizzi E, De Bellis G, Bicciato S et al (2016) Dynamic transcriptional and epigenetic regulation of human epidermal keratinocyte differentiation. Stem Cell Reports 6: 618–632 [DOI] [PMC free article] [PubMed] [Google Scholar]
- 23. Hannus M, Beitzinger M, Engelmann JC, Weickert M‐T, Spang R, Hannus S, Meister G (2014) siPools: highly complex but accurately defined siRNA pools eliminate off‐target effects. Nucleic Acids Res 42: 8049–8061 [DOI] [PMC free article] [PubMed] [Google Scholar]
- 24. Sen GL, Reuter JA, Webster DE, Zhu L, Khavari PA (2010) DNMT1 maintains progenitor function in self‐renewing somatic tissue. Nature 463: 563–567 [DOI] [PMC free article] [PubMed] [Google Scholar]
- 25. Mayer A, di Iulio J, Maleri S, Eser U, Vierstra J, Reynolds A, Sandstrom R, Stamatoyannopoulos JA, Churchman LS (2015) Native elongating transcript sequencing reveals human transcriptional activity at nucleotide resolution. Cell 161: 541–554 [DOI] [PMC free article] [PubMed] [Google Scholar]
- 26. External RNA Controls Consortium (2005) Proposed methods for testing and selecting the ERCC external RNA controls. BMC Genom 6: 150 [DOI] [PMC free article] [PubMed] [Google Scholar]
- 27. Bolger AM, Lohse M, Usadel B (2014) Trimmomatic: a flexible trimmer for Illumina sequence data. Bioinformatics 30: 2114–2120 [DOI] [PMC free article] [PubMed] [Google Scholar]
- 28. Dobin A, Davis CA, Schlesinger F, Drenkow J, Zaleski C, Jha S, Batut P, Chaisson M, Gingeras TR (2013) STAR: ultrafast universal RNA‐seq aligner. Bioinformatics 29: 15–21 [DOI] [PMC free article] [PubMed] [Google Scholar]
- 29. Kolde R (2012) Pheatmap: pretty heatmaps. R Package Version 61
- 30. Hartley SW, Mullikin JC (2015) QoRTs: a comprehensive toolset for quality control and data processing of RNA‐Seq experiments. BMC Bioinformatics 16: 224 [DOI] [PMC free article] [PubMed] [Google Scholar]
- 31. Love MI, Huber W, Anders S (2014) Moderated estimation of fold change and dispersion for RNA‐seq data with DESeq2. Genome Biol 15: 550 [DOI] [PMC free article] [PubMed] [Google Scholar]
- 32. Benjamini Y, Hochberg Y (1995) Controlling the false discovery rate: a practical and powerful approach to multiple testing. J R Stat Soc Series B Methodol 57: 289–300 [Google Scholar]
- 33. Huang DW, Sherman BT, Lempicki RA (2009) Systematic and integrative analysis of large gene lists using DAVID bioinformatics resources. Nat Protoc 4: 44–57 [DOI] [PubMed] [Google Scholar]
- 34. Huang DW, Sherman BT, Lempicki RA (2009) Bioinformatics enrichment tools: paths toward the comprehensive functional analysis of large gene lists. Nucleic Acids Res 37: 1–13 [DOI] [PMC free article] [PubMed] [Google Scholar]
- 35. Chen EY, Tan CM, Kou Y, Duan Q, Wang Z, Meirelles G, Clark NR, Ma'ayan A (2013) Enrichr: interactive and collaborative HTML5 gene list enrichment analysis tool. BMC Bioinformatics 14: 128 [DOI] [PMC free article] [PubMed] [Google Scholar]
- 36. Kuleshov MV, Jones MR, Rouillard AD, Fernandez NF, Duan Q, Wang Z, Koplev S, Jenkins SL, Jagodnik KM, Lachmann A et al (2016) Enrichr: a comprehensive gene set enrichment analysis web server 2016 update. Nucleic Acids Res 44: W90–W97 [DOI] [PMC free article] [PubMed] [Google Scholar]
- 37. Zerbino DR, Achuthan P, Akanni W, Amode MR, Barrell D, Bhai J, Billis K, Cummins C, Gall A, Girón CG et al (2018) Ensembl 2018. Nucleic Acids Res 46: D754–D761 [DOI] [PMC free article] [PubMed] [Google Scholar]
- 38. Tamura K, Nei M (1993) Estimation of the number of nucleotide substitutions in the control region of mitochondrial DNA in humans and chimpanzees. Mol Biol Evol 10: 512–526 [DOI] [PubMed] [Google Scholar]
- 39. Kumar S, Stecher G, Tamura K (2016) MEGA7: molecular evolutionary genetics analysis version 7.0 for bigger datasets. Mol Biol Evol 33: 1870–1874 [DOI] [PMC free article] [PubMed] [Google Scholar]
- 40. Barrett T, Wilhite SE, Ledoux P, Evangelista C, Kim IF, Tomashevsky M, Marshall KA, Phillippy KH, Sherman PM, Holko M et al (2013) NCBI GEO: archive for functional genomics data sets—update. Nucleic Acids Res 41: D991–D995 [DOI] [PMC free article] [PubMed] [Google Scholar]
- 41. Kent WJ, Sugnet CW, Furey TS, Roskin KM, Pringle TH, Zahler AM, Haussler D (2002) The human genome browser at UCSC. Genome Res 12: 996–1006 [DOI] [PMC free article] [PubMed] [Google Scholar]
- 42. Lachmann A, Torre D, Keenan AB, Jagodnik KM, Lee HJ, Silverstein MC, Wang L, Ma'ayan A (2018) Massive mining of publicly available RNA‐seq data from human and mouse. Nat Commun 9: 1366 [DOI] [PMC free article] [PubMed] [Google Scholar]
- 43. Langmead B, Salzberg SL (2012) Fast gapped‐read alignment with Bowtie 2. Nat Methods 9: 357–359 [DOI] [PMC free article] [PubMed] [Google Scholar]
- 44. Anders S, Pyl PT, Huber W (2015) HTSeq–a Python framework to work with high‐throughput sequencing data. Bioinformatics 31: 166–169 [DOI] [PMC free article] [PubMed] [Google Scholar]
Associated Data
This section collects any data citations, data availability statements, or supplementary materials included in this article.
Supplementary Materials
Expanded View Figures PDF
Dataset EV1
Dataset EV2
Review Process File
Data Availability Statement
The RNA‐sequencing data from this publication have been deposited to the NCBI's Gene Expression Omnibus database and assigned the identifier GSE118077 (https://www.ncbi.nlm.nih.gov/geo/query/acc.cgi?acc=GSE118077). Itemized lists of utilized qRT–PCR primers and northern blot probes (Tables 1 and 2).


