Abstract
During the suckling‐to‐weaning transition, the intestinal epithelium matures, allowing digestion of solid food. Transplantation experiments with rodent fetal epithelium into subcutaneous tissue of adult animals suggest that this transition is intrinsically programmed and occurs in the absence of dietary or hormonal signals. Here, we show that organoids derived from mouse primary fetal intestinal epithelial cells express markers of late fetal and neonatal development. In a stable culture medium, these fetal epithelium‐derived organoids lose all markers of neonatal epithelium and start expressing hallmarks of adult epithelium in a time frame that mirrors epithelial maturation in vivo. In vitro postnatal development of the fetal‐derived organoids accelerates by dexamethasone, a drug used to accelerate intestinal maturation in vivo. Together, our data show that organoids derived from fetal epithelium undergo suckling‐to‐weaning transition, that the speed of maturation can be modulated, and that fetal organoids can be used to model the molecular mechanisms of postnatal epithelial maturation.
Keywords: brush border enzymes, intrinsic intestinal epithelial maturation, mouse fetal organoids, suckling‐to‐weaning transition
Subject Categories: Development & Differentiation
Introduction
At birth, the mouse small intestinal epithelium consists of a single layer of epithelium that covers finger‐like projections into the intestinal lumen called villi. At this time, the villi are populated with three intestinal cell types: the enterocyte, goblet cell, and enteroendocrine cell. Proliferating epithelial cells are localized at the base of the villi in so‐called “intervillus pockets” 1. In the first month after birth, the epithelium undergoes major structural and functional changes. The most apparent structural changes occur around 2 weeks after birth, when crypts form at the base of the villi and the Paneth cells start to populate the bottom of the crypts 2, 3. Concurrently, major functional changes are initiated in a process called suckling‐to‐weaning transition, which is completed within two following weeks. This transition consists of a number of highly specific enzymatic and metabolic changes that allow diet change from milk that is rich in fat and has lactose as a major carbohydrate, to solid food that is rich in complex carbohydrates 4. Many of the major changes occur at the epithelial brush border, which expresses various proteins involved in the digestion of food, such as enzymes needed for processing of carbohydrates. More specifically, in the first two postnatal weeks the principal carbohydrate is lactose, and its digestion is dependent on the enzyme lactase‐phlorizin hydrolase (Lct) 5. Around postnatal day 14 in mice (P14), the adaptation to digest complex carbohydrates from solid food is initiated. This is accompanied by gradual increase in expression of the brush border disaccharides sucrase‐isomaltase (Sis) and trehalase (Treh). Expression levels of these enzymes rise rapidly to adult levels in the third postnatal week 4, 6.
One of the key metabolic changes during postnatal development involves arginine biosynthesis. Arginine is a semi‐essential amino acid that is only present in limited amounts in milk and therefore synthesized in the neonatal enterocytes 7. Argininosuccinate synthetase 1 (Ass1) is the rate‐limiting enzyme in arginine biosynthesis and in mice exclusively expressed in the first two postnatal weeks. During the suckling‐to‐weaning transition, epithelial cells lose the expression of Ass1 and switch to expressing arginase 2 (Arg2) allowing catabolism of arginine, which is abundantly present in solid food 7, 8. Another characterized occurrence of the suckling‐to‐weaning transition in mice is loss of expression of the neonatal Fc receptor for immunoglobulin (FcRn) 9, 10. Neonatal intestinal epithelium expresses high levels of FcRn, which mediates the transfer of maternal IgG from the milk across the intestinal epithelial membrane to facilitate passive immunity. In addition, loss of cathelicidin‐related antimicrobial peptide (CRAMP) during the suckling‐to‐weaning transition of mouse intestinal epithelium has been described as well 11.
Transplantation studies of fetal intestinal segments into subcutaneous tissues of nude adult mice revealed that these segments developed normally in the absence of luminal signals 12, 13, 14. These experiments established that information needed for appropriate intestinal epithelial development, including the suckling‐to‐weaning transition, is driven by a genetic program that is intrinsic to the intestinal mucosa and specified in early development.
We and others have previously shown that the intestinal transcription factor Blimp‐1 is selectively expressed in the mouse intestinal epithelium during embryonic and postnatal development, and that its expression is lost at the suckling‐to‐weaning transition 15, 16. Conditional deletion of Blimp‐1 from the mouse intestinal epithelium resulted in an adult‐type epithelium at birth, with complete absence of ultrastructural and molecular characteristics of postnatal phase of development and severe growth impairment and death of newborn pups 15, 16. These data showed that Blimp‐1 in the mouse intestinal epithelium is a critical driver of the postnatal epithelial phenotype and that its loss of expression in the third postnatal week is likely required for maturation from neonatal to adult epithelium.
The factors driving Blimp‐1 expression in the first 2 weeks and its loss of expression in the third postnatal week are not known. The suckling‐to‐weaning transition might be completely intrinsically regulated, but epithelial gut maturation can to some extent be modulated by hormonal status and extrinsic luminal signals like microbiota and nutrition. Changes in endogenous and exogenous circulating hormones in the developing neonate, such as glucocorticoids, can precociously induce intestinal maturation in vivo 17, 18. Luminal signals, such as microbiota, regulate developmental‐dependent expression of epithelial glycosyl transferases, enzymes necessary for glycosylation of epithelial‐specific proteins during gut maturation 19. Finally, dietary factors such as growth factors, human milk oligosaccharides, and hormones that are present in human milk have been shown to influence gut growth and maturation in cell lines and/or rodent models 20, 21.
It has been an ongoing discussion to which extent and which specific aspects of suckling‐to‐weaning transition are intrinsically programmed. Here, we use cultures of primary fetal epithelial cells to examine whether the epithelial suckling‐to‐weaning transition also occurs in vitro, in a stable culture medium, and in the absence of stromal cells.
Results and Discussion
Primary mouse fetal intestinal epithelium matures in vitro
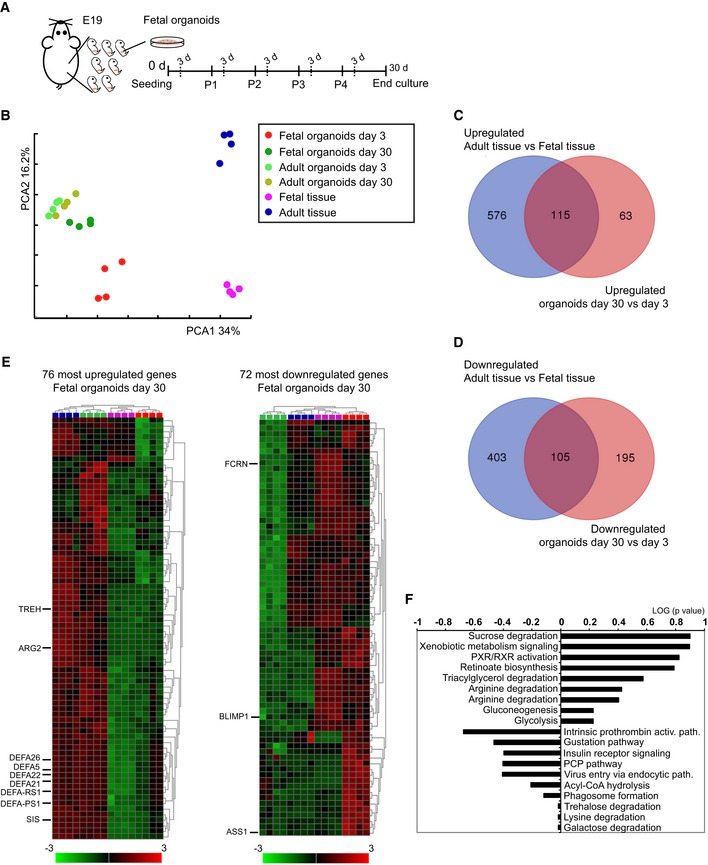
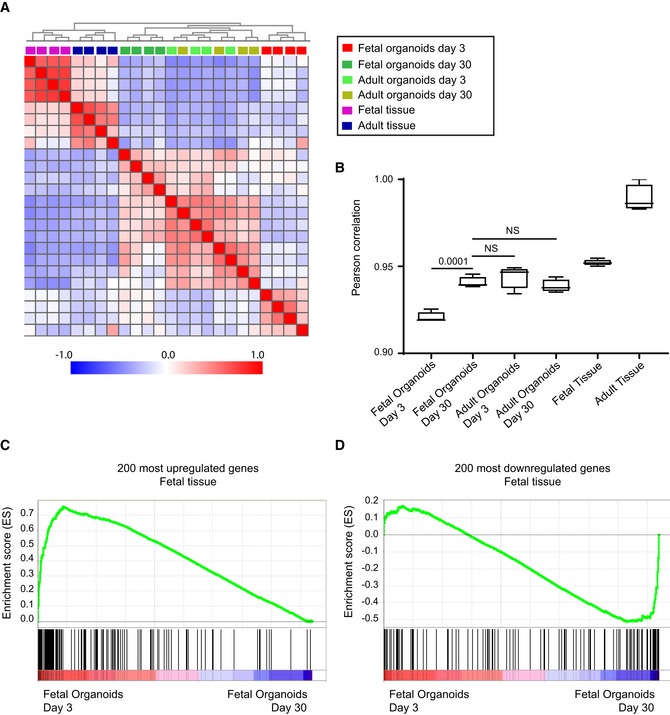
To study whether the intestinal epithelium matures and undergoes the suckling‐to‐weaning transition in vitro, intestinal epithelium from developmental stage E19 was chosen as starting material for the organoid cultures. Organoids were cultured for 1 month, in a stable culture medium, following the passage scheme and harvesting of organoids on the same day after each passage (Fig 1A). As isolated intestinal epithelial cells need 24–48 h to establish in vitro growth, this developmental stage translates in vitro just prior to birth. We performed genomewide gene expression analyses on fetal and adult organoids at days 3 and 30 of culture and mouse intestinal tissues at birth (day 0) and adult (day 42). Principal component analysis (PCA) of this multi‐dimensional dataset revealed that four clusters can be distinguished based on gene expression profiles: (i) fetal organoids day 3; (ii) fetal organoids day 30 together with adult organoids (days 3 and 30); (iii) fetal tissue; and (iv) adult tissue (Fig 1B). Along the first component (PC1 34%), the organoids (epithelium) are clearly separated from the whole tissue, indicating that the gene expression profile of organoids differs substantially from intestinal tissues. Along PC2 (PC2 16.2%), the day 3 fetal organoids separate from day 30 fetal and days 3 and 30 adult organoids, as is also the case for fetal and adult tissue. Of note, no significant difference in the global gene expression profile between day 30 fetal organoids and days 3 or 30 adult organoids assessed by Pearson correlation is observed (Fig EV1A and B). The direction of separation along PC2 for organoids and tissue is the same, suggesting that the maturation state contributes to this separation.
Figure 1. Gene expression analyses of E19 organoids at early and late culture time points.
-
AFetal organoids isolated from fetal intestine at embryonic day 19 were cultured for 30 days in ENR medium and analyzed 3 days after indicated passage.
-
BPCA was conducted on global gene activity in mouse fetal tissue at days 0 and 42, mouse E19 organoids at days 3 and 30 of culture, mouse adult organoids at days 3 and 30 of culture (n = 4 independent intestinal tissue specimens and n = 4 independent organoid cultures).
-
C, DLists of differentially expressed genes between adult and fetal tissue, days 3 and 30 organoids were generated for (C) up‐ and (D) downregulated genes. Results are shown as Venn diagram.
-
ECurated heat maps of top 76 up‐ and 72 downregulated genes. Highlighted genes were chosen based on biological interest. The colored bar represents the z‐score transformed expression level from low (green) to high (red).
-
FThe most significantly changed canonical pathways between fetal organoid at days 3 and 30 of culture.
Figure EV1. Comparison of organoid with tissue maturation.
-
APearson's correlation matrix including hierarchical clustering for whole‐genome normalized microarray probes expressed in organoids/tissues indicated in the colored figure legend.
-
bPearson's correlation coefficient for the comparison of whole‐genome normalized microarray probes between each of the sample listed on the x‐axis and adult tissue. P‐values indicate the results of Student's t‐test. NS is not significant. n = 4.
-
C, DGene set enrichment analyses of 200 most (C) up‐ and (D) downregulated genes from mouse primary fetal versus adult epithelium (GSE35596) across fetal organoid maturation dataset. Vertical lines below x‐axis display relative distribution of expression per gene included in the geneset.
To assess differences and similarities between organoids and tissues and to examine these differences relative to those that exist when comparing fetal intestines and adult intestines, we performed a differential gene expression analysis. Out of 178 genes (Table EV1) that were upregulated 4‐fold or more in fetal organoids cultured for 30 days, 115 genes (65%) were in common with genes upregulated in the adult tissue (Fig 1C). Similarly, 105 out of 310 genes (35%) overlapped between downregulated genes in fetal organoids cultured for 3 days and fetal tissue (Fig 1D). Heat map of the top 76 upregulated genes after 30 days of E19 organoid cultures clustered with adult (day 42) tissue (Fig 1E). Moreover, the majority of the most downregulated genes in 30‐day‐old fetal organoid cultures were similarly expressed in fetal tissue. Additionally, comparison of our fetal organoid dataset to previously published transcription profiles of primary isolated intestinal epithelial cells of neonatal versus adult mice (GEO GSE35596) 22, 23 revealed that 200 upregulated genes in neonatal mouse epithelium were significantly enriched in the fetal organoids cultured for 3 days, whereas 200 downregulated genes correlated with fetal organoids after 30 days of culture (Fig EV1C and D). We next performed Ingenuity Pathway Analyses (IPA) using as input the list of differentially expressed genes between day 3 and day 30 fetal organoid cultures. Predominant changes in canonical pathways involved metabolic alterations indicative for epithelial maturation that is associated with a change in diet from mother's milk to solid food (Fig 1F). Together, these analyses suggest that fetal organoids mature over time and undergo the suckling‐to‐weaning transition in vitro.
In vivo maturation process of mouse intestinal epithelium
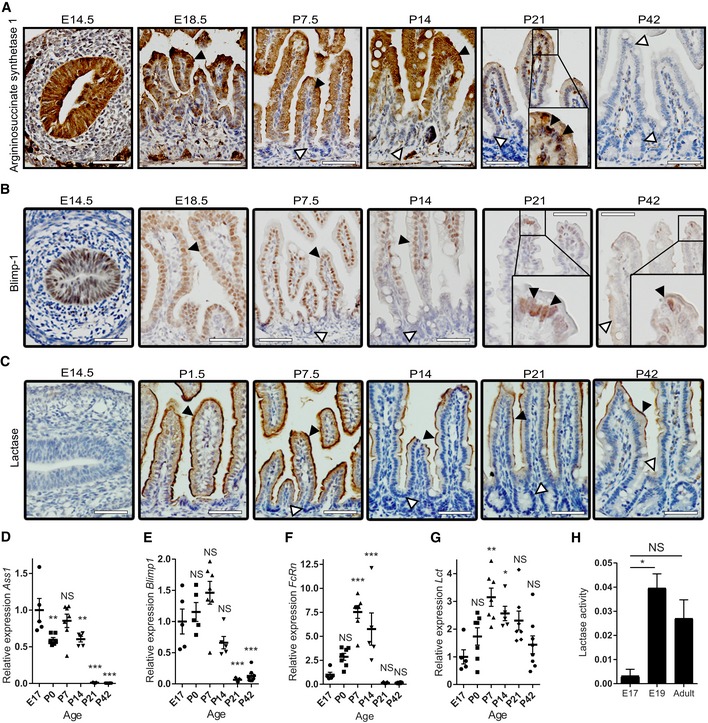
We first examined the intestinal epithelial maturation in vivo in detail, using a panel of maturation markers that are described in literature as markers for fetal/neonatal, suckling‐to‐weaning, and adult epithelium. With this approach, we aimed to obtain a standard for temporal comparison with the in vitro maturation process of the E19 fetal organoids. In the fetal phase (E18.5), we observed a strong expression of the neonatal enzyme argininosuccinate synthetase 1 (Ass1) (Fig EV2A and D), transcription factor Blimp‐1 (Fig EV2B and E), and neonatal Fc receptor (FcRn) (Fig EV2F) throughout the whole epithelium. Histological assessment of tissues from the first two postnatal weeks (P7.5 and P14) showed that expression of these markers gradually disappeared from the proliferative intervillus regions but remained in the differentiated cells of the villi. In the adult gut (P42), expression of Ass1 was completely lost (Fig EV2A), whereas Blimp‐1 was restricted to a limited number of cells at the villus tips (Fig EV2B). In vivo, Lct was highly expressed in rodent neonatal epithelium and declined after weaning, however still present in the adult intestine, mainly in the jejunum (Fig EV2C and G) 24, 25. Activity of Lct peaked at weaning, yet it remained present in adult albeit at lower level (Fig EV2H). Although Lct expression pattern differed from Ass1 and Blimp‐1, it is characteristic for neonatal development and is associated with milk diet 24, 25.
Figure EV2. In vivo expression of neonatal intestinal epithelial markers.
-
A–CImmunohistochemistry of neonatal markers: (A) Ass1, (B) Blimp‐1, and (C) Lct. Insets represent higher magnification of the rectangle. White arrowheads indicate negative cells, and black arrowheads indicate positive cells. Scale bars: 50 μm.
-
D–GWhole tissue real‐time qPCR on (D) Ass1, (E) Blimp‐1, (F) FcRn, and (G) Lct (n = 5–8 individual intestinal specimens generated from offspring of single pregnant mice for E17 and P0‐21, n = 8 independent intestines of adult mice for P42).
-
HEnzyme activity assay of fetal and adult whole tissue lysates for lactase (n = 3–5 individual intestinal specimens, generated from offspring of single pregnant mice for E17‐19, n = 5 independent intestines of adult mice for P42).
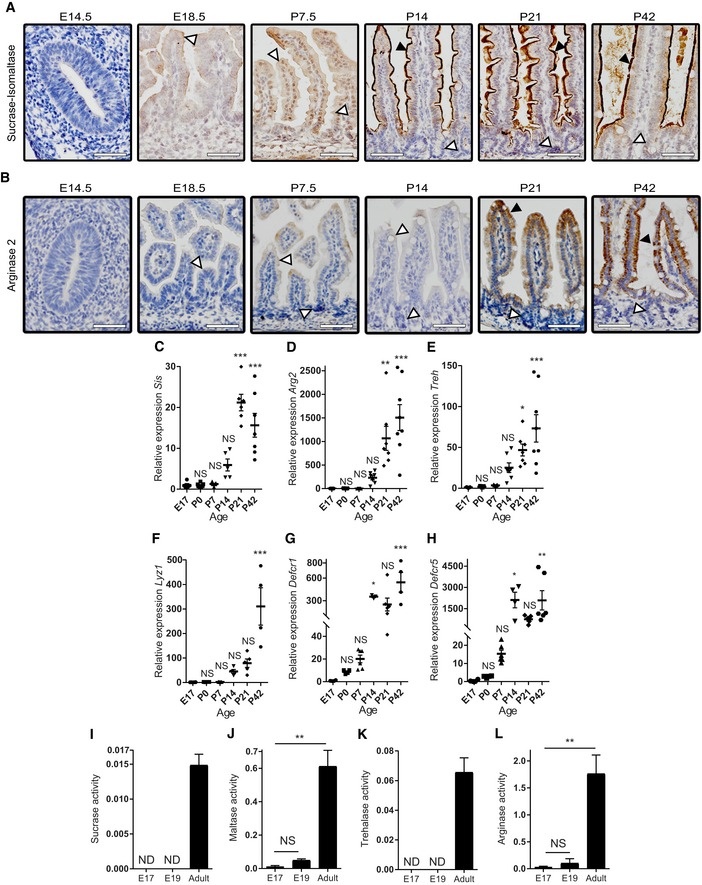
In contrast to the neonatal enterocyte markers, the adult α‐glucosidases sucrase‐isomaltase (Sis) (Fig EV3A and C) and arginase‐2 (Arg2) (Fig EV3B and D) were absent from the small intestine epithelium until the second week after birth, around the suckling‐to‐weaning transition, when a gradual increase in both enzymes was observed exclusively in the villi. The same pattern was observed for trehalase (Treh) (Fig EV3E). These results were confirmed at enzyme activity level (Fig EV3I–L). In addition, expression of the Paneth cell markers lysozyme‐1 (Lyz1) and α‐defensins (Defa1, Defa5) was detected from day 14 onwards (Fig EV3F–H). This correlates with the maturation of this secretory cell type at 2 weeks after birth, concurrently with the development of the crypts. The in vivo maturation pattern described here was subsequently used and compared with the time course of maturation of the fetal small intestinal organoids in vitro as described below.
Figure EV3. In vivo expression of adult intestinal epithelial markers.
-
A, BImmunohistochemistry of adult markers (A) Sis and (B) Arg2. Insets represent higher magnification of the rectangle. White arrowheads indicate negative cells, and black arrowheads indicate positive cells. Scale bars: 50 μm.
-
C–HWhole tissue real‐time qPCR on (C) Sis, (D) Arg2, (E) Treh, (F) Lyz1, (G) Defcr1, and (H) Defcr5 (n = 5–8 individual intestinal specimens generated from offspring of single pregnant mice for E17 and P0‐21, n = 4–8 independent intestines of adult mice for P42).
-
I–LEnzyme activity assay of fetal and adult whole tissue lysates for (I) sucrase, (J) maltase, (K) trehalase, and (L) arginase activities (n = 3–5 individual intestinal specimens, generated from offspring of single pregnant mice for E17–19, n = 5 independent intestines of adult mice for P42).
Small intestinal fetal organoids mature and recapitulate suckling‐to‐weaning transition in vitro
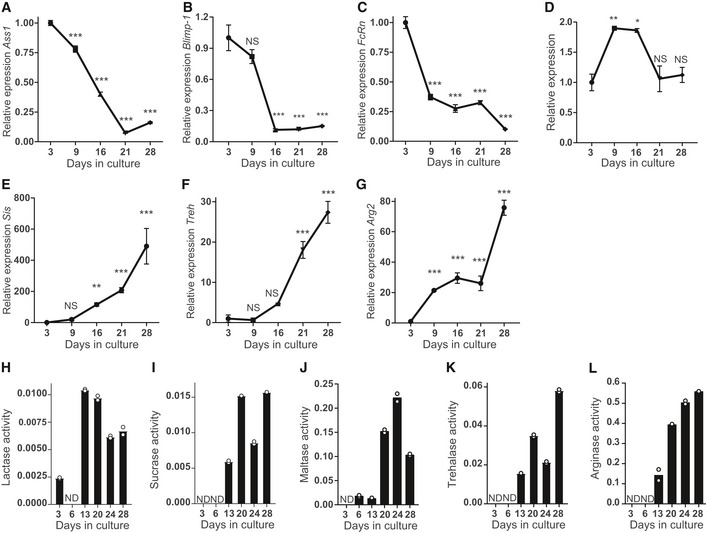
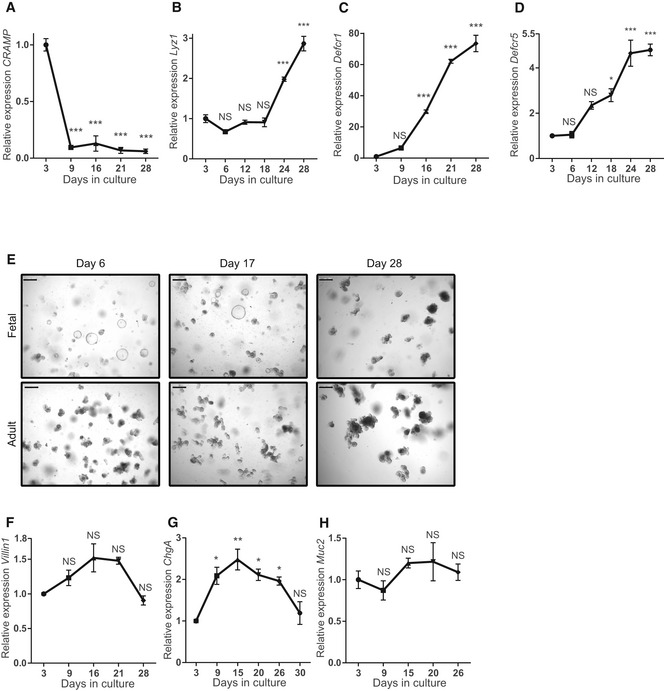
We first analyzed the expression pattern of the fetal/neonatal enterocyte markers in the cultured fetal organoids by qRT–PCR. Both Ass1 and Blimp‐1 were expressed during the first week of culture and nearly absent after 3 weeks (Fig 2A and B). Similarly, FcRn and CRAMP (Figs 2C and EV4A) followed the same expression pattern. Likewise, Lct (Fig 2D) expression was similar to the in vivo expression pattern (Fig EV2G). In contrast, markers of the suckling‐to‐weaning transition and adult intestine Sis and Treh were only detected in organoids as of 2 weeks of culture (Figs 2E and F). Arg2 was expressed at 1 week of culture (Fig 2G) and progressively increased thereafter. Development of a functional brush border was confirmed on enzyme activity level (Figs 2H–L). Comparing the in vitro maturation from suckling‐to‐weaning with the in vivo maturation process revealed that the time frame of epithelial maturation is similar between the fetal organoids in vitro and the intestinal tissue in vivo (compare Figs 2A–D and EV2 for neonatal markers and Figs 2E–G and EV3 for suckling‐to‐weaning/adult markers). Previously, it has been reported that different fetal intestinal segments, i.e., proximal versus distal, generate different organoids 26. We therefore separated proximal and distal parts of E19 intestinal epithelium and studied the in vitro maturation course of the fetal organoids originating from these segments (Appendix Fig S1). Although relative expression levels of some of the maturation markers differed among the segments, the timing and the course of maturation were similar (Appendix Fig S1).
Figure 2. Small intestinal fetal organoids recapitulate suckling‐to‐weaning transition in vitro .
-
A–GReal‐time qPCR analysis of fetal organoids cultured for 1 month showing decrease in relative expression of indicated neonatal markers (A) Ass1, (B) Blimp‐1, (C) FcRn, and (D) Lct and increase in the adult markers (E) Sis, (F) Treh, and (G) Arg2 (n = 3 individual wells from single organoid culture (see Materials and Methods); experiment was repeated in four to eight independent organoid cultures with similar results).
-
H–LEnzyme activity assay of fetal organoids for (H) lactase, (I) sucrase, (J) maltase, (K) trehalase, and (L) arginase. Activity is given in μM glucose/μg protein/min (experiment was generated from single organoid culture (see Materials and Methods) and repeated in three independent organoid cultures with similar results).
Figure EV4. Fetal organoids mature in vitro .
-
A–DReal‐time qPCR analysis of fetal organoids cultured for 1 month showing decrease in relative expression of (A) CRAMP and increase in the Paneth cell markers (B) Lyz1, (C) Defcr1, and (D) Defcr5 (n = 3 individual wells from single organoid culture (see Materials and Methods); experiment was repeated four times with similar results).
-
EMicroscopic images of fetal and adult organoids at days 6, 17, and 28 of culture. Scale bars: 250 μm.
-
F–HReal‐time qPCR of (F) Villin1, (G) ChgA, and (H) Muc2 (n = 3 individual wells from single organoid culture (see Materials and Methods); experiment was repeated four times with similar results).
Lgr5, the best described adult intestinal stem cell marker under homeostatic condition, is expressed by intercolumnar cells residing inbetween the Paneth cells. We next investigated the presence of Lgr5‐expressing cells throughout the course of our culture by means of RNAscope in situ hybridization complemented with immunofluorescence for Lyz1, a marker for Paneth cells (Appendix Fig S2). At the start of E19 culture, Lgr5 was expressed at low levels throughout the organoid epithelium and Paneth cells were absent. Coinciding with the appearance of Paneth cells, Lgr5 signals increase and become confined to the crypt region. Finally, Paneth cell‐specific markers Lyz1, Defcr1, and Defcr5 were detected at 2 weeks of culture (Fig EV4B–D), again similar to the intestinal tissue in vivo (Fig EV3F–H). Together, these findings demonstrate that fetal intestinal organoids, when cultured in vitro, follow an intrinsic epithelial maturation pattern characteristic for the in vivo maturation program in a similar time frame.
Fetal organoids resemble adult organoids after 1 month in culture
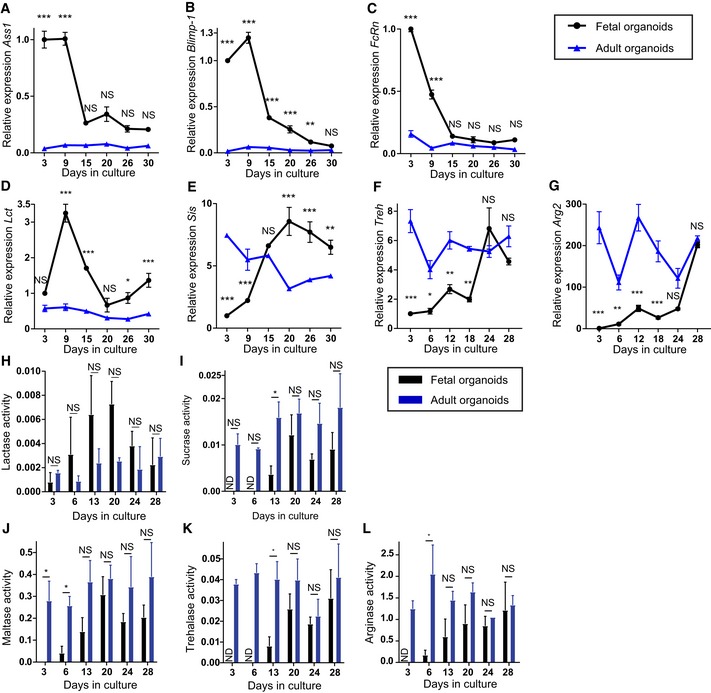
At 1 month after birth, the mouse intestinal epithelium in vivo reaches its adult functional state. We cultured E19 fetal and adult intestinal organoids simultaneously for 1 month (Fig EV4E). Indeed, at day 30 of culture, fetal and adult organoids expressed similar levels of the maturation markers (Fig 3A–G). Importantly, expression levels of neonatal markers remained absent in adult organoids, while adult markers were stably expressed throughout the 30 days of culture. This was further confirmed at enzyme activity level for all enzymes analyzed (Fig 3H–L). Moreover, except for the Paneth cells which became evident as of 14 days of culture, the main epithelial cell types, i.e., enterocytes, enteroendocrine, and goblet cells, were present in the fetal cultures from the start‐up until 30 days of culture (Appendix Figs S2 and S3). Expression levels of markers for enterocytes, enteroendocrine, and goblet cells were relatively stable over time in fetal organoids (Fig EV4F–H). This demonstrates that fetal organoid maturation in vitro, as described here, is not a consequence of the long‐term culturing process of organoids. These findings, alongside with virtually no difference in transcription profiles in prolonged culture of adult organoids (Figs 1B and EV1A), impose intrinsic transition from fetal to adult features in vitro and exclude prolonged culture as a contributor to this process.
Figure 3. Fetal organoids resemble adult organoids after 1 month in culture.
-
A–GRelative expression detected by real‐time qPCR in fetal organoids (black circles) and adult organoids (blue triangles). Neonatal markers (A) Ass1, (B) Blimp‐1, (C) FcRn, and (D) Lct in fetal organoids cultured for 1 month compared to levels adult organoids. Mature markers (E) Sis, (F) Treh, and (G) Arg2 increase in fetal organoids to adult levels (n = 3 individual wells from single organoid culture (see Materials and Methods); experiment was repeated in four independent organoid cultures with similar results).
-
H–LEnzyme activity assay of fetal (black bars) and adult (blue bars) organoids. (H) Lactase activity is higher in fetal organoids decreasing to adult levels at day 28, while (I) sucrase, (J) maltase, (K) trehalase, and (L) arginase increase to adult levels. Activity is given in μM glucose/μg protein/min (n = 3 independent organoid cultures).
Dexamethasone accelerates maturation of fetal organoids in vitro
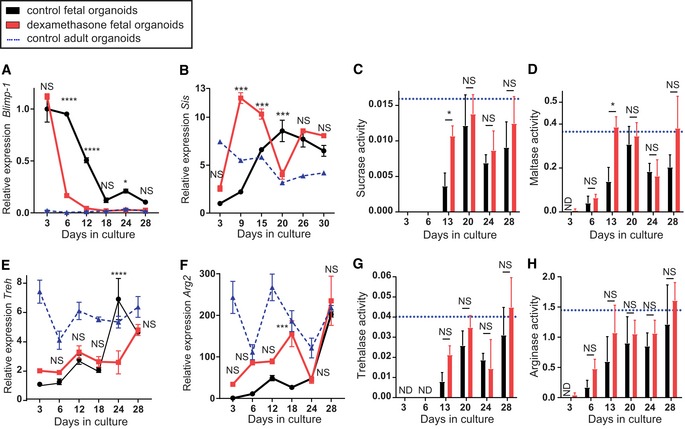
Extrinsic factors have been described to modulate the timing of intestinal epithelial maturation. For example, changes in dietary composition, microbiome, and circulating glucocorticoids influence the expression of epithelial‐specific enzymes 17, 27, 28. We chose to use the synthetic glucocorticoid dexamethasone as an example of a factor that can influence the maturation process associated with the suckling‐to‐weaning transition of the mouse intestinal epithelium. Dexamethasone is described to increase epithelial proliferation and subsequently replace neonatal enterocytes by “adult‐like” epithelium, thereby leading to the precocious expression of the enzymes Treh and Sis 6, 29, 30. To verify whether a similar effect could be observed in our in vitro culture, we treated fetal organoids daily with dexamethasone. Gene expression analysis of dexamethasone‐treated fetal organoids showed a rapid decrease in Blimp‐1 (Fig 4A) accompanied by an increase in Sis (Fig 4B) to adult levels 2 weeks earlier than the control condition. This was confirmed at enzyme level, where the enzymes sucrase and maltase exhibited a significant increase in activity after dexamethasone treatment, compared to control condition (Fig 4E and F). Of note, dexamethasone‐treated organoids reached adult enzyme activity levels at day 13 of culture, while control fetal organoids increased their enzyme activity values at a considerably slower rate. Dexamethasone did not increase Treh and Arg2 gene expression levels (Fig 4C and D), but the activity level of the corresponding enzymes was significantly increased in dexamethasone‐treated fetal organoids at day 13 of culture compared to control condition (Fig 4G and H). Importantly, dexamethasone did not alter the enzyme activity of adult organoids (Appendix Fig S4). The effects of dexamethasone observed in vitro were similar to the effects in vivo, for example a precocious increase in sucrase‐isomaltase mRNA levels after dexamethasone treatment and protective role on intestinal brush border by increased activities of Treh 31. The accelerated suckling‐to‐weaning transition observed here demonstrates that the timing of the intrinsic intestinal maturation process observed in fetal organoids can be modulated by extrinsic factors.
Figure 4. Dexamethasone accelerates maturation of fetal organoids.
-
A–H(A, B, E, F) Maturation is accelerated in dexamethasone‐treated fetal organoids (red squares) compared to control (black circles), as revealed by real‐time qPCR. Decrease in relative expression of neonatal marker (A) Blimp‐1 and increase in expression of adult marker (B) Sis occur earlier in dexamethasone‐treated organoids, but expression of adult markers (E) Treh and (F) Arg2 remains unchanged (n = 3 individual wells from single organoid culture (see Materials and Methods); experiment was repeated in four independent organoid cultures with similar results). (C, D, G, H) Dexamethasone treatment accelerates increase in activity of (E) sucrase, (F) maltase, (G) trehalase, and (H) arginase reaching adult organoid level (blue triangles) at day 13 of the culture. Activity is given in μM glucose/μg protein/min (n = 3 independent organoid cultures). Data are presented as mean ± SEM. ND not detected, *P < 0.05, ***P < 0.001, ****P < 0.0001, NS: not significant, between control and dexamethasone‐treated fetal organoids (two‐way ANOVA). Expression values of control fetal organoids and control adult organoids in (B, E and F) are the same as Fig 3E–G, and enzyme activity levels of fetal organoids in (C, D, G and H) are the same as Fig 3I–L.
Mixed organoid cultures: Spheroids transit to organoids and do not reflect different maturation stages per se
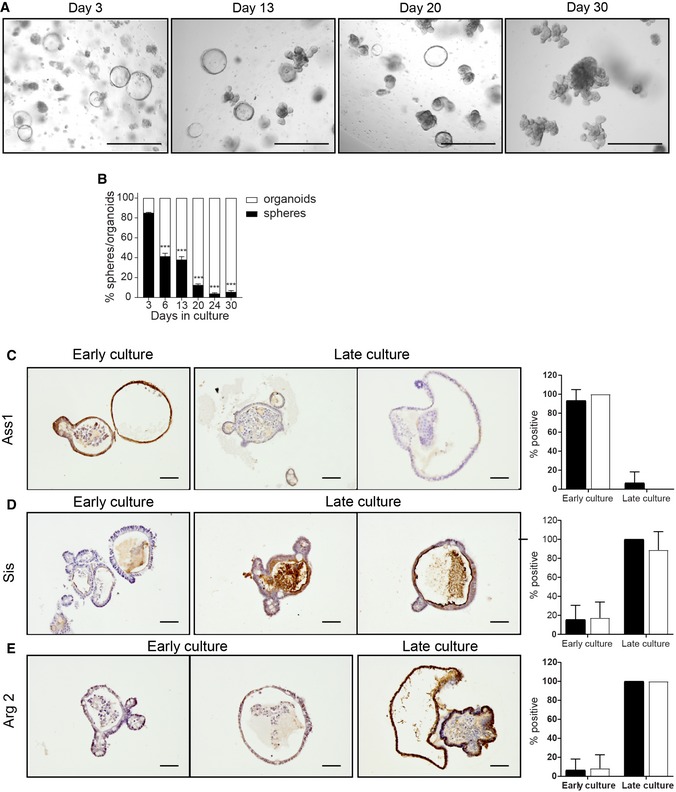
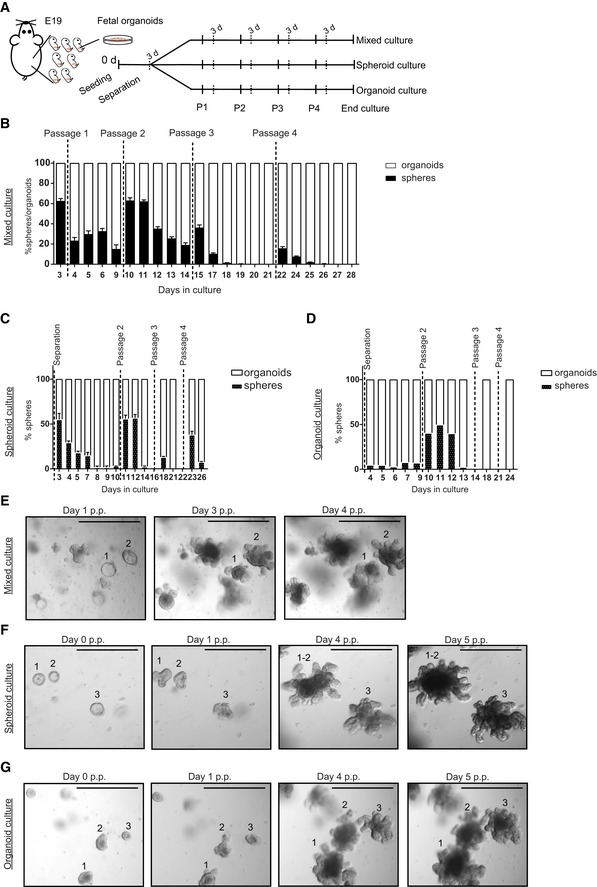
Previously, it has been reported that organoid cultures are a mixed population of structures consisting of budding structures and hollow spheres, referred to as organoids and spheroids, respectively 32. Furthermore, it has been shown that epithelial cells at E14‐E16.5 propagate in vitro indefinitely as spheroids that do not transit to organoids even after continuous passaging 26, 33. In our E19 fetal cultures, we also observed two types of structures, organoids and spheroids (Fig 5A). Quantification of these two structures showed that at day 3 of in vitro culture, more than 80% of the outgrowths were spheroids, decreasing to approximately 10% at day 30 of culture (Fig 5B). The prevalence of spheroids at the start of the fetal cultures is in accordance with previous reports 26, 33. However, the count of spheroids decreased within the same passage (Fig EV5B), suggesting that spheroids transited to organoids within the same passage. In addition, after passaging we typically observed a transient increase of spheroid number, albeit to a different degree, further suggesting interchangeable relationship between these two culture phenotypes (Fig EV5B). Such spheroid–organoid relationship has previously been described 32, suggesting that the spheroids that we observed are different from the ones generated from E14‐E16.5 epithelium. In our culture conditions, most spheroids turned to budding organoids 2 days after each passage (Fig EV5E). Based on this observation, we consequently sampled at day 3 after each passage for all our analyses (Fig 1A). To determine the relationship between spheres and organoids, we separated spheroids and organoids from E19 fetal cultures at day 3 and cultured them independently in parallel with mixed culture (Fig EV5A). Counting of organoids and spheroids by equal vision field images of these three culture conditions (Fig EV5C–G) and live imaging of spheroid structures confirmed the interchangeable relationship between spheroids and organoids (Movies EV1 and EV2). In conclusion, we observed seamless transition of spheroids to organoids within the same passage at early and late passaging. In addition, after each passage a proportion of organoids grew as spheroids though this seemed to decrease in time (Fig EV5).
Figure 5. Spheroids and organoids show the same protein expression pattern, independently of culture stage/passage.
-
AMicroscopic images of fetal organoids at days 3, 13, 20, and 30 of culture. Scale bars: 500 μm.
-
BPercentage of fetal spheroids decreases during culture (n = 3 individual wells from single organoid culture (see Materials and Methods); experiment was repeated in ten independent organoid cultures with similar results).
-
C–EImmunohistochemistry of fetal organoids for (C) Ass1, (D) Sis, and (E) Arg2. Quantification of three slides per staining, 7–10 organoids/spheroids per slide. Scale bars: 50 μm.
Figure EV5. Spheroid and organoid culture follow the same dynamics as mixed culture.
-
AScheme of culture separation.
-
B–DPercentage of spheroids versus organoids in (B) mixed culture, (C) spheroids, and (D) organoids (n = 3 individual wells from single organoid culture (see Materials and Methods); experiment was repeated four times with similar results).
-
EMicroscopic images of mixed culture at days 1, 3, and 4 post‐passage (p.p.), showing the transition of spheroids 1 and 2 into organoids between passage 1 and passage 2. Scale bars: 500 μm.
-
F, GMicroscopic images of (F) spheroid and (G) organoid culture at days 0, 1, 4, and 5 post‐passage (p.p.), showing the conversion of spheroids 1, 2, and 3 into organoids between passage 1 and passage 2. Scale bars: 500 μm.
Even though our experiments demonstrated transition of spheroids to organoids, intestinal maturation in vitro could still have been caused by a decrease in the number of spheroids during the 30 days of the culture period (see Fig EV5B). To further investigate this, expression of neonatal and adult markers was analyzed by immunohistochemistry (IHC) on mixed organoid cultures at different days/passages (Fig 5C–E). In early passages of mixed cultures, the neonatal marker Ass1 was expressed in both organoids and spheroids (Fig 5C) and, as expected, was virtually absent in late passages. In a sharp contrast, adult markers Sis and Arg2 were not present in spheroids neither in organoids of early cultures (day 6). However, these two enzymes were simultaneously expressed in spheroids as well as organoids at later culture time points (Fig 5D and E). These data suggest that spheroids, in our culture conditions, are appearing transiently, independently of the culture passage and maturation status of epithelial cells.
These data in conjunction indicate that fetal intestinal organoids cultured from late stages of fetal development (E19) to adulthood can be used as a novel in vitro model to study intestinal epithelial maturation, and open the way to decipher the impact of nutritional and environmental factors on this process reducing the need for (extensive) animal studies. In humans, there are multiple conditions in which gut maturation, i.e., maturation of the epithelial digestive functions and gut barrier functions, is delayed or impaired. These conditions include, e.g., preterm birth, undernutrition, and gastrointestinal infections with both short‐ and long‐term effects 34, 35, 36, 37. Short‐term effects may include necrotizing enterocolitis and sepsis in preterm infants and recurrent infections and environmental enteropathy in early life undernutrition. Long‐term health consequences may include stunting and neurodevelopmental impairment. Therefore, studies on gut maturation and how to modulate this process through early life nutrition are of pivotal importance for neonatal intestinal health and later life health.
Moreover, the development of cultured fetal intestinal organoids can be accelerated by dexamethasone as has also been described in in vivo studies, demonstrating that cultured fetal intestinal epithelial cells can be used to identify novel factors that influence the timing of epithelial maturation. Such insights are fundamental for a better understanding of factors, e.g., bioactive components in human milk, prebiotics, probiotics, and synbiotics that may promote gut maturation and thereby neonatal intestinal health in stressed conditions such as in preterm infants, undernourished infants, and infants with GI infections and inflammation.
Materials and Methods
Mice
Animal procedures complied with the guidelines of the EU and were approved by the Animal Welfare Body (ALC102556). Pregnant 8‐week‐old C57Bl/6J mice were obtained from Jackson Laboratory and were sacrificed at day 19 of the pregnancy.
In vitro organoid culture
To generate single fetal organoid culture, fetuses from two mice were combined resulting in a final number of around 15 fetuses per experiment. For fetal and adult organoids culture, small intestine tissue was harvested, dissociated, and cultured as previously described in a 48‐well plate 38. For adult organoids, the middle part of the small intestine of the mothers was used. In specific experiments, proximal and distal fetal intestinal tissue was separated based on location of stomach and appendix and cultured in parallel. Both fetal and adult organoids were maintained in ENR medium (Appendix Table S1) throughout the experiments. When mentioned, organoids were incubated with 0.01 mM dexamethasone (Sigma‐Aldrich) from day one of culture, continuously.
Separation of spheroids from organoids was performed at day 3 of culture, by collecting cultures in Cell Recovery solutions (Corning B.V.) and manually picking spheroids or organoids from suspension under microscope and separately re‐culturing in matrigel as described above.
Samples for RNA analyses, enzyme activity, or immunohistochemistry were always taken 3 days after passaging of the culture. Counting was performed daily in the same wells, by two people, in three to five wells. Representative images of the cultures were taken by an inverted light microscope (Leica) from the same well, same field, on subsequent days of culture, within one passage. In addition, organoid cultures were monitored over time by CytoSMART (Cytomate Technologies B.V.) with a 30‐min snapshot interval, during several days of cultures. Images were processed to a movie using ImageJ.
RNA isolation and qRT–PCR
RNA was isolated using the Bioline ISOLATE II RNA Mini Kit (BIO‐52073, Bioline) according to manufacturers’ instructions. RNA quality was measured on an Agilent 2100 Bioanalyzer, and only samples with a RNA integrity number (RIN) above 9 were included.
For transcriptome profiling, 400 ng RNA was amplified and labeled using 3′ IVT Pico Kit (Affymetrix) and RNA Amplification Kit (Nugene) according to manufacturer's protocol. Microarray analysis of mouse tissue and organoids was performed using Affymetrix Clariom® D 8‐Array HT Plate according to the standard protocols of the Dutch Genomics Service and Support Provider (MAD, Science Park, University of Amsterdam, Netherlands). The data were normalized using Expression Console 1.4.1.46 and uploaded to R2: Genomics Analysis and Visualization Platform (http://hgserver1.amc.nl/). Microarray results were analyzed using R2 software. Differentially expressed genes were selected based on fold change (≥ 2) in comparison with control group.
For qRT–PCR, 0.5 μg of RNA was transcribed using RevertAid Reverse Transcriptase according to protocol (Fermentas, Vilnius, Lithuania). Quantitative RT–PCR was performed on a Bio‐Rad iCycler using SensiFAST SYBR No‐ROX Kit (GC Biotech Bio‐98020) according to manufacturer's protocol. Cyclophilin was used as reference gene, and relative gene expression was calculated using the 2−delta Ct method. Primers sequences (specificity was tested using melting curve analyses) can be found in Appendix Table S2.
Enzyme activity
For the enzyme activity assay, organoids were washed with ice‐cold PBS to remove matrigel, collected in cell lysis buffer (Cell Signaling Technology), and stored at −80°C until use. Lactase, sucrase, trehalase, and maltase activity in the organoids were determined according to the method developed by Messer and Dahlqvist 39, 40. In short, samples were mild sonicated on ice for 3 s. For trehalase and maltase activity, samples were diluted five and ten times, respectively. 30 μl of (diluted) organoid lysate was incubated with 30 μl of 0.12 M lactose (with p‐chloromercuribenzoate as stabilizer to inhibit lysosomal p‐galactosidase activity), 0.0112 M maltose, 0.01 M sucrose, or 0.01 M trehalose (all from Sigma‐Aldrich) in 0.6 M maleic buffer (pH 6.0 Merck) for 60 min at 37°C. To determine the amount of glucose produced, 200 μl of the PGO‐color solution (10 U/ml glucose oxidase from Aspergillus niger, 2 U/ml peroxidase, and 8 mM o‐dianisidine in 0.5 M Tris–HCl buffer, pH 7.0; all from Sigma‐Aldrich) was added and the absorbance was measured at 450 nm every 5 min for 30 min at 37°C. A glucose standard was run in parallel to determine glucose production. Enzyme activity values were corrected for total amount of protein, as determined by BCA reaction 41, and are expressed as μM glucose/μg protein/min.
Arginase activity was measured using the Arginase Activity Assay Kit (Sigma‐Aldrich), according to the manufacturers’ protocol. 40 μl of five times diluted organoid lysate was incubated with arginine in buffer (pH 9.5) supplemented with manganese, for 2 h at 37°C. The urea produced was converted for 1 h to a colored product, and absorbance was measured at 430 nm. An urea standard was run in parallel. Enzyme activity values were corrected for total protein and are presented in units/l; one unit of arginase is the amount of enzyme that will convert 1.0 μM of l‐arginine to ornithine and urea per minute, at pH 9.5 and 37°C.
Immunohistochemistry
Tissue and organoids were fixed overnight in 4% formaldehyde, embedded in paraffin, and sectioned. For staining, sections were deparaffinized with xylene and gradually rehydrated in ethanol. After blocking the endogenous peroxidase (0.01% H2O2 in methanol), slides were boiled for 20 min at 100°C on a heat block in 0.01 M sodium citrate buffer (pH 6) for antigen retrieval. Slides were incubated overnight with primary antibody diluted in PBS with 1% bovine serum albumin and 0.1% Triton X‐100. Slides were washed with PBS and Powervision secondary antibody (Immunologic) was added for 30 min at room temperature, except for Blimp‐1 staining that required 1 h incubation with secondary antibody, followed by a 30‐min incubation with detection antibody. Antibody binding was visualized by adding chromagen substrate diaminobenzedine (Sigma‐Aldrich) according to the manufacturer's protocol.
For whole‐mount staining of organoids, organoids were collected from the matrigel by Cell Recovery Solution (Corning B.V.) and fixed overnight in 2% formaldehyde. After washing (PBS + glycine), permeabilization (PBS + 0.5% Triton X‐100), and blocking (IF‐wash + 10% goat serum), organoids were incubated with primary antibody for 1–2 h at RT. Staining was visualized with Alexa‐conjugated secondary antibody (1 h at RT) after which cells were mounted on a slide with ProLong™ Gold Antifade Reagent with DAPI (Invitrogen).
The following antibodies were used for immunohistochemistry: rabbit polyclonal anti‐argininosuccinate synthetase I (1:10,000, 42), rat monoclonal anti‐Blimp‐1 (1:250, Santa Cruz, clone 6D3), rabbit polyclonal anti‐rat IgG/biotinylated (1:200, Pierce Ab, 31834), streptavidin‐HRP (K0675, DAKO), mouse monoclonal anti‐lactase (1:4,000, A. Quaroni, DRBB 2/33), rabbit polyclonal anti‐mouse IgG/biotinylated (1:250, DAKO, ITK A90‐117B), rabbit polyclonal anti‐arginase II (1:1,000, 42), and goat polyclonal anti‐sucrase‐isomaltase (1:500, Santa Cruz, A17, sc27603). Antibodies used for immunofluorescence: rabbit polyclonal anti‐mucin2 (1:500, Santa Cruz, sc‐15334), rabbit polyclonal anti‐lysozyme (1:500, DAKO, A0099), goat polyclonal anti‐villin (1:100, Santa Cruz, sc‐7672), rabbit polyclonal anti‐synaptophysin (1:200, DAKO, A0010), goat anti‐rabbit IgG/biotinylated (1:200, DAKO, E0432), streptavidin‐FITC (1:250, DAKO, F0422), donkey anti‐goat IgG‐Alexa647 (1:500, Invitrogen, A21447), and goat anti‐rabbit IgG‐Alexa488 (1:500, Invitrogen, A11008).
Visualization of Lgr5 was performed using RNAscope®, an RNA in situ hybridization technique described previously 43. RNAscope was performed according to the “Formalin‐Fixed Paraffin‐Embedded (FFPE) Sample Preparation and Pretreatment for RNAscope 2.5 assay” and “RNAscope 2.5 HD Detection Reagent – RED” protocols as provided by the manufacturer. For RNAscope, the following probe was used: mm_Lgr5 (REF 312171, LOT 16250A).
Statistics
For all values, mean and standard error are given. One‐way analysis of variance was used to test whether an observed change over time was significant compared to day 3 of culture, with a Tukey post‐test. To compare differences between two different conditions, two‐way analysis of variance was performed with a Bonferroni post‐test, unless indicated otherwise in the figure legend. *P < 0.05, **P < 0.01, ***P < 0.001, NS = not significant.
Author contributions
MN and TMG designed and performed the experiments, analyzed the data, and wrote the manuscript. JLMV, MEW, and SM contributed to experiments and data analysis. Project design and concepts were developed by IBR, RMvE, GRvdB, and VM, who supervised the work and wrote the paper.
Conflict of interest
The authors declare that they have no conflict of interest.
Supporting information
Appendix
Expanded View Figures PDF
Table EV1
Movie EV1
Movie EV2
Review Process File
Acknowledgements
I.B.R. and R.M.v.E. are employees of Nutricia Research. G.R.vd.B. is employee of GlaxoSmithKline. This project was financially supported by Danone Nutricia Research.
EMBO Reports (2019) 20: e46221
Data availability
The microarray data from this publication have been deposited to the GEO database (https://www.ncbi.nlm.nih.gov/geo/) and assigned the identifier GSE118982.
References
- 1. de Santa Barbara P, van den Brink GR, Roberts DJ (2003) Development and differentiation of the intestinal epithelium. Cell Mol Life Sci 60: 1322–1332 [DOI] [PMC free article] [PubMed] [Google Scholar]
- 2. Dehmer JJ, Garrison AP, Speck KE, Dekaney CM, Van Landeghem L, Sun X, Henning SJ, Helmrath MA (2011) Expansion of intestinal epithelial stem cells during murine development. PLoS ONE 6: e27070 [DOI] [PMC free article] [PubMed] [Google Scholar]
- 3. Bry L, Falk P, Huttner K, Ouellette A, Midtvedt T, Gordon JI (1994) Paneth cell differentiation in the developing intestine of normal and transgenic mice. Proc Natl Acad Sci USA 91: 10335–10339 [DOI] [PMC free article] [PubMed] [Google Scholar]
- 4. Henning SJ (1981) Postnatal development: coordination of feeding, digestion, and metabolism. Am J Physiol 241: G199–G214 [DOI] [PubMed] [Google Scholar]
- 5. Van Beers EH, Buller HA, Grand RJ, Einerhand AW, Dekker J (1995) Intestinal brush border glycohydrolases: structure, function, and development. Crit Rev Biochem Mol Biol 30: 197–262 [DOI] [PubMed] [Google Scholar]
- 6. Gartner H, Shukla P, Markesich DC, Solomon NS, Oesterreicher TJ, Henning SJ (2002) Developmental expression of trehalase: role of transcriptional activation. Biochim Biophys Acta 1574: 329–336 [DOI] [PubMed] [Google Scholar]
- 7. Hurwitz R, Kretchmer N (1986) Development of arginine‐synthesizing enzymes in mouse intestine. Am J Physiol 251: G103–G110 [DOI] [PubMed] [Google Scholar]
- 8. De Jonge WJ, Dingemanse MA, de Boer PA, Lamers WH, Moorman AF (1998) Arginine‐metabolizing enzymes in the developing rat small intestine. Pediatr Res 43: 442–451 [DOI] [PubMed] [Google Scholar]
- 9. Martin MG, Wu SV, Walsh JH (1997) Ontogenetic development and distribution of antibody transport and Fc receptor mRNA expression in rat intestine. Dig Dis Sci 42: 1062–1069 [DOI] [PubMed] [Google Scholar]
- 10. Rath T, Kuo TT, Baker K, Qiao SW, Kobayashi K, Yoshida M, Roopenian D, Fiebiger E, Lencer WI, Blumberg RS (2013) The immunologic functions of the neonatal Fc receptor for IgG. J Clin Immunol 33(Suppl 1): S9–S17 [DOI] [PMC free article] [PubMed] [Google Scholar]
- 11. Menard S, Forster V, Lotz M, Gutle D, Duerr CU, Gallo RL, Henriques‐Normark B, Putsep K, Andersson M, Glocker EO et al (2008) Developmental switch of intestinal antimicrobial peptide expression. J Exp Med 205: 183–193 [DOI] [PMC free article] [PubMed] [Google Scholar]
- 12. Ferguson A, Gerskowitch VP, Russell RI (1973) Pre‐ and postweaning disaccharidase patterns in isografts of fetal mouse intestine. Gastroenterology 64: 292–297 [PubMed] [Google Scholar]
- 13. Rubin DC, Swietlicki E, Roth KA, Gordon JI (1992) Use of fetal intestinal isografts from normal and transgenic mice to study the programming of positional information along the duodenal‐to‐colonic axis. J Biol Chem 267: 15122–15133 [PubMed] [Google Scholar]
- 14. Nanthakumar NN, Klopcic CE, Fernandez I, Walker WA (2003) Normal and glucocorticoid‐induced development of the human small intestinal xenograft. Am J Physiol Regul Integr Comp Physiol 285: R162–R170 [DOI] [PubMed] [Google Scholar]
- 15. Muncan V, Heijmans J, Krasinski SD, Buller NV, Wildenberg ME, Meisner S, Radonjic M, Stapleton KA, Lamers WH, Biemond I et al (2011) Blimp1 regulates the transition of neonatal to adult intestinal epithelium. Nat Commun 2: 452 [DOI] [PMC free article] [PubMed] [Google Scholar]
- 16. Harper J, Mould A, Andrews RM, Bikoff EK, Robertson EJ (2011) The transcriptional repressor Blimp1/Prdm1 regulates postnatal reprogramming of intestinal enterocytes. Proc Natl Acad Sci USA 108: 10585–10590 [DOI] [PMC free article] [PubMed] [Google Scholar]
- 17. Solomon NS, Gartner H, Oesterreicher TJ, Henning SJ (2001) Development of glucocorticoid‐responsiveness in mouse intestine. Pediatr Res 49: 782–788 [DOI] [PubMed] [Google Scholar]
- 18. McDonald MC, Henning SJ (1992) Synergistic effects of thyroxine and dexamethasone on enzyme ontogeny in rat small intestine. Pediatr Res 32: 306–311 [DOI] [PubMed] [Google Scholar]
- 19. Nanthakumar NN, Meng D, Newburg DS (2013) Glucocorticoids and microbiota regulate ontogeny of intestinal fucosyltransferase 2 requisite for gut homeostasis. Glycobiology 23: 1131–1141 [DOI] [PMC free article] [PubMed] [Google Scholar]
- 20. Ballard O, Morrow AL (2013) Human milk composition: nutrients and bioactive factors. Pediatr Clin North Am 60: 49–74 [DOI] [PMC free article] [PubMed] [Google Scholar]
- 21. Holscher HD, Davis SR, Tappenden KA (2014) Human milk oligosaccharides influence maturation of human intestinal Caco‐2Bbe and HT‐29 cell lines. J Nutr 144: 586–591 [DOI] [PubMed] [Google Scholar]
- 22. Pott J, Stockinger S, Torow N, Smoczek A, Lindner C, McInerney G, Backhed F, Baumann U, Pabst O, Bleich A et al (2012) Age‐dependent TLR3 expression of the intestinal epithelium contributes to rotavirus susceptibility. PLoS Pathog 8: e1002670 [DOI] [PMC free article] [PubMed] [Google Scholar]
- 23. Zhang K, Dupont A, Torow N, Gohde F, Leschner S, Lienenklaus S, Weiss S, Brinkmann MM, Kuhnel M, Hensel M et al (2014) Age‐dependent enterocyte invasion and microcolony formation by Salmonella. PLoS Pathog 10: e1004385 [DOI] [PMC free article] [PubMed] [Google Scholar]
- 24. Rings EH, Krasinski SD, van Beers EH, Moorman AF, Dekker J, Montgomery RK, Grand RJ, Buller HA (1994) Restriction of lactase gene expression along the proximal‐to‐distal axis of rat small intestine occurs during postnatal development. Gastroenterology 106: 1223–1232 [DOI] [PubMed] [Google Scholar]
- 25. Lee SY, Wang Z, Lin CK, Contag CH, Olds LC, Cooper AD, Sibley E (2002) Regulation of intestine‐specific spatiotemporal expression by the rat lactase promoter. J Biol Chem 277: 13099–13105 [DOI] [PubMed] [Google Scholar]
- 26. Fordham RP, Yui S, Hannan NR, Soendergaard C, Madgwick A, Schweiger PJ, Nielsen OH, Vallier L, Pedersen RA, Nakamura T et al (2013) Transplantation of expanded fetal intestinal progenitors contributes to colon regeneration after injury. Cell Stem Cell 13: 734–744 [DOI] [PMC free article] [PubMed] [Google Scholar]
- 27. Henning SJ, Guerin DM (1981) Role of diet in the determination of jejunal sucrase activity in the weanling rat. Pediatr Res 15: 1068–1072 [DOI] [PubMed] [Google Scholar]
- 28. Sekirov I, Russell SL, Antunes LC, Finlay BB (2010) Gut microbiota in health and disease. Physiol Rev 90: 859–904 [DOI] [PubMed] [Google Scholar]
- 29. Nanthakumar NN, Henning SJ (1993) Ontogeny of sucrase‐isomaltase gene expression in rat intestine: responsiveness to glucocorticoids. Am J Physiol 264: G306–G311 [DOI] [PubMed] [Google Scholar]
- 30. Beaulieu JF, Calvert R (1985) Influences of dexamethasone on the maturation of fetal mouse intestinal mucosa in organ culture. Comp Biochem Physiol A Comp Physiol 82: 91–95 [DOI] [PubMed] [Google Scholar]
- 31. Kedinger M, Simon PM, Raul F, Grenier JF, Haffen K (1980) The effect of dexamethasone on the development of rat intestinal brush border enzymes in organ culture. Dev Biol 74: 9–21 [DOI] [PubMed] [Google Scholar]
- 32. Sato T, Vries RG, Snippert HJ, van de Wetering M, Barker N, Stange DE, van Es JH, Abo A, Kujala P, Peters PJ et al (2009) Single Lgr5 stem cells build crypt‐villus structures in vitro without a mesenchymal niche. Nature 459: 262–265 [DOI] [PubMed] [Google Scholar]
- 33. Mustata RC, Vasile G, Fernandez‐Vallone V, Strollo S, Lefort A, Libert F, Monteyne D, Perez‐Morga D, Vassart G, Garcia MI (2013) Identification of Lgr5‐independent spheroid‐generating progenitors of the mouse fetal intestinal epithelium. Cell Rep 5: 421–432 [DOI] [PubMed] [Google Scholar]
- 34. van Elburg RM, Fetter WP, Bunkers CM, Heymans HS (2003) Intestinal permeability in relation to birth weight and gestational and postnatal age. Arch Dis Child Fetal Neonatal Ed 88: F52–F55 [DOI] [PMC free article] [PubMed] [Google Scholar]
- 35. Auricchio S, Rubino A, Muerset G (1965) Intestinal glycosidase activities in the human embryo, fetus, and newborn. Pediatrics 35: 944–954 [PubMed] [Google Scholar]
- 36. Kosek M, Guerrant RL, Kang G, Bhutta Z, Yori PP, Gratz J, Gottlieb M, Lang D, Lee G, Haque R et al (2014) Assessment of environmental enteropathy in the MAL‐ED cohort study: theoretical and analytic framework. Clin Infect Dis 59(Suppl 4): S239–S247 [DOI] [PMC free article] [PubMed] [Google Scholar]
- 37. Oria RB, Murray‐Kolb LE, Scharf RJ, Pendergast LL, Lang DR, Kolling GL, Guerrant RL (2016) Early‐life enteric infections: relation between chronic systemic inflammation and poor cognition in children. Nutr Rev 74: 374–386 [DOI] [PMC free article] [PubMed] [Google Scholar]
- 38. Sato T, van Es JH, Snippert HJ, Stange DE, Vries RG, van den Born M, Barker N, Shroyer NF, van de Wetering M, Clevers H (2011) Paneth cells constitute the niche for Lgr5 stem cells in intestinal crypts. Nature 469: 415–418 [DOI] [PMC free article] [PubMed] [Google Scholar]
- 39. Dahlqvist A (1984) Assay of intestinal disaccharidases. Scand J Clin Lab Invest 44: 169–172 [DOI] [PubMed] [Google Scholar]
- 40. Messer M, Dahlqvist A (1966) A one‐step ultramicro method for the assay of intestinal disaccharidases. Anal Biochem 14: 376–392 [DOI] [PubMed] [Google Scholar]
- 41. Smith PK, Krohn RI, Hermanson GT, Mallia AK, Gartner FH, Provenzano MD, Fujimoto EK, Goeke NM, Olson BJ, Klenk DC (1985) Measurement of protein using bicinchoninic acid. Anal Biochem 150: 76–85 [DOI] [PubMed] [Google Scholar]
- 42. Schmidlin A, Kalbacher H, Wiesinger H (1997) Presence of argininosuccinate synthetase in glial cells as revealed by peptide‐specific antisera. Biol Chem 378: 47–50 [DOI] [PubMed] [Google Scholar]
- 43. Wang F, Flanagan J, Su N, Wang LC, Bui S, Nielson A, Wu X, Vo HT, Ma XJ, Luo Y (2012) RNAscope: a novel in situ RNA analysis platform for formalin‐fixed, paraffin‐embedded tissues. J Mol Diagn 14: 22–29 [DOI] [PMC free article] [PubMed] [Google Scholar]
Associated Data
This section collects any data citations, data availability statements, or supplementary materials included in this article.
Supplementary Materials
Appendix
Expanded View Figures PDF
Table EV1
Movie EV1
Movie EV2
Review Process File
Data Availability Statement
The microarray data from this publication have been deposited to the GEO database (https://www.ncbi.nlm.nih.gov/geo/) and assigned the identifier GSE118982.


