

Abstract
Background
In children below the age of 2 years, bronchiolitis is the most common reason for hospitalization. Each year in the United States, bronchiolitis causes 287,000 emergency department visits, 32%-40% of which result in hospitalization. Due to a lack of evidence and objective criteria for managing bronchiolitis, clinicians often make emergency department disposition decisions on hospitalization or discharge to home subjectively, leading to large practice variation. Our recent study provided the first operational definition of appropriate hospital admission for emergency department patients with bronchiolitis and showed that 6.08% of emergency department disposition decisions for bronchiolitis were inappropriate. An accurate model for predicting appropriate hospital admission can guide emergency department disposition decisions for bronchiolitis and improve outcomes, but has not been developed thus far.
Objective
The objective of this study was to develop a reasonably accurate model for predicting appropriate hospital admission.
Methods
Using Intermountain Healthcare data from 2011-2014, we developed the first machine learning classification model to predict appropriate hospital admission for emergency department patients with bronchiolitis.
Results
Our model achieved an accuracy of 90.66% (3242/3576, 95% CI: 89.68-91.64), a sensitivity of 92.09% (1083/1176, 95% CI: 90.33-93.56), a specificity of 89.96% (2159/2400, 95% CI: 88.69-91.17), and an area under the receiver operating characteristic curve of 0.960 (95% CI: 0.954-0.966). We identified possible improvements to the model to guide future research on this topic.
Conclusions
Our model has good accuracy for predicting appropriate hospital admission for emergency department patients with bronchiolitis. With further improvement, our model could serve as a foundation for building decision-support tools to guide disposition decisions for children with bronchiolitis presenting to emergency departments.
International Registered Report Identifier (IRRID)
RR2-10.2196/resprot.5155
Keywords: bronchiolitis, appropriate hospital admission, emergency department, predictive model, machine learning
Introduction
Bronchiolitis refers to inflammation of the bronchioles, the smallest air passages in the lungs, mainly seen in children below the age of 2 years [1]. More than one-third of children in the United States have been diagnosed with bronchiolitis by the age of 2 years [1]. In children below the age of 2 years, bronchiolitis is responsible for 16% of the hospitalizations and is the most common reason for hospitalization [2-5]. In the United States, bronchiolitis annually leads to approximately 287,000 emergency department (ED) visits [6], 128,000 hospitalizations [2], and US $1.73 billion in total inpatient costs (2009) [2].
About 32%-40% of ED visits for bronchiolitis result in hospitalization [7-9]. Current clinical guidelines for bronchiolitis [10,11] acknowledge that due to a lack of evidence and objective criteria for managing bronchiolitis, clinicians often make ED disposition decisions of hospitalization or discharge to home subjectively [4,12]. This uncertainty in bronchiolitis management leads to large practice variation [3,12-23], increased iatrogenic risk, suboptimal outcomes, and wasted healthcare resources resulting from unnecessary admissions and unsafe discharges [15,21,24]. Approximately 10% of infants with bronchiolitis experience adverse events during hospital stay [25]. By examining the distributions of multiple relevant attributes of ED visits for bronchiolitis and using a data-driven method to determine two threshold values, we recently developed the first operational definition of appropriate hospital admission for ED patients with bronchiolitis [26]. Appropriate admissions cover both necessary admissions (actual admissions that are necessary) and unsafe discharges (Figure 1). Appropriate ED discharges cover both safe discharges and unnecessary admissions. Unsafe discharges are defined based on early ED returns. Unnecessary admissions are defined based on brief exposure to certain major medical interventions (Figure 1). Brief exposure was defined as exposure of ≤6 hours, with the threshold value of 6 hours chosen conservatively based on the median duration of major medical interventions received by a subset of patients who tended to have been admitted unnecessarily. Based on the operational definition, we showed that 6.08% of ED disposition decisions for bronchiolitis were inappropriate [26].
Figure 1.
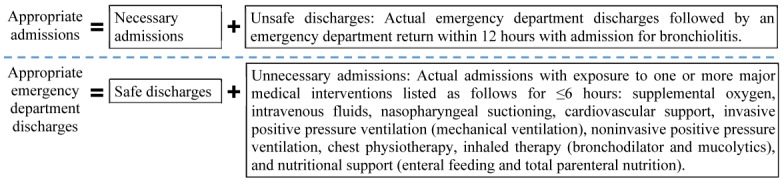
The operational definition of appropriate hospital admission for emergency department patients with bronchiolitis.
Thus far, several models have been built for predicting hospital admission in ED patients with bronchiolitis [7-9,27-29]. As our review paper [30] pointed out, these models have low accuracy and incorrectly assume that actual ED disposition decisions are always appropriate. An accurate model for predicting appropriate hospital admission can guide ED disposition decisions for bronchiolitis and improve outcomes. This model, which is yet to be built, would be particularly useful for less experienced clinicians, including junior clinicians and those in general practice who attend to children infrequently [31]. The objective of this study was to build the first model to predict appropriate hospital admission for ED patients with bronchiolitis. The dependent variable of the appropriate ED disposition decision is categorical and has two possible values: appropriate admission and appropriate ED discharge. Accordingly, the model uses clinical and administrative data to conduct binary classification.
Methods
Study Design and Ethical Approval
In this study, we performed secondary analysis of retrospective data. The Institutional Review Boards of the University of Washington Medicine, University of Utah, and Intermountain Healthcare reviewed and approved this study and waived the need for informed consent for all patients.
Patient Population
Our patient cohort consisted of children below the age of 2 years who visited the ED for bronchiolitis in 2013-2014 at any of the 22 Intermountain Healthcare hospitals. Intermountain Healthcare is the largest healthcare system in Utah, with 22 hospitals and 185 clinics delivering ~85% of pediatric care in Utah [32]. Similar to our previous paper [26], we adopted the approach used in Flaherman et al [33-35] to identify as many ED visits for bronchiolitis as possible. This approach included patients with an ED or hospital International Classification of Diseases, Ninth Revision, Clinical Modification (ICD-9-CM) primary discharge diagnosis code of bronchiolitis or bronchitis (466.x), viral pneumonia (480.x), adenoviral infection (079.0), rhinovirus infection (079.3), respiratory infection due to influenza (487.0 or 487.1), respiratory syncytial virus (079.6), H1N1 influenza (488.1, 488.11, or 488.12), influenza due to identified avian influenza virus (488, 488.0, 488.01, or 488.02), or influenza due to novel influenza A (488.81 or 488.82). Any of these discharge diagnosis codes, rather than only the discharge diagnosis code of bronchiolitis, could be assigned to an ED visit for bronchiolitis. In addition, this approach included all patients with any of the abovementioned codes as a nonprimary diagnosis code, as long as the ICD-9-CM primary diagnosis code was any of the following: apnea (786.03), shortness of breath (786.05), tachypnea (786.06), wheezing (786.07), other respiratory abnormalities (786.09), cough (786.2), fever (780.60 or 780.61), acute nasopharyngitis (460), acute upper respiratory infections (465.x), other specified viral infection (079.89), urinary tract infection (599.0), pneumonia unspecified organism (486), unspecified viral infection (079.99), volume depletion (276.5x), or respiratory failure (518.81 or 518.82) [26]. The ED visits for bronchiolitis captured by this approach in 2013-2014 are the focus of our study.
Data Set
From Intermountain Healthcare’s enterprise data warehouse, we extracted a clinical and administrative data set containing information of our patient cohort’s inpatient stays, ED visits, and outpatient visits at Intermountain Healthcare in 2011-2014. Our patient cohort included children below the age of 2 years who visited the Intermountain Healthcare ED for bronchiolitis in 2013-2014. By starting the data set in 2011, we ensured that for each ED visit by a target patient in 2013-2014, the data set included the patient’s complete prior medical history recorded within Intermountain Healthcare and necessary for computing features (also known as independent variables).
Features
The 35 candidate patient features fall into two disjoint categories. Category 1 includes all known predictors of hospital admission in ED patients with bronchiolitis, which were consistently recorded at Intermountain Healthcare facilities and available as structured attributes in our data set [30,31]. These 15 predictors are age in days, gender, heart rate, respiratory rate, peripheral capillary oxygen saturation (SpO2), temperature, coinfection, rhinovirus infection, enterovirus infection, history of bronchopulmonary dysplasia, history of eczema, prior intubation, prior hospitalization, prematurity, and dehydration. For any vital sign that was recorded more than once during the ED visit, we used its last value as its feature value. Among all recorded values, the last value most closely reflected the patient’s status at the time of ED disposition.
Category 2 consists of 20 features suggested by our team’s clinical experts BLS, MDJ, and FLN: race, ethnicity, insurance category (public, private, or self-paid or charity), the ED visit’s acuity level (resuscitation, emergent, urgent, semiurgent, or nonurgent), chief complaint, number of consults during the ED visit, number of laboratory tests ordered during the ED visit, number of radiology studies ordered during the ED visit, number of X-rays ordered during the ED visit, length of ED stay in minutes, hour of ED disposition, whether the patient is up-to-date with his/her immunizations, diastolic blood pressure, systolic blood pressure, weight, wheezing (none, expiratory, inspiratory and expiratory, or diminished breath sounds), retractions (none, one location, two locations, or three or more locations), respiratory syncytial virus infection, language barrier to learning, and whether the patient has any other barrier to learning. For either attribute of wheezing and retractions that was recorded more than once during the ED visit, we used its last value as its feature value. Among all recorded values, the last value most closely reflected the patient’s status at ED disposition time.
Based on the timestamp, all candidate features were available as structured attributes in our data set before the time of ED disposition. We used these features to build predictive models.
Data Analysis
Data Preparation
For each ED visit by a patient below the age of 2 years for bronchiolitis in 2013-2014, we used our previously developed operational definition of appropriate admission [26] (Figure 1) to compute the dependent variable’s value. For each numerical feature, we examined the data distribution, used the upper and lower bounds given by our team’s ED expert MDJ to identify invalid values, and replaced each invalid value with a null value. All temperatures<80°F or >110°F, all weights>50 pounds, all systolic blood pressure values of 0, all SpO2 values>100%, all respiratory rates>120 breaths/minute, and all heart rates<30 or >300 beats/minute were regarded as physiologically impossible and invalid. To ensure that all data were on the same scale, we standardized each numerical feature by first subtracting its mean and then dividing by its SD. We focused on 2 years of data for ED visits for bronchiolitis (2013-2014). Data from the first year (2013) were used to train predictive models. Data from the second year (2014) were used to evaluate model performance, reflecting use in practice.
Performance Metrics
As shown in Table 1 and the formulas below, we used six standard metrics to measure model performance: accuracy, sensitivity, specificity, positive predictive value (PPV), negative predictive value (NPV), and area under the receiver operating characteristic curve (AUC). For instance, false negative (FN) is the number of appropriate admissions that the model incorrectly predicts to be ED discharges. Sensitivity measures the proportion of appropriate admissions that the model identifies. Specificity measures the proportion of appropriate ED discharges that the model identifies.
Table 1.
The error matrix.
| Class | Appropriate admission | Appropriate emergency department discharge |
| Predicted admission | True positive | False positive |
| Predicted emergency department discharge | False negative | True negative |
| Accuracy=(TP+TN)/(TP+TN+FP+FN) |
| Sensitivity=TP/(TP+FN) |
| Specificity=TN/(TN+FP) |
| PPV=TP/(TP+FP) |
| NPV=TN/(TN+FN) |
TP is true positive, TN is true negative, and FP is false negative.
For the six performance metrics, we conducted 1000-fold bootstrap analysis [36] to compute their 95% CIs. On each bootstrap sample of the 2014 data, we computed our model’s performance metrics. For each of the six performance metrics, the 2.5th and 97.5th percentiles in the 1000 bootstrap samples specified its 95% CI.
To show the sensitivity-specificity tradeoff, we plotted the receiver operating characteristic curve. The calibration of a model refers to how well the predicted probabilities of appropriate admission match with the fractions of appropriate admissions in subgroups of ED visits for bronchiolitis. To show model calibration, we drew a calibration plot [36]. A perfect calibration curve would coincide with the diagonal line. In addition, we used the Hosmer-Lemeshow goodness-of-fit test [36] to evaluate model calibration.
Classification Algorithms
We used Weka [37], a widely used open-source machine learning and data mining toolkit, to build machine learning classification models. Machine learning studies computer algorithms that learn from data, such as random forest, support vector machine, and neural network, and has won most data science competitions [38]. Weka integrates many commonly used machine learning algorithms and feature-selection techniques. We considered all 39 machine learning classification algorithms in the standard Weka package and adopted our previously developed automatic machine learning model selection method [39] and the training data of 2013 to automatically select the algorithm, feature-selection technique, and hyperparameter values among all the applicable ones. In a machine learning algorithm, hyperparameters are the parameters whose values are traditionally manually set by the machine learning software user before model training. An example of a hyperparameter is the number of decision trees used in a random forest classifier. Our automatic machine learning model selection method [39] uses the Bayesian optimization (also known as response surface) methodology to automatically explore numerous combinations of algorithm, feature-selection technique, and hyperparameter values and performs three-fold cross-validation to select the final combination maximizing the AUC. Compared to the other five performance metrics—accuracy, sensitivity, specificity, PPV, and NPV— AUC has the advantage of not relying on the cutoff threshold for deciding between predicted admission and predicted ED discharge.
Demographic and Clinical Characteristics of the Patient Cohort
Tables 2 and 3 show the demographic and clinical characteristics of our patient cohort: children below the age of 2 years who visited the ED for bronchiolitis in 2013 and 2014, respectively. The characteristics are mostly similar between both years. About 40.78% (1640/4022) and 38.26% (1368/3576) of ED visits for bronchiolitis ended in hospitalization in 2013 and 2014, respectively. About 35.80% (1440/4022) and 32.89% (1176/3576) of ED visits for bronchiolitis were deemed to be appropriate hospital admissions in 2013 and 2014, respectively.
Table 2.
Demographic and clinical characteristics of children under the age of 2 years who visited the emergency department at Intermountain Healthcare hospitals for bronchiolitis in 2013.
| Characteristic | Emergency department visits (N=4022), n (%) | Emergency department visits discharged to home (N=2382), n (%) | Emergency department visits ending in hospitalization (N=1640), n (%) | |
| Age | ||||
|
|
<2 months | 518 (12.88) | 211 (8.86) | 307 (18.72) |
|
|
2 to <12 months | 2424 (60.27) | 1498 (62.89) | 926 (56.46) |
|
|
12 to 24 months | 1080 (26.85) | 673 (28.25) | 407 (24.82) |
| Gender | ||||
|
|
Male | 2369 (58.90) | 1414 (59.36) | 955 (58.23) |
|
|
Female | 1653 (41.10) | 968 (40.64) | 685 (41.77) |
| Race | ||||
|
|
American Indian or Alaska native | 51 (1.27) | 26 (1.09) | 25 (1.52) |
|
|
Asian | 49 (1.22) | 20 (0.84) | 29 (1.77) |
|
|
Black or African American | 124 (3.08) | 78 (3.27) | 46 (2.80) |
|
|
Native Hawaiian or other Pacific Islander | 321 (7.98) | 160 (6.72) | 161 (9.82) |
|
|
White | 2940 (73.10) | 1784 (74.90) | 1156 (70.49) |
|
|
Unknown or not reported | 537 (13.35) | 314 (13.18) | 223 (13.60) |
| Ethnicity | ||||
|
|
Hispanic | 1321 (32.84) | 826 (34.68) | 495 (30.18) |
|
|
Non-Hispanic | 2687 (66.81) | 1549 (65.03) | 1138 (69.39) |
|
|
Unknown or not reported | 14 (0.35) | 7 (0.29) | 7 (0.43) |
| Insurance | ||||
|
|
Private | 2436 (60.57) | 1338 (56.17) | 1098 (66.95) |
|
|
Public | 1422 (35.36) | 933 (39.17) | 489 (29.82) |
|
|
Self-paid or charity | 164 (4.08) | 111 (4.66) | 53 (3.23) |
| Asthma | 207 (5.15) | 72 (3.02) | 135 (8.23) | |
| Chronic complex condition [40] | 296 (7.36) | 60 (2.52) | 236 (14.39) | |
Table 3.
Demographic and clinical characteristics of children under the age of 2 years who visited the emergency department at Intermountain Healthcare hospitals for bronchiolitis in 2014.
| Characteristic | Emergency department visits (N=3576), n (%) | Emergency department visits discharged to home (N=2208), n (%) | Emergency department visits ending in hospitalization (N=1368), n (%) | |
| Age | ||||
|
|
<2 months | 454 (12.70) | 186 (8.42) | 268 (19.59) |
|
|
2 to <12 months | 2079 (58.14) | 1379 (62.45) | 700 (51.17) |
|
|
12 to 24 months | 1043 (29.17) | 643 (29.12) | 400 (29.24) |
| Gender | ||||
|
|
Male | 2059 (57.58) | 1273 (57.65) | 786 (57.46) |
|
|
Female | 1517 (42.42) | 935 (42.35) | 582 (42.54) |
| Race | ||||
|
|
American Indian or Alaska Native | 47 (1.31) | 31 (1.40) | 16 (1.17) |
|
|
Asian | 68 (1.90) | 40 (1.81) | 28 (2.05) |
|
|
Black or African American | 104 (2.91) | 70 (3.17) | 34 (2.49) |
|
|
Native Hawaiian or other Pacific Islander | 284 (7.94) | 180 (8.15) | 104 (7.60) |
|
|
White | 2795 (78.16) | 1708 (77.36) | 1087 (79.46) |
|
|
Unknown or not reported | 278 (7.77) | 179 (8.11) | 99 (7.24) |
| Ethnicity | ||||
|
|
Hispanic | 1071 (29.95) | 727 (32.93) | 344 (25.15) |
|
|
Non-Hispanic | 2484 (69.46) | 1464 (66.30) | 1020 (74.56) |
|
|
Unknown or not reported | 21 (0.59) | 17 (0.77) | 4 (0.29) |
| Insurance | ||||
|
|
Private | 2175 (60.82) | 1241 (56.20) | 934 (68.27) |
|
|
Public | 1256 (35.12) | 860 (38.95) | 396 (28.95) |
|
|
Self-paid or charity | 145 (4.05) | 107 (4.85) | 38 (2.78) |
| Asthma | 210 (5.87) | 67 (3.03) | 143 (10.45) | |
| Chronic complex condition [40] | 252 (7.05) | 43 (1.94) | 209 (15.28) | |
Based on the χ2 two-sample test, for the 2013 data, the ED visits discharged to home and those ending in hospitalization showed the same distribution for gender (P=.49) and different distributions for race (P<.001), ethnicity (P=.01), and insurance category (P<.001). For the 2014 data, the ED visits discharged to home and those ending in hospitalization showed the same distribution for gender (P=.94) and race (P=.61) and different distributions for ethnicity (P<.001) and insurance category (P<.001). Based on the Cochran-Armitage trend test [41], for both the 2013 and 2014 data, the ED visits discharged to home and those ending in hospitalization showed different distributions for age (P<.001).
Results
Our automatic machine learning model selection method [39] chose the random forest classification algorithm. Random forest can naturally handle missing feature values. Our model was built using this algorithm and the 33 features shown in Table 4. These features are sorted in descending order of their importance values, which were automatically computed by the random forest algorithm in Weka based on average impurity decrease. In general, the features related to the patient’s history are ranked lower than those reflecting the patient’s status in the current ED visit. This intuitively makes medical sense. Two candidate patient features—ethnicity and the ED visit’s acuity level—were not used in our model because they did not increase the model’s accuracy.
Table 4.
Features used in our model and their importance.
| Feature | Importance based on average impurity decrease |
| Hour of EDa disposition | 0.42 |
| Age in days | 0.40 |
| Whether the patient has any other barrier to learning | 0.39 |
| Length of ED stay in minutes | 0.38 |
| Number of laboratory tests ordered during the ED visit | 0.37 |
| Heart rate | 0.37 |
| Diastolic blood pressure | 0.36 |
| Gender | 0.35 |
| Temperature | 0.35 |
| Respiratory rate | 0.34 |
| Number of radiology studies ordered during the ED visit | 0.34 |
| Insurance category | 0.34 |
| Number of X-rays ordered during the ED visit | 0.34 |
| Systolic blood pressure | 0.34 |
| Weight | 0.33 |
| Chief complaint | 0.32 |
| SpO2b | 0.32 |
| Wheezing | 0.32 |
| Retractions | 0.29 |
| Number of consults during the ED visit | 0.28 |
| Whether the patient is up-to-date with his/her immunizations | 0.27 |
| Race | 0.27 |
| Enterovirus infection | 0.25 |
| Respiratory syncytial virus infection | 0.24 |
| Coinfection | 0.24 |
| Prior hospitalization | 0.22 |
| Prior intubation | 0.22 |
| Dehydration | 0.20 |
| Language barrier to learning | 0.20 |
| Rhinovirus infection | 0.20 |
| Prematurity | 0.18 |
| History of bronchopulmonary dysplasia | 0.16 |
| History of eczema | 0.15 |
aED: emergency department.
bSpO2: peripheral capillary oxygen saturation.
Figure 2 shows the receiver operating characteristic curve of our model. Weka uses 50% as its default probability cutoff threshold for making binary classifications. Table 5 shows the error matrix of our model. Table 6 compares our model and the ED clinician’s disposition decision. Our model achieved an accuracy of 90.66% (3242/3576; 95% CI: 89.68-91.64), a sensitivity of 92.09% (1083/1176; 95% CI: 90.33-93.56), a specificity of 89.96% (2159/2400; 95% CI: 88.69-91.17), an AUC of 0.960 (95% CI: 0.954-0.966), a PPV of 81.80% (1083/1324; 95% CI: 79.67-83.80), and an NPV of 95.87% (2159/2252; 95% CI: 95.00-96.65). If we removed the insurance category feature, our model achieved a lower accuracy of 90.32% (3230/3576; 95% CI: 89.37-91.28), a lower sensitivity of 90.22% (1061/1176; 95% CI: 88.30-91.79), a specificity of 90.38% (2169/2400; 95% CI: 89.15-91.57), an AUC of 0.960 (95% CI: 0.955-0.966), a PPV of 82.12% (1061/1292; 95% CI: 79.94-84.15), and a lower NPV of 94.97% (2169/2284; 95% CI: 93.97-95.78). In comparison, the ED clinician’s disposition decision achieved an accuracy of 93.68% (3350/3576; 95% CI: 92.87-94.49), a sensitivity of 98.55% (1159/1176; 95% CI: 97.85-99.24), a specificity of 91.29% (2191/2400; 95% CI: 90.05-92.46), an AUC of 0.949 (95% CI: 0.942-0.956), a PPV of 84.72% (1159/1368; 95% CI: 82.83-86.69), and an NPV of 99.23% (2191/2208; 95% CI: 98.86-99.59).
Figure 2.
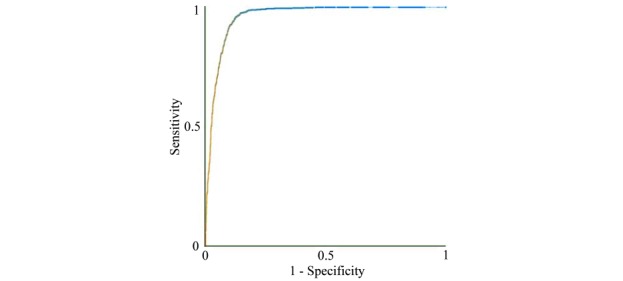
The receiver operating characteristic curve of our model.
Table 5.
The error matrix of our predictive model.
| Class | Appropriate admission | Appropriate emergency department discharge |
| Predicted admission | 1083 | 241 |
| Predicted emergency department discharge | 93 | 2159 |
Table 6.
A comparison of our model and the emergency department clinician’s disposition decision.
|
|
Accuracy (%) | Sensitivity (%) | Specificity (%) | AUCa | PPVb (%) | NPVc (%) |
| Our model | 90.66 | 92.09 | 89.96 | 0.960 | 81.80 | 95.87 |
| The emergency department clinician’s disposition decision | 93.68 | 98.55 | 91.29 | 0.949 | 84.72 | 99.23 |
aAUC: area under the receiver operating characteristic curve.
bPPV: positive predictive value.
cNPV: negative predictive value.
Figure 3 shows the calibration plot of our model by decile of predicted probability of appropriate admission. The Hosmer-Lemeshow test showed imperfect calibration of the predicted probabilities and the actual outcomes (P<.001). When the predicted probability is <0.5, our model tends to overestimate the actual probability. When the predicted probability is >0.5, our model tends to underestimate the actual probability.
Figure 3.
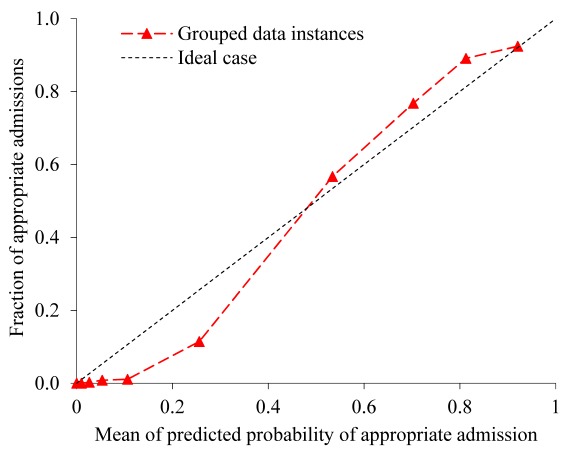
The calibration plot of our model by decile of predicted probability of appropriate admission.
Discussion
Principal Results
We developed the first machine learning classification model to accurately predict appropriate hospital admission for ED patients with bronchiolitis. Our model is a significant improvement over the previous models for predicting hospital admission in ED patients with bronchiolitis [7-9,27-29]. Our model has good accuracy, with five of the six performance metrics achieving a value ≥90% and the other metric achieving a value >80%. Although our model attained a 3.02% lower accuracy than Intermountain Healthcare clinicians’ ED disposition decisions (90.66% vs 93.68%), we still view our model as a step forward with great potential. Within 0.01 second, our model can output the prediction result for a new patient. With further improvement to boost its accuracy and automatically explain its prediction results [42,43], our model could be integrated into an electronic health record system and become the base of a decision-support tool to help make appropriate ED disposition decisions for bronchiolitis. At that time, a clinician could use the model’s output as a point of reference when considering the disposition decision. This could provide value, improve outcomes, and reduce health care costs for bronchiolitis, regardless of whether our future final model can achieve a higher accuracy than Intermountain Healthcare clinicians’ ED disposition decisions. Our faith in this model stems from the following considerations:
Intermountain Healthcare has several collaborative partnerships among its EDs and hospitals to facilitate coordination of pediatric specialty care and has completed multiple quality-improvement projects for bronchiolitis management. About 52.16% (3963/7598) of ED visits for bronchiolitis within Intermountain Healthcare occur at a tertiary pediatric hospital with an ED staffed by pediatric-specific clinicians. On average, the ED disposition decisions for bronchiolitis made at Intermountain Healthcare could be more accurate than those made at some other healthcare systems, especially those systems with general practice physicians or fewer pediatricians working in their EDs. Our model can be valuable for those systems, if it reaches a higher accuracy than the clinicians’ ED disposition decisions made at those systems. There is some evidence indicating this possibility. Most inappropriate ED disposition decisions are unnecessary admissions [26]. In our data set, 14.36% of hospital admissions from the ED were deemed unnecessary [26]. In the literature [44,45], this percentage is reported to be larger (20%-29%). To understand our model’s value for other systems, additional studies need to be conducted using data of those systems. This is an interesting area for future work.
Figure 4 shows the degree of missing values of each feature with missing values. Figure 5 shows the probability mass function of the number of features with missing values in each data instance. In our data set, several attributes have numerous missing values because those values were either recorded on paper or occasionally undocumented and therefore were not available in Intermountain Healthcare’s electronic health record system. In particular, wheezing and retractions values were missing for 73.56% (5589/7598) of ED visits for bronchiolitis. Systolic and diastolic blood pressure values were missing for 46.49% (3532/7598) of ED visits for bronchiolitis. This could lower the model’s accuracy. In the future, these attributes are expected to be recorded more completely in Intermountain Healthcare’s newly implemented Cerner-based electronic health record system. After retraining our model on more complete Intermountain Healthcare data from future years, we would expect its accuracy to increase. In addition, multiple other healthcare systems like Seattle Children’s Hospital have been using the Cerner electronic health record system to record these attributes relatively completely for many years. Our model could possibly achieve a higher accuracy if trained with data from those systems. Both of these areas are interesting for future work.
When making ED disposition decisions for bronchiolitis, clinicians often face some level of uncertainty and would prefer to obtain a second opinion by a reasonably accurate predictive model, particularly if some technique is used to automatically explain the model’s prediction results. For this purpose, we can use our prior method [42,43] to automatically provide rule-based explanations for any machine learning model’s classification results with no accuracy loss.
Figure 4.
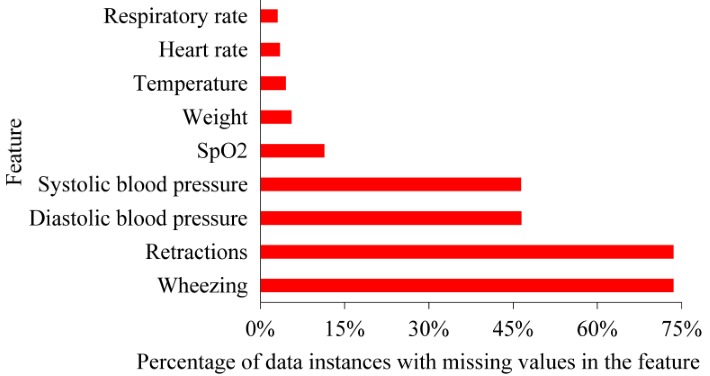
The degree of missing values of each feature with missing values. SpO2: peripheral capillary oxygen saturation.
Figure 5.
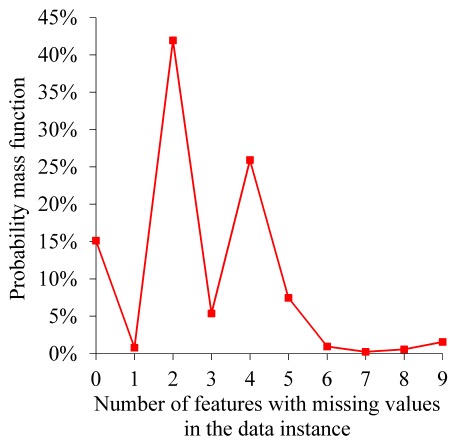
The probability mass function of the number of features with missing values in each data instance.
When reporting the performance metrics, we used the default cut-off threshold that Weka chose in order to decide between predicted admission and predicted ED discharge. Different health care systems could emphasize different performance metrics and provide divergent weights to FPs and FNs. As is the case with predictive modeling, in general, a health care system can always adjust the cut-off threshold based on the system’s preferences.
Comparison With Prior Work
Previously, researchers constructed several models to predict hospital admission in ED patients with bronchiolitis [7-9,27-29]. Table 7 compared these previous models with our model. Compared to our model, which predicts the appropriate ED disposition decision, the previous models are less accurate and incorrectly assume that actual ED disposition decisions are always appropriate. Our model uses data from more patients, more predictive features, and a more sophisticated classification algorithm than the previous models. As is the case with predictive modeling, in general, all of these features help improve our model’s accuracy.
Table 7.
A comparison of our model and several previous models for predicting emergency department disposition decisions for bronchiolitis.
| Model | EDa visits (n) | Method for building the model | Features included in the final model | Accuracy (%) | Sensitivity (%) | Specificity (%) | AUCb | PPVc (%) | NPVd (%) |
| Our model | 7599 | Random forest | As listed in the Results section | 90.66 | 92.09 | 89.96 | 0.960 | 81.80 | 95.87 |
| Walsh et al [27] | 119 | Neural network ensemble | Age, respiratory rate after initial treatment, heart rate before initial treatment, oxygen saturation before and after initial treatment, dehydration, maternal smoking, increased work of breathing, poor feeding, wheezes only without associated crackles, entry temperature, and presence of both crackles and wheezes | 81 | 78 | 82 | —e | 68 | 89 |
| Marlais et al [7] | 449 | Scoring system | Age, respiratory rate, heart rate, oxygen saturation, and duration of symptoms | — | 74 | 77 | 0.81 | 67 | 83 |
| Destino et al [28] | 195 | Single variable | The Children’s Hospital of Wisconsin respiratory score | — | 65 | 65 | 0.68 | — | — |
| Laham et al [8] | 101 | Logistic regression | Age, need for intravenous fluids, hypoxia, and nasal wash lactate dehydrogenase concentration |
80 | 81 | 77 | 0.87 | 88 | 66 |
| Corneli et al [9] | 598 | Decision tree | Oxygen saturation, the Respiratory Distress Assessment Instrument score computed from wheezing and retractions, and respiratory rate | — | 56 | 74 | — | — | — |
| Walsh et al [29] | 300 | Logistic regression | Age, dehydration, increased work of breathing, and heart rate | — | 91 | 83 | — | 62 | — |
aED: emergency department
bAUC: area under the receiver operating characteristic curve
cPPV: positive predictive value
dNPV: negative predictive value
eThe performance metric is unreported in the original paper describing the model.
Some aspects of our findings are similar to those of previous studies. In our data set, 39.59% (3008/7598) of ED visits for bronchiolitis ended in hospitalization. This percentage is within the 32%-40% range of hospital admission rates on ED visits for bronchiolitis reported in the literature [7-9].
Limitations
This study has several limitations. First, it used data from a single health care system, Intermountain Healthcare, and did not test the generalizability of the results. In the future, studies should validate our predictive models using data from other healthcare systems. We are reasonably confident in our results, as our study was conducted in a realistic setting for finding factors generalizable to other US healthcare systems. “Intermountain Healthcare is a large healthcare system with EDs at 22 heterogeneous hospitals spread over a large geographic area, ranging from community metropolitan and rural hospitals attended by general practitioners and family doctors with constrained pediatric resources to tertiary care children’s and general hospitals in urban areas attended by sub-specialists. Each hospital has a different patient population, geographic location, staff composition, scope of services, and cultural background” [26].
Second, despite being an integrated healthcare system, Intermountain Healthcare does not have complete clinical and administrative data on all of its patients. Our data set missed information on patients’ health care use that occurred at non-Intermountain Healthcare facilities. Inclusion of data from those facilities may lead to different results, but we do not expect this inclusion to significantly change our results. Intermountain Healthcare delivers ~85% of pediatric care in Utah [32]. Hence, our data set is reasonably complete with regard to capturing health care use among bronchiolitis patients in Utah.
Third, our operational definition of appropriate hospital admission is imperfect and excludes factors such as availability of patient transportation, preference of the patient’s parents, and hour of ED disposition [26]. Many of these factors are often undocumented in patient records. For some hospital admissions from the ED that were regarded as unnecessary based on our operational definition, the original admission decisions could be made because of these factors.
Finally, besides the features used in the study, other features could help improve the model’s accuracy. Finding new predictive features is an interesting area for future work.
Conclusions
Our model can predict appropriate hospital admission for ED patients with bronchiolitis with good accuracy. In particular, our model achieved an AUC of 0.960. An AUC≥0.9 is considered outstanding discrimination [46]. With further improvement, our model could be integrated into an electronic health record system to provide personalized real-time decision support for making ED disposition decisions for bronchiolitis, which could help standardize care and improve outcomes for bronchiolitis.
Acknowledgments
We thank Farrant Sakaguchi, Michael Mundorff, Karen Valentine, Chris Benitez, JoAnn Banks, Bart Dodds, Xiaoming Sheng, and Jim Bradshaw for their helpful discussions and help in retrieving the Intermountain Healthcare data set. GL, BLS, MDJ, FLN, and SH were partially supported by the National Heart, Lung, and Blood Institute of the National Institutes of Health under Award Number R21HL128875. The funders had no role in study design, data collection and analysis, decision to publish, or preparation of the manuscript.
Abbreviations
- AUC
area under the receiver operating characteristic curve
- ED
emergency department
- FN
false negative
- FP
false positive
- ICD-9-CM
International Classification of Diseases, Ninth Revision, Clinical Modification
- NPV
negative predictive value
- PPV
positive predictive value
- SpO2
peripheral capillary oxygen saturation
- TN
true negative
- TP
true positive
Footnotes
Authors' Contributions: GL was mainly responsible for the paper. He conceptualized and designed the study, performed the literature review and data analysis, and wrote the paper. BLS, MDJ, and FLN provided feedback on various medical issues, contributed to conceptualizing the presentation, and revised the paper. SH took part in retrieving the Intermountain Healthcare data set and interpreting its detected peculiarities.
Conflicts of Interest: None declared.
References
- 1.Zorc JJ, Hall CB. Bronchiolitis: recent evidence on diagnosis and management. Pediatrics. 2010 Feb;125(2):342–9. doi: 10.1542/peds.2009-2092.peds.2009-2092 [DOI] [PubMed] [Google Scholar]
- 2.Hasegawa K, Tsugawa Y, Brown DFM, Mansbach JM, Camargo CA. Trends in bronchiolitis hospitalizations in the United States, 2000-2009. Pediatrics. 2013 Jul;132(1):28–36. doi: 10.1542/peds.2012-3877. http://pediatrics.aappublications.org/cgi/pmidlookup?view=long&pmid=23733801 .peds.2012-3877 [DOI] [PMC free article] [PubMed] [Google Scholar]
- 3.Mansbach JM, Emond JA, Camargo CA. Bronchiolitis in US emergency departments 1992 to 2000: epidemiology and practice variation. Pediatr Emerg Care. 2005 Apr;21(4):242–7. doi: 10.1097/01.pec.0000161469.19841.86.00006565-200504000-00004 [DOI] [PubMed] [Google Scholar]
- 4.Parker MJ, Allen U, Stephens D, Lalani A, Schuh S. Predictors of major intervention in infants with bronchiolitis. Pediatr Pulmonol. 2009 Apr;44(4):358–63. doi: 10.1002/ppul.21010. [DOI] [PubMed] [Google Scholar]
- 5.Shay DK, Holman RC, Newman RD, Liu LL, Stout JW, Anderson LJ. Bronchiolitis-associated hospitalizations among US children, 1980-1996. JAMA. 1999 Oct 20;282(15):1440–6. doi: 10.1001/jama.282.15.1440.joc81106 [DOI] [PubMed] [Google Scholar]
- 6.Hasegawa K, Tsugawa Y, Brown DFM, Mansbach JM, Camargo CA. Temporal trends in emergency department visits for bronchiolitis in the United States, 2006 to 2010. Pediatr Infect Dis J. 2014 Jan;33(1):11–8. doi: 10.1097/INF.0b013e3182a5f324. http://europepmc.org/abstract/MED/23934206 . [DOI] [PMC free article] [PubMed] [Google Scholar]
- 7.Marlais M, Evans J, Abrahamson E. Clinical predictors of admission in infants with acute bronchiolitis. Arch Dis Child. 2011 Jul;96(7):648–52. doi: 10.1136/adc.2010.201079.adc.2010.201079 [DOI] [PubMed] [Google Scholar]
- 8.Laham FR, Trott AA, Bennett BL, Kozinetz CA, Jewell AM, Garofalo RP, Piedra PA. LDH concentration in nasal-wash fluid as a biochemical predictor of bronchiolitis severity. Pediatrics. 2010 Feb;125(2):e225–33. doi: 10.1542/peds.2009-0411. http://europepmc.org/abstract/MED/20100751 .peds.2009-0411 [DOI] [PMC free article] [PubMed] [Google Scholar]
- 9.Corneli HM, Zorc JJ, Holubkov R, Bregstein JS, Brown KM, Mahajan P, Kuppermann N, Bronchiolitis Study Group for the Pediatric Emergency Care Applied Research Network Bronchiolitis: clinical characteristics associated with hospitalization and length of stay. Pediatr Emerg Care. 2012 Feb;28(2):99–103. doi: 10.1097/PEC.0b013e3182440b9b. [DOI] [PubMed] [Google Scholar]
- 10.Scottish Intercollegiate Guidelines Network. Guideline Central. [2019-01-17]. Bronchiolitis in children. A national clinical guideline https://www.guidelinecentral.com/summaries/bronchiolitis-in-children-a-national-clinical-guideline/
- 11.AHRQ - Agency for Healthcare Research and Quality: Advancing Excellence in Health Care. [2019-01-17]. Cincinnati Children's Hospital Medical Center: Evidence-based care guideline for management of first time episode bronchiolitis in infants less than 1 year of age http://www.guideline.gov/content.aspx?id=34411 .
- 12.Brand PL, Vaessen-Verberne AA. Differences in management of bronchiolitis between hospitals in The Netherlands. Dutch Paediatric Respiratory Society. Eur J Pediatr. 2000 May;159(5):343–7. doi: 10.1007/s004310051284. [DOI] [PubMed] [Google Scholar]
- 13.Ducharme FM. Management of acute bronchiolitis. BMJ. 2011 Apr 06;342:d1658. doi: 10.1136/bmj.d1658. [DOI] [PubMed] [Google Scholar]
- 14.Behrendt CE, Decker MD, Burch DJ, Watson PH. International variation in the management of infants hospitalized with respiratory syncytial virus. International RSV Study Group. Eur J Pediatr. 1998 Mar;157(3):215–20. doi: 10.1007/s004310050798. [DOI] [PubMed] [Google Scholar]
- 15.Chamberlain JM, Patel KM, Pollack MM. Association of emergency department care factors with admission and discharge decisions for pediatric patients. J Pediatr. 2006 Nov;149(5):644–649. doi: 10.1016/j.jpeds.2006.05.047.S0022-3476(06)00493-8 [DOI] [PubMed] [Google Scholar]
- 16.Johnson DW, Adair C, Brant R, Holmwood J, Mitchell I. Differences in admission rates of children with bronchiolitis by pediatric and general emergency departments. Pediatrics. 2002 Oct;110(4):e49. doi: 10.1542/peds.110.4.e49. [DOI] [PubMed] [Google Scholar]
- 17.Mallory MD, Shay DK, Garrett J, Bordley WC. Bronchiolitis management preferences and the influence of pulse oximetry and respiratory rate on the decision to admit. Pediatrics. 2003 Jan;111(1):e45–51. doi: 10.1542/peds.111.1.e45. [DOI] [PubMed] [Google Scholar]
- 18.Plint AC, Johnson DW, Wiebe N, Bulloch B, Pusic M, Joubert G, Pianosi P, Turner T, Thompson G, Klassen TP. Practice variation among pediatric emergency departments in the treatment of bronchiolitis. Acad Emerg Med. 2004 Apr;11(4):353–60. doi: 10.1197/j.aem.2003.12.003. http://onlinelibrary.wiley.com/resolve/openurl?genre=article&sid=nlm:pubmed&issn=1069-6563&date=2004&volume=11&issue=4&spage=353 . [DOI] [PubMed] [Google Scholar]
- 19.Vogel AM, Lennon DR, Harding JE, Pinnock RE, Graham DA, Grimwood K, Pattemore PK. Variations in bronchiolitis management between five New Zealand hospitals: can we do better? J Paediatr Child Health. 2003;39(1):40–5. doi: 10.1046/j.1440-1754.2003.00069.x.069 [DOI] [PubMed] [Google Scholar]
- 20.Willson DF, Horn SD, Hendley JO, Smout R, Gassaway J. Effect of practice variation on resource utilization in infants hospitalized for viral lower respiratory illness. Pediatrics. 2001 Oct;108(4):851–5. doi: 10.1542/peds.108.4.851. [DOI] [PubMed] [Google Scholar]
- 21.Willson DF, Jiao JH, Hendley JO, Donowitz L. Invasive monitoring in infants with respiratory syncytial virus infection. J Pediatr. 1996 Mar;128(3):357–62. doi: 10.1016/s0022-3476(96)70281-0.S0022-3476(96)70281-0 [DOI] [PubMed] [Google Scholar]
- 22.Wang EE, Law BJ, Boucher FD, Stephens D, Robinson JL, Dobson S, Langley JM, McDonald J, MacDonald NE, Mitchell I. Pediatric Investigators Collaborative Network on Infections in Canada (PICNIC) study of admission and management variation in patients hospitalized with respiratory syncytial viral lower respiratory tract infection. J Pediatr. 1996 Sep;129(3):390–5. doi: 10.1016/s0022-3476(96)70071-9.S0022-3476(96)70071-9 [DOI] [PubMed] [Google Scholar]
- 23.Christakis DA, Cowan CA, Garrison MM, Molteni R, Marcuse E, Zerr DM. Variation in inpatient diagnostic testing and management of bronchiolitis. Pediatrics. 2005 Apr;115(4):878–84. doi: 10.1542/peds.2004-1299.115/4/878 [DOI] [PubMed] [Google Scholar]
- 24.Mansbach JM, Clark S, Christopher NC, LoVecchio F, Kunz S, Acholonu U, Camargo CA. Prospective multicenter study of bronchiolitis: predicting safe discharges from the emergency department. Pediatrics. 2008 Apr;121(4):680–8. doi: 10.1542/peds.2007-1418.121/4/680 [DOI] [PubMed] [Google Scholar]
- 25.McBride SC, Chiang VW, Goldmann DA, Landrigan CP. Preventable adverse events in infants hospitalized with bronchiolitis. Pediatrics. 2005 Sep;116(3):603–8. doi: 10.1542/peds.2004-2387.116/3/603 [DOI] [PubMed] [Google Scholar]
- 26.Luo G, Johnson MD, Nkoy FL, He S, Stone BL. Appropriateness of Hospital Admission for Emergency Department Patients with Bronchiolitis: Secondary Analysis. JMIR Med Inform. 2018 Nov 05;6(4):e10498. doi: 10.2196/10498. http://medinform.jmir.org/2018/4/e10498/ v6i4e10498 [DOI] [PMC free article] [PubMed] [Google Scholar]
- 27.Walsh P, Cunningham P, Rothenberg SJ, O'Doherty S, Hoey H, Healy R. An artificial neural network ensemble to predict disposition and length of stay in children presenting with bronchiolitis. Eur J Emerg Med. 2004 Oct;11(5):259–64. doi: 10.1097/00063110-200410000-00004.00063110-200410000-00004 [DOI] [PubMed] [Google Scholar]
- 28.Destino L, Weisgerber MC, Soung P, Bakalarski D, Yan K, Rehborg R, Wagner DR, Gorelick MH, Simpson P. Validity of respiratory scores in bronchiolitis. Hosp Pediatr. 2012 Oct;2(4):202–9. doi: 10.1542/hpeds.2012-0013. http://www.hospitalpediatrics.org/cgi/pmidlookup?view=long&pmid=24313026 . [DOI] [PubMed] [Google Scholar]
- 29.Walsh P, Rothenberg SJ, O'Doherty S, Hoey H, Healy R. A validated clinical model to predict the need for admission and length of stay in children with acute bronchiolitis. Eur J Emerg Med. 2004 Oct;11(5):265–72. doi: 10.1097/00063110-200410000-00005.00063110-200410000-00005 [DOI] [PubMed] [Google Scholar]
- 30.Luo G, Nkoy FL, Gesteland PH, Glasgow TS, Stone BL. A systematic review of predictive modeling for bronchiolitis. Int J Med Inform. 2014 Oct;83(10):691–714. doi: 10.1016/j.ijmedinf.2014.07.005.S1386-5056(14)00140-3 [DOI] [PubMed] [Google Scholar]
- 31.Luo G, Stone BL, Johnson MD, Nkoy FL. Predicting Appropriate Admission of Bronchiolitis Patients in the Emergency Department: Rationale and Methods. JMIR Res Protoc. 2016 Mar 07;5(1):e41. doi: 10.2196/resprot.5155. http://www.researchprotocols.org/2016/1/e41/ v5i1e41 [DOI] [PMC free article] [PubMed] [Google Scholar]
- 32.Byington CL, Reynolds CC, Korgenski K, Sheng X, Valentine KJ, Nelson RE, Daly JA, Osguthorpe RJ, James B, Savitz L, Pavia AT, Clark EB. Costs and infant outcomes after implementation of a care process model for febrile infants. Pediatrics. 2012 Jul;130(1):e16–24. doi: 10.1542/peds.2012-0127. http://pediatrics.aappublications.org/cgi/pmidlookup?view=long&pmid=22732178 .peds.2012-0127 [DOI] [PMC free article] [PubMed] [Google Scholar]
- 33.Flaherman VJ, Ragins AI, Li SX, Kipnis P, Masaquel A, Escobar GJ. Frequency, duration and predictors of bronchiolitis episodes of care among infants ≥32 weeks gestation in a large integrated healthcare system: a retrospective cohort study. BMC Health Serv Res. 2012 Jun 08;12:144. doi: 10.1186/1472-6963-12-144. https://bmchealthservres.biomedcentral.com/articles/10.1186/1472-6963-12-144 .1472-6963-12-144 [DOI] [PMC free article] [PubMed] [Google Scholar]
- 34.Mittal V, Darnell C, Walsh B, Mehta A, Badawy M, Morse R, Pop R, Tidwell J, Sheehan M, McDermott S, Cannon C, Kahn J. Inpatient bronchiolitis guideline implementation and resource utilization. Pediatrics. 2014 Mar;133(3):e730–7. doi: 10.1542/peds.2013-2881. http://pediatrics.aappublications.org/cgi/pmidlookup?view=long&pmid=24534398 .peds.2013-2881 [DOI] [PubMed] [Google Scholar]
- 35.Sandweiss DR, Mundorff MB, Hill T, Wolfe D, Greene T, Andrews S, Glasgow TS. Decreasing hospital length of stay for bronchiolitis by using an observation unit and home oxygen therapy. JAMA Pediatr. 2013 May;167(5):422–8. doi: 10.1001/jamapediatrics.2013.1435.1663078 [DOI] [PubMed] [Google Scholar]
- 36.Steyerberg EW. Clinical Prediction Models: A Practical Approach To Development, Validation, And Updating (statistics For Biology And Health) New York, NY: Springer-Verlag; 2009. [Google Scholar]
- 37.Witten IH, Frank E, Hall MA, Pal CJ. Data Mining: Practical Machine Learning Tools and Techniques. Burlington, MA: Morgan Kaufmann; 2016. [Google Scholar]
- 38.Kaggle. [2019-01-17]. https://www.kaggle.com/
- 39.Zeng X, Luo G. Progressive sampling-based Bayesian optimization for efficient and automatic machine learning model selection. Health Inf Sci Syst. 2017 Dec;5(1):2. doi: 10.1007/s13755-017-0023-z. http://europepmc.org/abstract/MED/29038732 .23 [DOI] [PMC free article] [PubMed] [Google Scholar]
- 40.Feudtner C, Feinstein JA, Zhong W, Hall M, Dai D. Pediatric complex chronic conditions classification system version 2: updated for ICD-10 and complex medical technology dependence and transplantation. BMC Pediatr. 2014 Aug 08;14:199. doi: 10.1186/1471-2431-14-199. https://bmcpediatr.biomedcentral.com/articles/10.1186/1471-2431-14-199 .1471-2431-14-199 [DOI] [PMC free article] [PubMed] [Google Scholar]
- 41.Agresti A. Categorical Data Analysis. Hoboken, NJ: Wiley; 2012. [Google Scholar]
- 42.Luo G. Automatically explaining machine learning prediction results: a demonstration on type 2 diabetes risk prediction. Health Inf Sci Syst. 2016;4:2. doi: 10.1186/s13755-016-0015-4. https://hissjournal.biomedcentral.com/articles/10.1186/s13755-016-0015-4 .15 [DOI] [PMC free article] [PubMed] [Google Scholar]
- 43.Luo G. A roadmap for semi-automatically extracting predictive and clinically meaningful temporal features from medical data for predictive modeling. Global Transitions. 2019;1(1) doi: 10.1016/j.glt.2018.11.001. (forthcoming) [DOI] [PMC free article] [PubMed] [Google Scholar]
- 44.Shaw KN, Bell LM, Sherman NH. Outpatient assessment of infants with bronchiolitis. Am J Dis Child. 1991 Feb;145(2):151–5. doi: 10.1001/archpedi.1991.02160020041012. [DOI] [PubMed] [Google Scholar]
- 45.Shafik MH, Seoudi TMM, Raway TS, Al Harbash NZ, Ahmad MMA, Al Mutairi HF. Appropriateness of pediatric hospitalization in a general hospital in Kuwait. Med Princ Pract. 2012;21(6):516–21. doi: 10.1159/000339084. https://www.karger.com?DOI=10.1159/000339084 .000339084 [DOI] [PubMed] [Google Scholar]
- 46.Hosmer Jr DW, Lemeshow S, Sturdivant RX. Applied Logistic Regression. Hoboken, NJ: Wiley; 2013. [Google Scholar]