Abstract
We previously have described the photoactivated depot or PAD approach that allows for the light control of therapeutic protein release. This approach relies on the ability to use light to change a protein’s solubility. Traditionally this was accomplished by linking the protein to an insoluble but injectable polymer via a light cleaved linker. This allows the injected material to remain at the site of injection, until transcutaneous irradiation breaks the link between polymer and protein, permitting the protein to be absorbed. However, there are multiple problems associated with polymer based approaches: The polymer makes up a majority of the material, making it inefficient. In addition, after protein release, the polymer has to be cleared from the body, a significant design challenge. In this work, we create materials that form photoactivated depots of insulin without the need for polymers, by linking photolysis to an isoelectric point shift, which itself is linked to a solubility shift. Specifically, we linked basic groups to insulin via a light cleaved linker. These shift the normal pI of insulin from 5.4 to approximately 7. The result of this incorporation are materials that are completely soluble in mildly acidic solutions but precipitate upon injection into a pH 7 environment, ie the skin. We successfully synthesized four such modified insulins, demonstrating that their pI values were shifted in the expected manner. We then analyzed one of them, P2-Insulin, in detail, demonstrating that it behaves as designed: It is soluble in a formulation pH of 4, but precipitates at pH 7.2, its approximate pI value. Upon irradiation, the photocleavable link to insulin is broken, and completely native and soluble insulin is released from the depot in a well behaved, first order fashion. These materials are 90% therapeutic, form completely soluble and injectable formulations in mildly acidic conditions, form insoluble depots at neutral pH, efficiently release soluble protein from these depots when irradiated, and leave behind only small easily absorbed molecules after irradiation. As such they approach ideality for photoactivated depot materials.
Graphical Abstract
Introduction
Light control represents a powerful method to allow the spacing, timing and degree of biological processes to be modulated.1–17 We recently described an approach for the light controlled delivery of insulin in response to blood sugar information: the insulin PhotoActivated Depot or PAD.16, 18–19 We designed these materials to be injectable, like standard insulin, but to remain at the site of injection, inert, until an external light source stimulates them to release insulin. The combination of continuously variable release of insulin from a PAD and continuous blood sugar information should enable a minimally invasive artificial pancreas, without the problems associated with pumps and cannulas.20–23
Our first generation PAD materials consist of insulin linked to an insoluble polymer via a photocleavable linker. As effective as these materials are, showing in-vitro and in-vivo control of insulin release and blood sugar reduction with light, they have three significant problems to address, all of which are related to relying on a polymer to confer insolubility prior to irradiation: 1) Low density: First generation materials are mostly polymer with ~5% insulin dry w/w. This lowers the potential duration of material use, and reduces the ease with which photolysis can take place. 2) Polymer biodegradation: After insulin is consumed we require the carrier to be biodegraded, while maintaining its stability during insulin delivery. This requirement of simultaneous polymer stability and degradability is a challenging design issue. 3) Injectability: Insoluble polymeric materials have to be formulated into small particles that are large enough to remain insoluble depots at the site of injection (and not be absorbed directly), but are small enough to fit through the narrow lumen of a typical insulin syringe. Because of these significant issues, we have sought ways in which to completely eliminate polymers as the source of insolubility prior to irradiation in PAD materials. 18
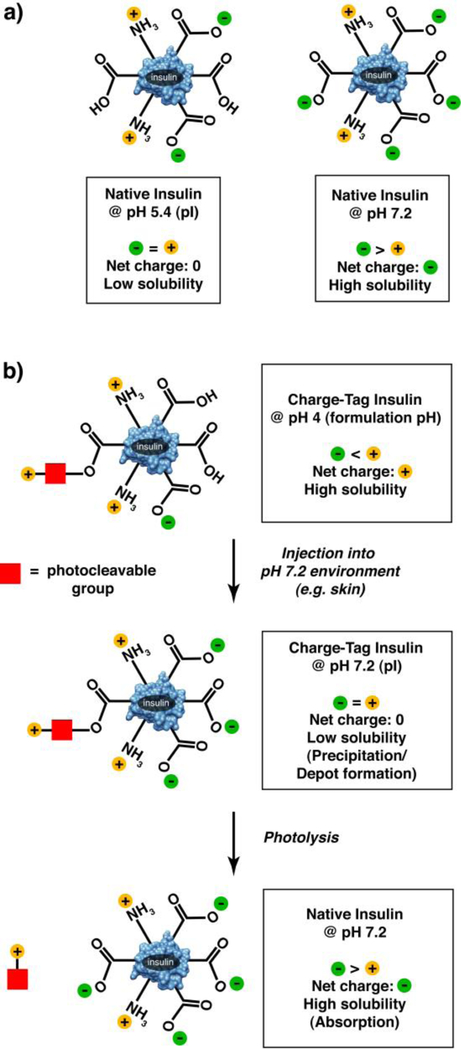
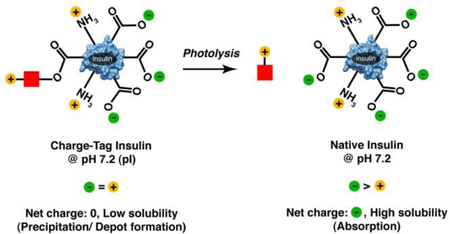
In this work we have eliminated these three problems by directly linking inherent protein solubility to a photolysis event. We accomplish this by taking advantage of the relationship between protein isoelectric point and protein solubility. Proteins have their lowest solubility at their isoelectric point, the pH at which the net protein charge is 0. Insulin has an isoelectric point of 5.4, and so has minimal solubility at this pH. We have made multiple versions of insulin in which natural and unnatural positively charged groups are linked to insulin by a photocleavable link. These groups are designed to shift the pI of the resultant species to be near the pH of the skin (~7), a pH at which the species should have limited solubility and therefore precipitate. The materials can be formulated at an acidic pH at which the material is positively charged and completely soluble. Upon injection into a pH 7 environment (i.e. the skin), precipitation can occur, creating a depot without the need for an insoluble polymer. Upon photolysis, the positive groups are removed, the protein’s pI shifts back to the native 5.4 and the species’ resultant solubility markedly increases. (Figure 1)
Figure 1. Schematic representation of overall approach.
In native insulin (a), acidic groups are in excess of basic groups. This leads to low solubility at low pH where basic and acidic groups are in equal number, and high solubility at higher pH where acidic groups are in excess. In charged-tagged insulin (b), one acidic group is blocked via an ester linkage, and one or two additional basic groups are added through a light cleavable linker (red square). This shifts the pI of the material to a near neutral pH, the result of which is high solubility at low pH. Upon introduction to a neutral pH environment, protonated acidic groups are deprotonated, resulting in a net charge near 0, and markedly reduced solubility. After photolysis, native, soluble insulin is released.
We have successfully made four versions of insulin that increase the pI from the native insulin pI of 5.4 to just below and just above neutral pH, by incorporating additional positive charges, linked by a photocleavable linker. We demonstrate that these materials have high solubility when formulated in mildly acidic solutions but precipitate at pH values near neutral. Furthermore, we show that upon photolysis, the unnatural positively charged groups are removed, and the remaining native insulin solubilizes rapidly. The results of this approach are materials that are 91% insulin (dry w/w), are soluble in acidic formulations, have markedly reduced solubility at the neutral pH of skin, and release native, soluble unmodified insulin in response to light stimulation. As such, they approach ideality in the design of photoactivated protein depot materials.
Results and Discussion
We began by analyzing the ionizable groups on insulin. There are six potentially negatively charged carboxyl groups (four glutamates, and two terminal carboxyls). There are four potentially positively charged strongly basic groups (one lysine, one arginine and two terminal amines). Finally there are two weakly basic histidines that are nominally charged only under acidic conditions and are otherwise predominantly neutral. Thus it makes sense that insulin has an acidic pI (5.4), having a majority acidic functional groups. Our aim in this work was to shift this pI to be approximately 7, so that upon injection into neutral tissue, the acid-soluble material would precipitate, forming a depot. There are two tactics we used in our approach. The first was to block one of the negatively charged carboxyl groups via alkylation using a photocleavable diazo-dinitro phenyl ethyl group (DMNPE). This converts an ionizable carboxyl into a neutral ester, removing one negative charge, which is the equivalent of adding one net positive charge. The second tactic we used was to modify the DMNPE group itself to incorporate strongly basic groups. These are positively charged under most circumstances, adding approximately one net positive charge per basic group (we made versions that included one or two such groups).
We were guided in part from the lessons of the modified insulin glargine, in which the pI of insulin is shifted through the addition of two arginines into the sequence.24–28 With the addition of these two basic amino acids, glargine’s pI shifts to 6.7, from the 5.4 of native insulin. Crudely, this suggests that for each additional positive charge, we could increment the pI by 0.65 units. We were interested in increasing the pI even closer to neutral, i.e ~7, to increase the change in solubility that accompanies the pH shift. To this end, we made a series of modified insulins, which incorporated one or two additional positive charges, and in so doing, formally shifted the net charge by two or three (due to the quenching of one carboxyl minus charge that is inherent in the diazo modification reaction).
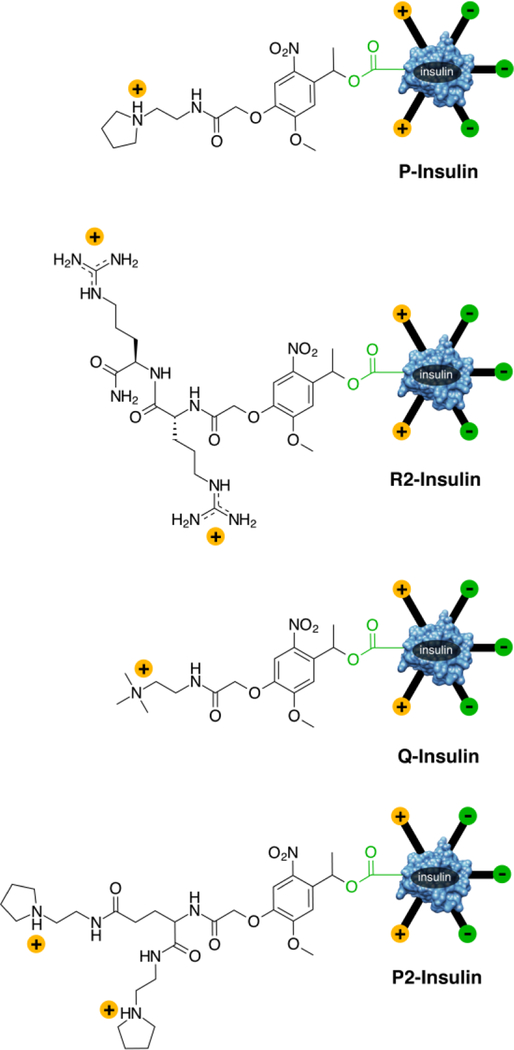
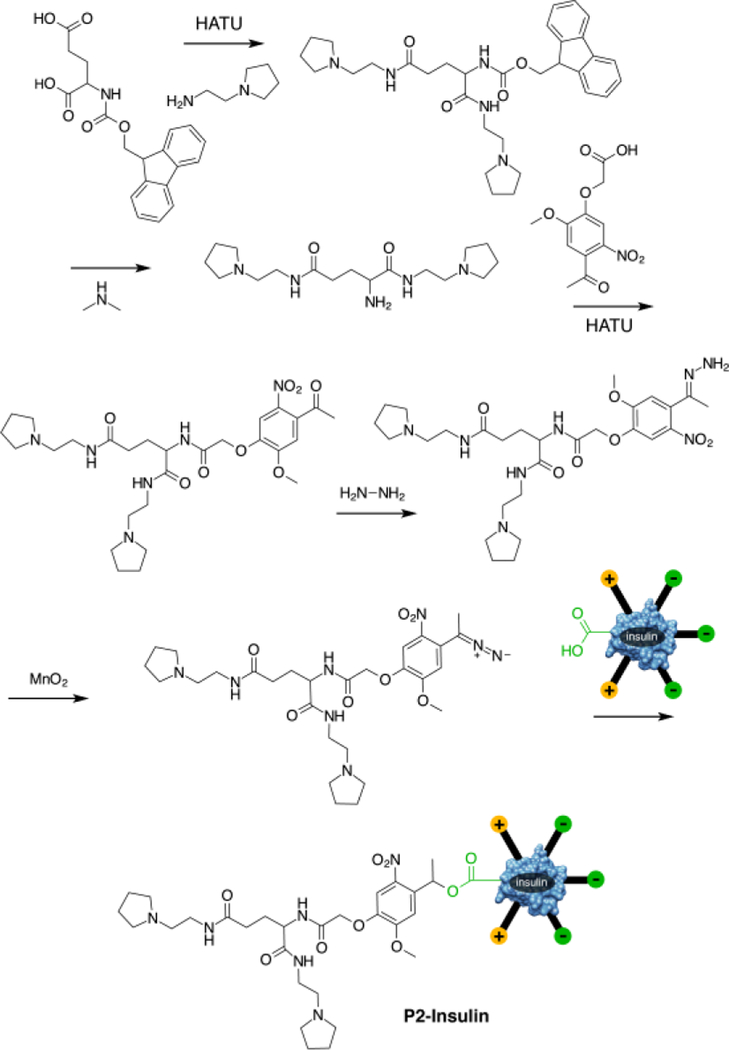
The four tested modified insulins all share the photocleavable DMNPE group and are depicted in Figure 2. They are Q-insulin which incorporates a quaternary ammonium group, P-insulin which incorporates a pyrrolidine, R2-insulin, which incorporates two arginines and P2-insulin, which incorporates two pyrrolidines. In the case of P, Q and R2-insulins, the keto-acid derivative of DMNPE was incorporated through condensation on the solid phase, whereas with P2-insulin this incorporation took place in solution. For all species this was followed by conversion of the ketone to the hydrazone, and ultimately to the diazo. We have previously used related diazo DMNPE derivatives to modify insulin.16 Typically, we combine insulin and the diazo-DMNPE derivative in a 1:1 mixture and allow it to react overnight. The synthesis of P2-insulin is shown in Scheme 1 and it parallels the synthesis of all the described species. The final mono-modified insulins were purified from unreacted and di-reacted insulin using HPLC. The typical yield of pure, mono-modified P2-insulin is 10–15% of the starting insulin. This reaction can likely be further optimized to improve yield.
Figure 2. Modified Insulin Species Tested.
Cationic groups linked to insulin via an ortho nitro photocleavable group. Linkage takes place through diazo modification of an insulin carboxyl group.
Scheme 1. Synthetic Scheme of P2-Insulin.
We infer that diazo DMNPE modified insulin is modified exclusively on its carboxyl groups. This is based on the observation that when insulin is reacted with an uncharged DMNPE derivative, the resultant species has a significantly higher pI (6.3 vs 5.4 for native insulin, data not shown). The fact that the pI of the diazo-reacted insulins is shifted significantly higher even when the DMNPE moiety has no positive charged groups is consistent with acidic insulin side-chains being modified. This strongly supports the carboxyl groups in insulin (terminal and glutamic acid) as the site of reaction, as they are the only acidic sites in insulin. The actual reaction product likely contains a mixture of different modified carboxyl groups. Given this, we have previously shown that similar diazo-reacted insulins have photolysis kinetics that are well fitted by a single first order rate constant. Thus their critical photolysis behavior can be modeled as a single species.16
The purified modified insulins were analyzed by HPLC and ESI-MS. A representative HPLC and MS are shown for P2-insulin in Figure 3 (Full characterization for each insulin, including HPLC, MS and IEF gel analysis can be found in Supporting Information). The modified insulins all showed the expected mass, and good purity except for R2-insulin which showed contamination with a mass consistent with a single R deletion from the photolabile group. This deletion is not found in the hydrazone reagent, leading us to believe that an unexpected hydrolysis event takes place during or after the diazo formation.
Figure 3. Characterization of P2-Insulin.
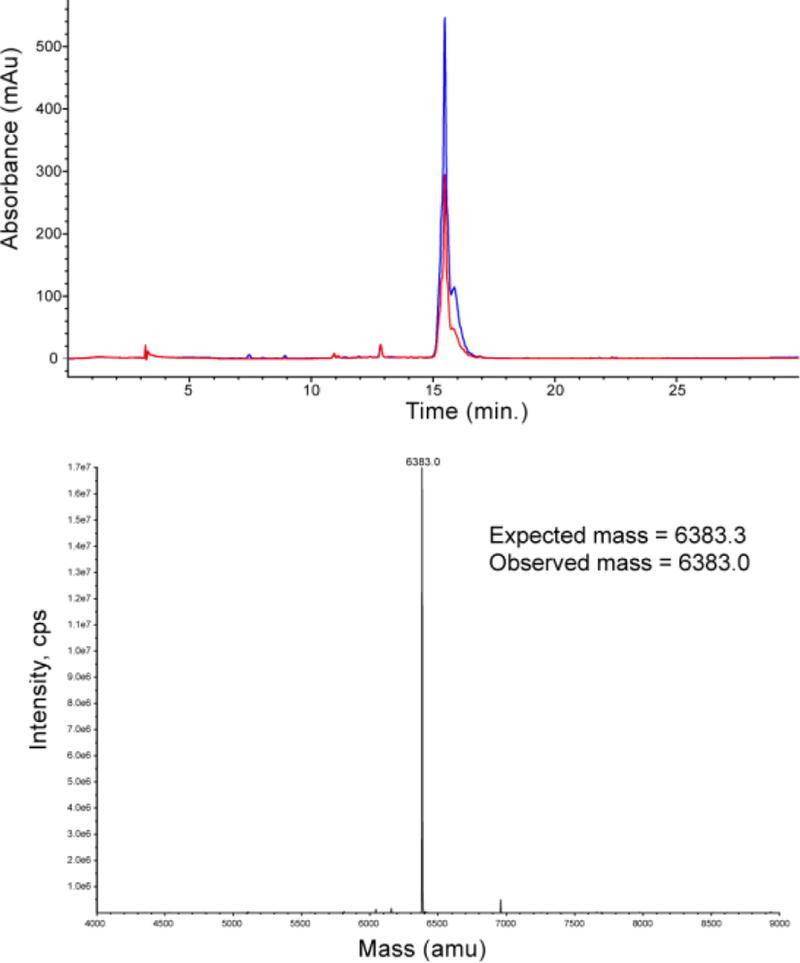
HPLC of purified P2-insulin, with chromatograms at 345nm and 280nm. Multiple peaks have similar ratios of 345 to 280, and are likely due to attachment at different insulin carboxyl groups. The deconvoluted mass reconstruction of the directly infused sample is shown below.
In addition, all modified insulins were analyzed using IEF gel electrophoresis to determine their isoelectric points. A representative IEF gel featuring P2-insulin is shown in Figure 4 (IEF analysis of the three other insulins are in Supporting Information). pI values were determined using the protein’s gel mobility and the known pI values of the IEF standards on the gel. The determined pI values fit the expectations. Specifically, the pI of species in which the net charge (at neutral pH) is expected to increase by +2 (namely Q-insulin and P-insulin) rose to 6.65 and 6.62 respectively, very close to that of glargine (~6.7). The pI of species in which net charge is expected to increase by +3 (namely R2-insulin and P2-insulin) rose to 7.15 and 7.17 respectively. The determined pI values and ESI determined mass for all species are collected in Table 1.
Figure 4. IEF Gel Analysis of P2-Insulin.
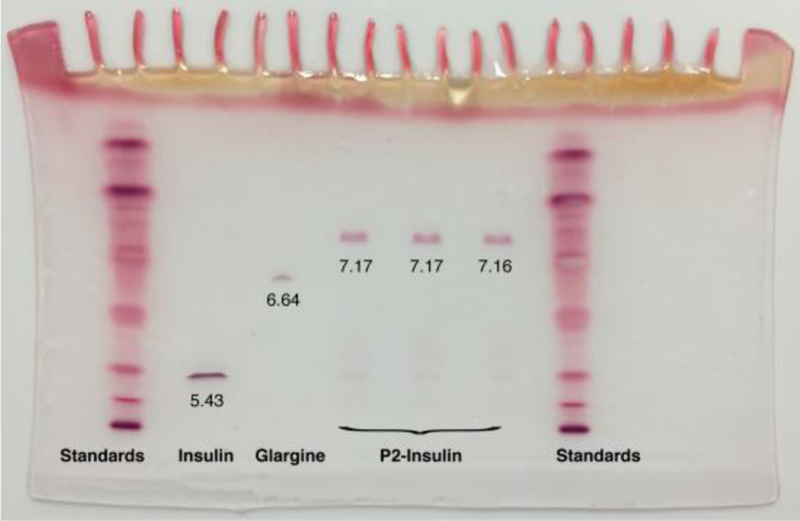
Lanes 1 and 7, pI standards. Lane 2, native insulin. Lane 3, insulin glargine. Lanes 4–6, triplicate samples of pure P2-insulin. Inset numbers indicate values of pI as determined from mobility of bands and standard curve plots of pI standards.
Table 1. Physical Characterization Summary of Insulins.
pI values with standard errors were determined from IEF gels of triplicate samples. Predicted pI shifts are based on analysis of non-natural insulin as described in the text. Molecular weights are from mass reconstructed ESI-MS data and are compared with the calculated molecular weight.
| Species | Expected pI | Observed pI | Expected mass | Observed mass |
|---|---|---|---|---|
| Insulin | 5.4 | |||
| Glargine | 6.7 | |||
| P-Insulin | 6.7 | 6.62 ± 0.01 | 6157.4 | 6160.0 |
| Q-Insulin | 6.7 | 6.65 ± 0.006 | 6146.4 | 6150.0 |
| RR-Insulin | 7.35 | 7.15 ± 0.006 | 6372.6 | 6377.0 |
| P2-Insulin | 7.35 | 7.17 ± 0.006 | 6383.7 | 6383.0 |
With the pI values determined, we then focused subsequent pH dependent solubility and photolytic analysis on P2-insulin. P2-insulin has a pI closest to physiological (7.2), and hence is anticipated to have the lowest solubility in normal tissues. In addition, it was more pure than R2-insulin (which had a similar pI). R2-insulin showed signs of peptide deletions in both the IEF analysis and in MS, whereas P2-insulin showed a single band in IEF and the correct mass expected of a single modification. The first analysis we performed was pH dependent solubility, examining solubility at pH 4 (the pH that glargine is formulated at), and at pH 7.2 (physiological pH and the pI of the modified insulin). Briefly, P2-Insulin was introduced into 10mM phosphate buffered saline at either pH 4 or 7.2 (PBS: 10mM phosphate, 137mM NaCl), and allowed to reach equilibrium over a 2 hour period (40 nmol P2-insulin in 100µl buffer for pH 7 studies, and 200 nmol of P2-insulin in 100µl for pH 4 studies). Both had visible solid present at equilibrium, insuring that saturation had been achieved (The visible solid was confirmed to be P2-insulin after the study, by solubilizing it in DMSO and analyzing by HPLC.) The samples were centrifuged, and the supernatants analyzed by HPLC for modified insulin. The results are shown in Figure 5. As anticipated, P2-insulin has a significantly lower solubility at the neutral pH than at the acidic formulation pH (14µM at pH 7.2 vs 216µM at pH 4). When unmodified native insulin was analyzed in an identical manner, it had a solubility at pH 7.2 of 1053 µM and thus P2-insulin is 75× lower in solubility at this pH. This strongly lowered solubility is expected to significantly slow the release of P2-insulin from a depot site, in a manner analogous to insulin-glargine, which has similar reduced solubility. An advantage of our material is that we can couple this slow basal release with triggered large releases of insulin, as would be required of prandial administration.
Figure 5. Differential Solubility of P2-Insulin at pH 4.0 and 7.2.
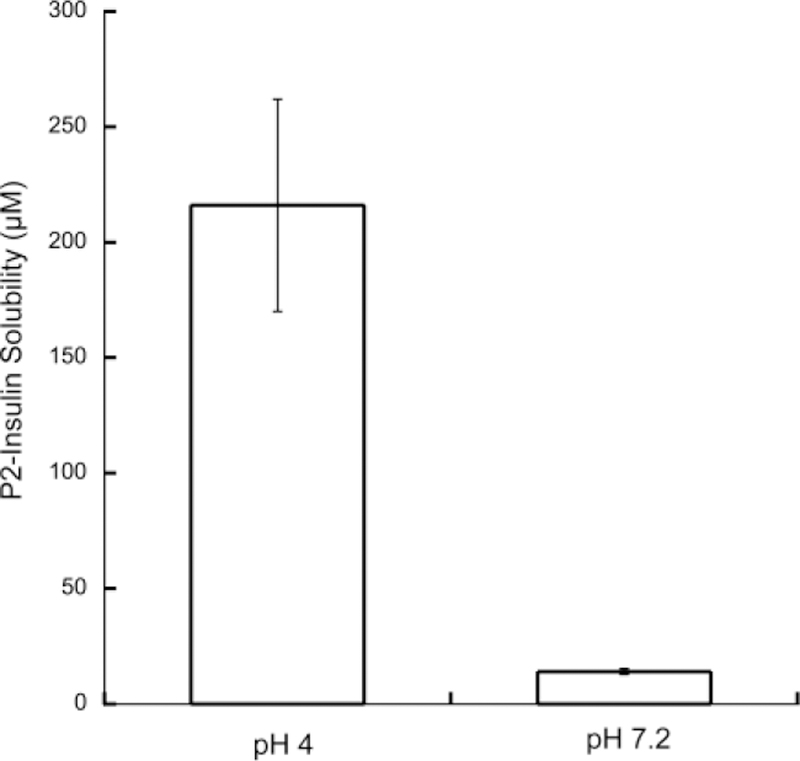
Concentrations of P2-insulin in the supernatant of saturated solutions of P2-insulin were determined using HPLC. pH was maintained in 10mM PBS. Performed in triplicate with standard errors shown.
The observed solubility trends are also depicted photographically in Figure 6. 400µl of a 75µM P2-insulin solution in 10mM pH 4 phosphate buffer was prepared (Figure 6a). To this, 38µl of a 0.1M NaOH solution was added to bring the pH to 7.2, at which point immediate precipitation was observed (Figure 6b). Upon vortexing, this precipitate distributed through the volume of buffer (Figure 6c). This tube was then irradiated for 10 minutes using a 365nm LED light source (1.84 mW/cm2) which substantially clarified the suspension (Figure 6d). To fully clarify this, we centrifuged the suspended particles, removed the clarified buffer, added 400µl of fresh buffer, and rephotolyzed the solution. The result was a clear solution of insulin (Figure 6e).
Figure 6. Solubility of P2-Insulin Affected by pH and Photolysis.

(a) A 75µM solution of P2-Insulin in 10mM pH 4 PBS. (b) Solution becomes cloudy at point of entry of NaOH that shifts pH to the neutral. (c) After vortexing, material is now at pH 7.2 and is a suspension. (d) After photolysis for 10 minutes at 365nm, the solution is partially clarified. (e) After suspension is centrifuged to clarify, clear supernatant removed, additional pH 7.2 buffer added, and further irradiation at 365nm takes place, material is completely clear.
We then more closely examined the kinetics of photolysis of P2-insulin, both in homogenous solution in DMSO, and in inhomogeneous suspension in pH 7.2 PBS. The purpose of the DMSO photolysis was to determine “clean” photokinetics, without complication from variables like changing light scattering during the photolysis. The purpose of the pH 7.2 buffer suspension photolysis was to examine photolysis under closer to “real world” circumstances, ie the actual depot found in the skin under neutral aqueous conditions.
For the homogenous DMSO photolysis, we irradiated 40µl of a 0.5 mM solution of P2-insulin in DMSO using a 365nm LED light source with an absolute irradiance of 0.95 mW/cm2. At time intervals we removed samples and analyzed them using IEF gel electrophoresis. Figure 7 (top) depicts these results and shows the higher pI P2-insulin (upper band) being converted into the lower pI native insulin (lower band). The reactant and product molarities were quantitated and the resulting insulin evolution shown in Figure 7 (bottom). The kinetics are well fit by a single first order process, yielding a first order rate constant of 0.16 min−1.
Figure 7. Photolysis Kinetics of Homogeneous P2-Insulin Solution in DMSO.
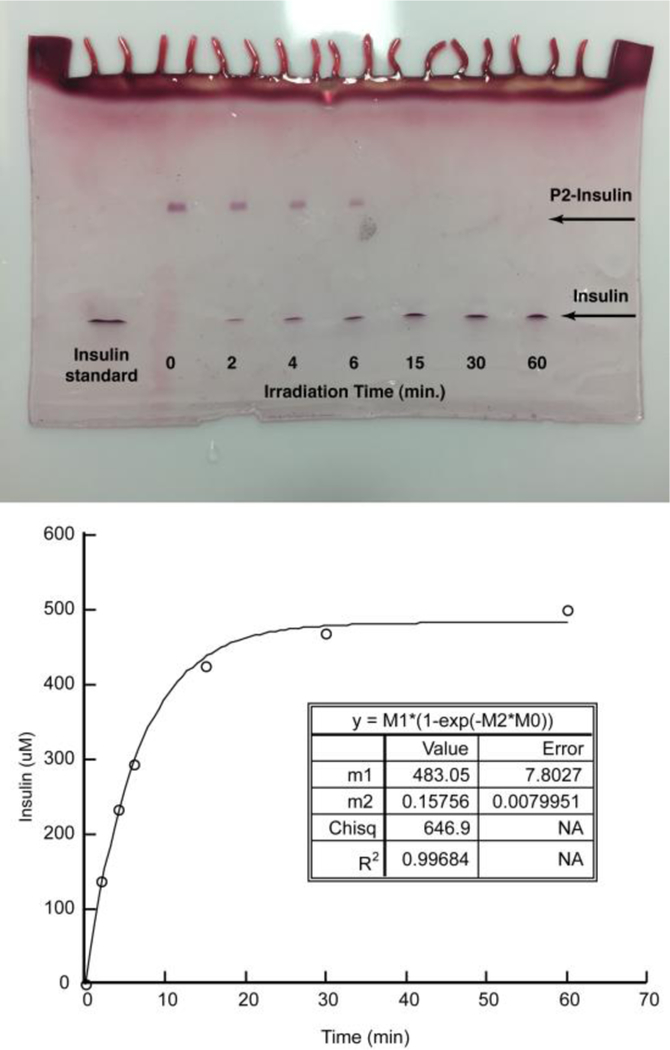
IEF gel analysis of photolysis at indicated time points (top). Quantitated insulin concentration plotted as a function of time (bottom) and fitted to a first order rate law.
For the photolysis of the P2-insulin suspension, we combined 100 nmol of P2-insulin in 100µl pH 7.2 PBS. Experimental samples were analyzed by irradiation using the 365nm LED light source (1.84 mW/cm2). Control suspension was prepared identically but was left unirradiated, to account for any non-photolytic processes that could release native insulin. Figure 8 shows a pictorial analysis of these samples, showing progressive clarification of the experimental suspension but not the control, unirradiated suspension. The amount of insulin released was determined by IEF analysis (figure 9). Specifically, the suspension was irradiated for the indicated amount of time, at which point we centrifuged the sample to clarify the suspension, and removed the entire supernatant, which was analyzed by IEF gel. A fresh 100µl of buffer was added to the centrifuged solid which was then resuspended, and irradiation continued. The resulting moles were plotted as a cumulative concentration in 100µl (figure 9 and in supporting information). The data was well fit to a first order rate law, which gave a first order kinetic constant of 0.075 min−1, and a maximum concentration of 838µM. This represents a majority of the expected 1mM released insulin. The gel also indicates no detectable P2-insulin in the supernatant. Control samples, in which P2-insulin was suspended and processed in an identical fashion, but remained unirradiated, showed no insulin released (see supporting information). This combined data show a very facile and specific release of soluble insulin in response to light.
Figure 8. Light-based Solubilization of P2-Insulin in PBS.

Paired experimental (E) and control (C) samples. Experimental samples were irradiated in 10mM pH 7.2 PBS with 365nm light for the indicated time periods.
Figure 9. Photolysis Kinetics of P2-Insulin Suspension in PBS at pH 7.2.
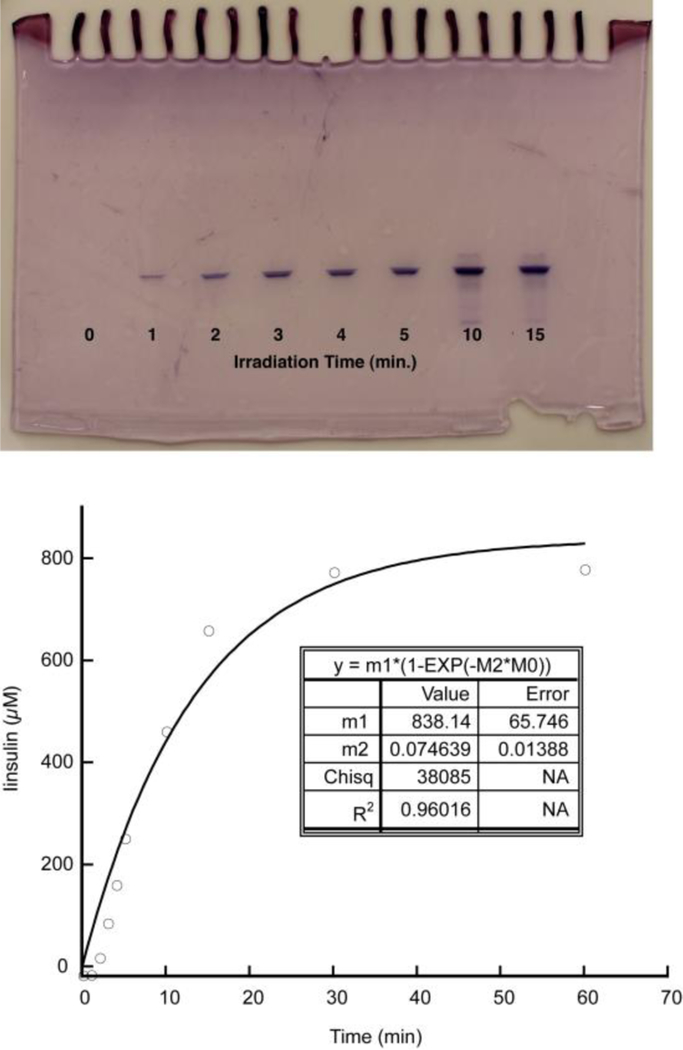
Insulin released into buffer was quantitated using IEF gel analysis (left), plotted as a function of time and fitted to a first order rate law (right). An additional gel with 30 and 60 minute time points and the entire insulin standard curve may be found in supporting information.
Discussion and Conclusions
In this work we demonstrate for the first time the ability to shift a protein’s isoelectric point using light. By doing this, we are able to radically alter the pH dependence of the protein’s solubility. While we have applied this method to an acidic protein, it should work on nearly any protein, because of the wide flexibility available to the sequence of the peptide attached to the DMNPE group. This approach has the potential to address fundamental biological questions, for example the role of protein iso-electric points on cellular localization and other phenomena.29–35 In addition, this method is particularly useful for the design of injectable, light-activated depots of therapeutic proteins, such as insulin.
There is a possibility that precipitation and resolubilization can lead to denaturation of the protein. However, we have strong precedence from our lab and the literature that insulin retains its activity after precipitation and release. Specifically, insulin glargine, has full in-vivo bioactivity after depot precipitation and resolubilization. This non-natural insulin acts using the identical mechanism as our material, namely isoelectric precipitation, strongly suggesting our materials will retain similar bioactivity after going through the same precipitation and resolubilization. We have also shown that our related modified insulins, even after processing with potentially denaturing organic solvents such as DMSO, retain full bioactivity.
An additional challenge is that the small molecule photolysis residue will have its own toxicological properties. This residual species is highly charged, which increases its chances of being easily excreted. The DMNPE photolytic group constitutes ≤3% of the material and is equivalent to a low microgram daily exposure. If signs of toxicity are observed in-vivo due to the non-peptidic photolytic component, the specific photocleavable group can be replaced, due to the modularity of the design.
We previously have shown that insoluble materials that photo-release soluble insulin in-vitro are readily capable of in-vivo efficacy.19 Specifically, with first generation materials, we linked insulin to an insoluble polymer with a light cleaved link, and demonstrated that soluble insulin was released in a light dependent manner. We then showed that this type of material shows parallel efficacy in-vivo, with insulin detected in the blood only after irradiation of the injected insoluble depot. The correlation between in-vitro and in-vivo efficacy gives us confidence that other methods of achieving insolubility, such as the charge tag approach described in this work, will similarly be effective. In fact, because these second generation materials contain approximately ten times the insulin per weight, we can expect even greater efficacy. In addition, we can potentially incorporate photolytic groups that cleave with longer wavelength light that has the potential to be more penetrating and less toxic.
A key advantage for our materials over insulin-glargine is that the charged groups that we are adding to insulin to shift the pI are only temporarily linked to the protein, via a light cleaved linker. This accomplishes multiple things: Firstly, it allows for the light stimulated re-solubilization of the protein, thus allowing insulin to be released from the depot in response to light (the principle purpose of a photoactivated depot). In addition, it creates this depot without the need for bulky, inefficient polymers, which themselves would need to be cleared from the system after the therapeutic is consumed (an additional and challenging design constraint). In addition, the non-native elements that have created the depot, specifically the positively charged moieties and photocleaved linker, are removed upon photolysis, releasing completely native insulin, which avoids some of the potential problems that are possibly associated with non-native insulins36–37. Also, by shifting the pI of the protein towards the neutral, it allows for a completely soluble formulation, avoiding the challenges of injecting polymer beads. Finally, the small relative size of the pI shifting charge tag confers photo-activatablity at a very small cost in terms of material. Whereas polymer based depots require large amounts of polymer relative to the delivered insulin, the photoactivated charge tag is highly efficient, and the final materials are 91% dry w/w insulin, which approaches ideality. This suggests that they can be the basis for improved in-vivo performance in controlling blood glucose with an insulin photoactivated depot.
Materials and Methods
(Complete materials and methods including synthesis and characterization of all species and intermediates may be found in the supporting information.)
Solubility Studies:
The solubility of insulin and P2-insulin were analyzed at both pH 4.0 and 7.2, using PBS (10mM phosphate, 137mM NaCl). An amount of each peptide or modified peptide was added to each Eppendorf tube such that saturation would be achieved. The amount of added P2-insulin was determined using the UV absorbance at 345nm and an extinction coefficient of 4470 M−1 cm−1. The umodified insulin amount was determined by weight. Saturation was confirmed by observing solid in the tube at equillibrium, and by analyzing this solid. Specifically, the solid was dissolved in DMSO and analyzed by HPLC to confirm either insulin or P2-insulin presence. Solubility was determined as follows:
100 µL of the respective buffers were added (pH 7.2 and 4). The material was suspended with the help of a pipette. Small changes in pH were observed likely due to counterions in both insulin and modified insulin. Therefore the pH of the buffer was readjusted to the desired pH by addition of small quantities of 0.1 N NaOH. Tubes were shaken at 300 RPM for 2 hours to suspend the material homogenously. After 2 hours, the tubes were centrifuged at 15000 RCF for 3 minutes. This clarified the supernatant, which was then analyzed by HPLC. The amount of insulin or P2-Insulin was quantified using standard curves of insulin and compound 2 (supporting information) respectively.
P2-Insulin Photolysis in DMSO:
HPLC purified P2-Insulin was dissolved in DMSO and quantified using UV spectroscopy. 20 nmoles of P2-Insulin was transferred into a 1 mL glass insert (Fisherbrand) and dried.
A 365 nm LED was used to photolyze the material. The absolute irradiance of the LED was measured by using a USB-2000 fiber optic spectrometer (Ocean Optics, Inc.), fitted with a cosine corrector and the SpectraSuite package. This was measured at a distance of 7cm, the same distance used for the photolysis experiments.
20 nmoles of dried P2-Insulin was dissolved in 40 μL of DMSO (0.5 nmol/μL) in a glass insert. This glass insert was placed such that the bottom was 7 cm away from the LED light source. The solution was irradiated with 365 nm light for the respective time intervals. At the end of each exposure, the LED was turned off and 2 µl of the solution were sampled from the tube for analysis. The LED was then turned on and photolysis was continued until the next time point.
2 µL of each sample was diluted with 8 µL of Bio-Rad IEF sample loading buffer and this 10 µL was loaded onto an IEF gel (pH 3–10) and run as discussed in the ‘Isoelectric Point Determination’ section (Supporting Information).
The gel was photographed and analyzed using Adobe Photoshop as described earlier[3]. Briefly, the gel image was converted into grayscale and inverted. Using the marquee tool, bands and backgrounds were selected. Signal intensity in the bands (and backgrounds) was measured with the measurement tool. Band intensities were corrected for background. Photoreleased insulin was quantified from the lower band, previously shown to be insulin. The amount of insulin released was determined by normalizing the band intensity to the intensity of the 60 minute sample insulin band, which was set at 20nmoles, the starting amount of P2-insulin. The insulin photo-release profile was plotted as a function of time, and the curve was fitted in KaleidaGraph using a first order rate law, as follows:
P2-Insulin Photolysis in pH 7.2 PBS
HPLC purified P2-Insulin (compound 20) was dried, dissolved in DMSO and quantified using UV spectroscopy with an extinction coefficient of 4470 M−1 cm−1 at 345 nm. A volume of DMSO equivalent to 100 nmoles of P2-Insulin was transferred into glass insert and the DMSO removed by vacuum.
A 365 nm LED was used to photolyze the material. The absolute irradiance of the LED was measured by using a USB-2000 fiber optic spectrometer (Ocean Optics, Inc.), fitted with a cosine corrector and the SpectraSuite package. This was measured at a distance of 5cm, the same distance used for the photolysis experiments.
100nmoles of P2-Insulin was added to 100 μL pH 7.2 PBS (10mM phosphate, 137mM NaCl). The pH of the buffer was measured and corrected to 7.2 through addition of small amounts of 0.1 N sodium hydroxide. The material was suspended with the help of a pipette. It was then centrifuged at 15000 RCF for 4 minutes to clarify the supernatant of small particle of P2-insulin. 100 μL of the supernatant was collected without disturbing the P2-Insulin pellet. This supernatant sample when analyzed was considered the zero time point, as it was unirradiated. Following this initial step, the material was resuspended in 100µl of fresh PBS, and photolyzed. Supernatant was isolated from this photolysis suspension at specific time points for analysis. These time points were 1, 2, 3, 4, 5, 10, 15, 30 and 60 minutes. Supernatant isolation was effected by centrifuging the tubes, removing the entire 100µl buffer for analysis, and replacing the removed buffer with 100µl of fresh buffer. A control reaction was also carried out, which was processed identically without exposing the sample to 365 nm LED irradiation.
To 10 μL of PBS supernatant collected at respective time points, 10 μL of IEF sample buffer were added and mixed thoroughly by vortexing. This 20 μL sample was loaded onto IEF gels (pH 3–10) and run as discussed in the ‘isoelectric point determination’ section. 10 μL each of 20 μM, 40 μM, 60 μM, 80 μM and 100 μM insulin solutions in DMSO were mixed with 10 μL of IEF sample buffer respectively (total 20 μL) and run as insulin standards (corresponding to 0.2 nmoles, 0.4 nmoles, 0.6 nmoles, 0.8 nmoles and 1 nmole insulin respectively). Insulin photorelease was quantified using the insulin standard curve generated from these insulin standards as run on the IEF gel. Samples were run on two gels. Gel 1 contained samples collected at 0, 1, 2, 3, 4, 5, 10 and 15 minutes (seen in the main manuscript). Gel 2 contained samples collected at 30 and 60 minutes, and the insulin standards (seen in the supporting information document).
See P2-Insulin photorelease (Gel 1) in the manuscript. Gel 2 of P2-Insulin photolysis and both Gels 1 and 2 of control reaction are shown below. See figures S47, S48 and S49.
The insulin photo-release profile was plotted as a function of time, and the curve was fitted in KaleidaGraph using a first order rate law, as follows:
Supplementary Material
ACKNOWLEDGMENT
Research reported in this publication was supported by the National Institute Of Diabetes And Digestive And Kidney Diseases of the National Institutes of Health under Award Number DP3DK106921 as well as the support of a University of Missouri Fast Track Award and the UMKC School of Pharmacy Dean’s Bridge Fund. We thank Dr. Cameron Lindsey for her contribution of a sample of insulin glargine.
We acknowledge Prof. William Gutheil for guidance regarding mass spectrometry issues.
Footnotes
Competing Financial Interests
The authors declare no competing financial interests.
ASSOCIATED CONTENT
Supporting Information
Complete and detailed materials and methods, including synthesis and characterization of intermediates and products. This includes HPLC and ESI-MS analysis.
The Supporting Information is available free of charge on the ACS Publications website.
REFERENCES
- 1.Carling CJ; Olejniczak J; Foucault-Collet A; Collet G; Viger ML; Nguyen Huu VA; Duggan BM; Almutairi A, Efficient red light photo-uncaging of active molecules in water upon assembly into nanoparticles. Chemical Science 2016, 7 (3), 2392–2398. [DOI] [PMC free article] [PubMed] [Google Scholar]
- 2.Gatterdam V; Ramadass R; Stoess T; Fichte MAH; Wachtveitl J; Heckel A; Tamp√©, R., Three-dimensional protein networks assembled by two-photon activation. Angewandte Chemie - International Edition 2014, 53 (22), 5680–5684. [DOI] [PubMed] [Google Scholar]
- 3.Gorka AP; Schnermann MJ, Harnessing cyanine photooxidation: from slowing photobleaching to near-IR uncaging. Current Opinion in Chemical Biology 2016, 33, 117–125. [DOI] [PMC free article] [PubMed] [Google Scholar]
- 4.Griepenburg JC; Rapp TL; Carroll PJ; Eberwine J; Dmochowski IJ, Ruthenium-caged antisense morpholinos for regulating gene expression in zebrafish embryos. Chemical Science 2015, 6 (4), 2342–2346. [DOI] [PMC free article] [PubMed] [Google Scholar]
- 5.Liu Q; Deiters A, Optochemical control of deoxyoligonucleotide function via a nucleobase-caging approach. Accounts of Chemical Research 2014, 47 (1), 45–55. [DOI] [PMC free article] [PubMed] [Google Scholar]
- 6.Rodrigues-Correia A; Weyel XMM; Heckel A, Four levels of wavelength-selective uncaging for oligonucleotides. Organic Letters 2013, 15 (21), 5500–5503. [DOI] [PubMed] [Google Scholar]
- 7.Ruble BK; Yeldell SB; Dmochowski IJ, Caged oligonucleotides for studying biological systems. Journal of Inorganic Biochemistry 2015, 150, 182–188. [DOI] [PMC free article] [PubMed] [Google Scholar]
- 8.Sato K; Gorka AP; Nagaya T; Michie MS; Nakamura Y; Nani RR; Coble VL; Vasalatiy OV; Swenson RE; Choyke PL; Schnermann MJ; Kobayashi H, Effect of charge localization on the: In vivo optical imaging properties of near-infrared cyanine dye/monoclonal antibody conjugates. Molecular BioSystems 2016, 12 (10), 3046–3056. [DOI] [PMC free article] [PubMed] [Google Scholar]
- 9.Shestopalov IA; Chen JK, Spatiotemporal control of embryonic gene expression using caged morpholinos. In Methods in Cell Biology, 2011; Vol. 104, pp 151–172. [DOI] [PMC free article] [PubMed] [Google Scholar]
- 10.Walsh S; Gardner L; Deiters A; Williams GJ, Intracellular light-activation of riboswitch activity. ChemBioChem 2014, 15 (9), 1346–1351. [DOI] [PMC free article] [PubMed] [Google Scholar]
- 11.Zhan C; Wang W; McAlvin JB; Guo S; Timko BP; Santamaria C; Kohane DS, Phototriggered Local Anesthesia. Nano Letters 2016, 16 (1), 177–181. [DOI] [PubMed] [Google Scholar]
- 12.Shah S; Rangarajan S; Friedman SH, Light activated RNA interference. Angew. Chem. Int. Edit 2005, 44 (9), 1328–1332. [DOI] [PubMed] [Google Scholar]
- 13.Shah S; Jain PK; Kala A; Karunakaran D; Friedman SH, Light-activated RNA interference using double-stranded siRNA precursors modified using a remarkable regiospecificity of diazo-based photolabile groups. Nucleic Acids Res 2009, 37 (13), 4508–17. [DOI] [PMC free article] [PubMed] [Google Scholar]
- 14.Jain PK; Shah S; Friedman SH, Patterning of Gene Expression Using New Photolabile Groups Applied to Light Activated RNAi. J Am Chem Soc 2010, 133 (3), 440–446. [DOI] [PubMed] [Google Scholar]
- 15.Kala A; Friedman SH, Enhanced light-activated RNA interference using phosphorothioate-based dsRNA precursors of siRNA. Pharm Res 2011, 28 (12), 3050–7. [DOI] [PubMed] [Google Scholar]
- 16.Jain PK; Karunakaran D; Friedman SH, Construction of a Photoactivated Insulin Depot. Angew Chem Int Ed Engl 2013, 52 (5), 1404–9. [DOI] [PubMed] [Google Scholar]
- 17.Kala A; Jain PK; Friedman SH, Patterning of cells through patterning of biology. Mol Biosyst 2014, (10), 1689–1692. [DOI] [PubMed]
- 18.Sarode BR; Jain PK; Friedman SH, Polymerizing Insulin with Photocleavable Linkers to Make Light-Sensitive Macropolymer Depot Materials. Macromol Biosci 2016, 16 (8), 1138–46. [DOI] [PMC free article] [PubMed] [Google Scholar]
- 19.Sarode BR; Kover K; Tong PY; Zhang C; Friedman SH, Light Control of Insulin Release and Blood Glucose Using an Injectable Photoactivated Depot. Mol Pharm 2016, 13 (11), 3835–3841. [DOI] [PMC free article] [PubMed] [Google Scholar]
- 20.Heinemann L; Fleming GA; Petrie JR; Holl RW; Bergenstal RM; Peters AL, Insulin pump risks and benefits: a clinical appraisal of pump safety standards, adverse event reporting and research needs. A Joint Statement of the European Association for the Study of Diabetes and the American Diabetes Association Diabetes Technology Working Group. Diabetologia 2015, 58 (5), 862–870. [DOI] [PubMed] [Google Scholar]
- 21.Joshi M; Choudhary P, Multiple Daily Injections OR Insulin Pump Therapy: Choosing the Best Option for Your Patient—An Evidence-based Approach. Current Diabetes Reports 2015, 15 (10). [DOI] [PubMed] [Google Scholar]
- 22.Kuroda K; Takeshita Y; Kaneko S; Takamura T, Bending of a vertical cannula without alarm during insulin pump therapy as a cause of unexpected hyperglycemia: A Japanese issue? Journal of Diabetes Investigation 2015, 6 (6), 739–740. [DOI] [PMC free article] [PubMed] [Google Scholar]
- 23.Ross PL; Milburn J; Reith DM; Wiltshire E; Wheeler BJ, Clinical review: insulin pump-associated adverse events in adults and children. Acta Diabetologica 2015, 52 (6), 1017–1024. [DOI] [PubMed] [Google Scholar]
- 24.Doyle EA; Weinzimer SA; Steffen AT; Ahern JAH; Vincent M; Tamborlane WV, A randomized, prospective trial comparing the efficacy of continuous subcutaneous insulin infusion with multiple daily injections using insulin glargine. Diabetes Care 2004, 27 (7), 1554–1558. [DOI] [PubMed] [Google Scholar]
- 25.Gillies PS; Figgitt DP; Lamb HM, Insulin glargine. Drugs 2000, 59 (2), 253–260. [DOI] [PubMed] [Google Scholar]
- 26.Heinemann L; Linkeschova R; Rave K; Hompesch B; Sedlak M; Heise T, Time-action profile of the long-acting insulin analog insulin glargine (HOE901) in comparison with those of NPH insulin and placebo. Diabetes Care 2000, 23 (5), 644–649. [DOI] [PubMed] [Google Scholar]
- 27.Lepore M; Pampanelli S; Fanelli C; Porcellati F; Bartocci L; Vincenzo AD; Cordoni C; Costa E; Brunetti P; Bolli GB, Pharmacokinetics and pharmacodynamics of subcutaneous injection of long-acting human insulin analog glargine, NPH insulin, and ultralente human insulin and continuous subcutaneous infusion of insulin lispro. Diabetes 2000, 49 (12), 2142–2148. [DOI] [PubMed] [Google Scholar]
- 28.Yki-J√§rvinen H; Dressler A; Ziemen M, Less nocturnal hypoglycemia and better post-dinner glucose control with bedtime insulin glargine compared with bedtime NPH insulin during insulin combination therapy in type 2 diabetes. Diabetes Care 2000, 23 (8), 1130–1136. [DOI] [PubMed] [Google Scholar]
- 29.Boswell CA; Tesar DB; Mukhyala K; Theil F-P; Fielder PJ; Khawli LA, Effects of charge on antibody tissue distribution and pharmacokinetics. Bioconjugate chemistry 2010, 21 (12), 2153–2163. [DOI] [PubMed] [Google Scholar]
- 30.Bumbaca D; Boswell CA; Fielder PJ; Khawli LA, Physiochemical and biochemical factors influencing the pharmacokinetics of antibody therapeutics. The AAPS journal 2012, 14 (3), 554–558. [DOI] [PMC free article] [PubMed] [Google Scholar]
- 31.Chan P; Lovrić J; Warwicker J, Subcellular pH and predicted pH‐dependent features of proteins. Proteomics 2006, 6 (12), 3494–3501. [DOI] [PubMed] [Google Scholar]
- 32.Chan P; Warwicker J, Evidence for the adaptation of protein pH-dependence to subcellular pH. BMC biology 2009, 7 (1), 69. [DOI] [PMC free article] [PubMed] [Google Scholar]
- 33.Garcia-Moreno B, Adaptations of proteins to cellular and subcellular pH. Journal of biology 2009, 8 (11), 98. [DOI] [PMC free article] [PubMed] [Google Scholar]
- 34.Morgan AC Jr; Sivam GP; Abrams PG, Alteration of pharmacokinetics of proteins by charge modification. Google Patents: 1994.
- 35.Schwartz R; Ting CS; King J, Whole proteome pI values correlate with subcellular localizations of proteins for organisms within the three domains of life. Genome research 2001, 11 (5), 703–709. [DOI] [PubMed] [Google Scholar]
- 36.Hansen B, Insulin analogues with increased mitogenic potency-are they safe? Hormone and metabolic research 2008, 40 (06), 431–433. [DOI] [PubMed] [Google Scholar]
- 37.Kurtzhals P; Schäffer L; Sørensen A; Kristensen C; Jonassen I; Schmid C; Trüb T, Correlations of receptor binding and metabolic and mitogenic potencies of insulin analogs designed for clinical use. Diabetes 2000, 49 (6), 999–1005. [DOI] [PubMed] [Google Scholar]
Associated Data
This section collects any data citations, data availability statements, or supplementary materials included in this article.


