Significance Statement
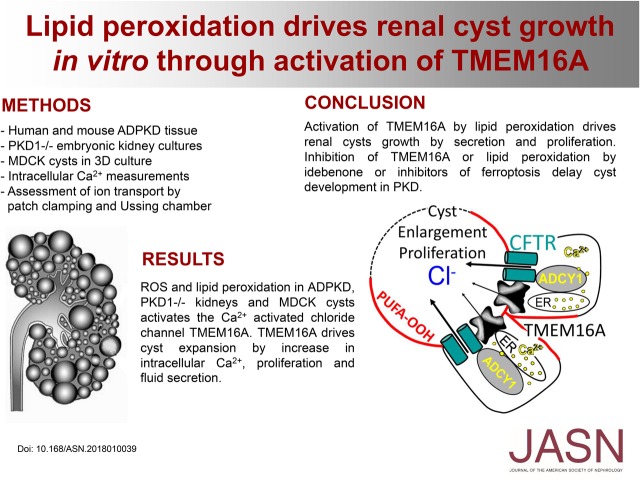
The chloride channels cystic fibrosis transmembrane conductance regulator (CFTR) and TMEM16A (anoctamin 1) drive cyst enlargement in polycystic kidney disease (PKD), ultimately leading to kidney failure. The mechanisms for channel activation, however, are poorly understood. The authors show for the first time that peroxidation of plasma membrane phospholipids activates renal TMEM16A; this facilitates calcium signaling and activation of the calcium-sensitive adenylate cyclase ADCY1, which further stimulates CFTR. The antioxidant idebenone significantly delays cyst enlargement as does ferrostatin-1, suggesting activation of ferroptosis, an apoptosis-independent regulated cell death pathway during PKD. These findings show a strong effect of reactive oxygen species on cyst progression via lipid peroxidation. Inhibition of lipid peroxidation and blockade of TMEM16A are potential novel therapeutic approaches to delay cyst development in PKD.
Keywords: ADPKD, TMEM16A, reactive oxygen species, lipid peroxidation, ferroptosis, anoctamin 1
Visual Abstract
Abstract
Background
Transepithelial chloride− secretion, through the chloride channels cystic fibrosis transmembrane conductance regulator (CFTR) and TMEM16A (anoctamin 1), drives cyst enlargement in polycystic kidney disease (PKD). Polycystic kidneys are hypoxic, and oxidative stress activates TMEM16A. However, mechanisms for channel activation in PKD remain obscure.
Methods
Using tissue samples from patients with autosomal dominant PKD, embryonic kidney cultures, and an MDCK in vitro cyst model, we assessed peroxidation of plasma membrane phospholipids in human and mouse polycystic kidneys. We also used electrophysiologic Ussing chamber and patch clamp experiments to analyze activation of TMEM16A and growth of renal cysts.
Results
Peroxidation of phospholipids in human and mouse kidneys as well as MDCK cysts in vitro is probably due to enhanced levels of reactive oxygen species. Lipid peroxidation correlated with increased cyst volume as shown in renal cultures and MDCK cysts in three-dimensional cultures. Reactive oxygen species and lipid peroxidation strongly activated TMEM16A, leading to depletion of calcium ion stores and store-operated calcium influx. Activation of TMEM16A- and CFTR-dependent chloride secretion strongly augmented cyst growth. Exposure to scavengers of reactive oxygen species, such as glutathione, coenzyme Q10, or idebenone (a synthetic coenzyme Q10 homolog), as well as inhibition of oxidative lipid damage by ferrostatin-1 largely reduced activation of TMEM16A. Inhibition of TMEM16A reduced proliferation and fluid secretion in vitro.
Conclusions
These findings indicate that activation of TMEM16A by lipid peroxidation drives growth of renal cysts. We propose direct inhibition of TMEM16A or inhibition of lipid peroxidation as potentially powerful therapeutic approaches to delay cyst development in PKD.
Polycystic kidneys are hypoxic, which results in stabilization of hypoxia-inducible transcription factor-1a in the cyst epithelium, causing upregulation of the Ca2+-activated Cl− channel TMEM16A.1 TMEM16A enables Ca2+-activated Cl− secretion, which leads to expansion of renal cysts and proliferation of the cyst-forming epithelium.2 Oxidative stress also activates Ca2+-dependent Cl− channels in other tissues, such as airway epithelial cells; however, the mechanisms for channel activation in polycystic kidney remain obscure.3 In airway epithelial cells, TMEM16A and TMEM16F are activated by reactive oxygen species (ROS).4 TMEM16F is a Ca2+-activated phospholipid scramblase (i.e., it transports phospholipids from one leaflet to the other leaflet of the plasma membrane). However, it is also able to conduct cations as well as anions. Pronounced activation of TMEM16F by a large increase in intracellular Ca2+ leads to cell death.4–7 Notably, TMEM16F is also localized in the primary cilium and the plasma membrane of renal tubular cells. It seems to be required for regulated cell death in the center of growing cysts. Thus, removal of central cells together with TMEM16A-dependent Cl− secretion and activation of proliferation may form an electrolyte-filled cyst cavity.8 TMEM16A and TMEM16F support cell proliferation and cell death, respectively.9,10
Cl− currents by TMEM16A and TMEM16F are activated by an increase in intracellular Ca2+. TMEM16A and TMEM16F are also activated in a Ca2+-independent manner by destabilizing the plasma membrane due to ROS-induced lipid peroxidation or phospholipase C.4,7,11 Lipophilic compounds, such as idebenone, coenzyme Q10, or fatty acids, may inhibit activation of TMEM16A and TMEM16F. They may act as antioxidants, or they may insert into the plasma membrane and stabilize the lipid bilayer, thus limiting the access of Ca2+ ions to the Ca2+ binding sites located in the inner third of the membrane.7,11 We, therefore, examined in this study (1) whether membrane phospholipids are oxidized and TMEM16A is activated in polycystic kidney disease (PKD); (2) whether idebenone, coenzyme Q10, and other compounds inhibit TMEM16A activated by lipid peroxidation or Ca2+ increase due to purinergic stimulation (ATP and UTP); and (3) if cyst growth in PKD depends on lipid peroxidation and if idebenone, coenzyme Q10, or inhibition of oxidative lipid damage by ferrostatin-1 slows down growth of renal cysts. The results clearly indicate that lipid peroxidation activates TMEM16A, which is essential for proliferation and expansion of renal cysts. The data strongly suggest the use of antioxidants, inhibitors of ferroptosis, a regulated cell death pathway, or blockers of TMEM16A to delay cyst development and renal insufficiency in PKD.
Methods
Embryonic Kidneys and MDCK Cyst Model
The methods for metanephric kidneys in organ culture have been described previously.1 The age of the mice used for experiments was between 12 and 14 weeks old. plMDCK (MDCK-C7, M/+T16A) cysts were grown, and in vitro cyst assays were performed as described previously.2 In brief, MDCK cells were resuspended as a single-cell suspension in type 1 collagen and filled into 24-well plates (three to six wells per condition). Forskolin, tert-butyl hydroperoxide (tBHP), GSHEE, idebenone, and H2O2 (all Sigma-Aldrich, Munich, Germany) were added to the medium on day 0 at the concentration mentioned in the figures, and the medium was changed every 24–48 hours. It was shown earlier that MDCK cells grown under these conditions are exposed to a reduced oxygen tension.1 After 5 days, four random visual fields per well were photographed with a Zeiss Primo Vert microscope and a Zeiss Axiocam 105 color camera (both Zeiss Microscopy GmbH, Jena, Germany). Cyst diameters of all captured cysts (approximately 350–400 cysts per condition and single experimental procedure) were measured with ImageJ V. 1.48 (US National Institutes of Health, Bethesda, MD; http://imagej.nih.gov/ij/) and the use of a Wacom Tablet device (Wacom, Dusseldorf, Germany). Cyst volume was then estimated using the formula for the volume of a sphere: 4/3πr3.
Ussing Chamber Experiments
MDCK cells were grown as polarized monolayers on permeable supports (Millipore). Cells were mounted into a perfused micro-Ussing chamber, and experiments were performed as described earlier.1,2 To compare cyst growth and Cl− secretion in cells with and without expression of TMEM16A, two MDCK clones were selected (M/+T16A corresponding to MDCK-C7 cells12 and M/−T16A corresponding to MDCK-M2 cells13). In addition, new MDCK cell lines were generated by shRNA from MDCK-C7 cells, with stable knockdown of either TMEM16A or cystic fibrosis transmembrane conductance regulator (CFTR), or stably expressing scrambled RNA. To avoid crossartifact, all experiments were performed in naïve, previously untreated monolayers.
Collection of Human Renal Autosomal Dominant PKD Tissue and Patient Characteristics
Kidney specimens of seven patients (six men and one woman; age: 55.6±9.3 years old [mean ± SD]) were obtained as described previously.2 Briefly, tissue was fixed immediately after nephrectomy in 3% paraformaldehyde (pH 7.4). Six patients were on hemodialysis at the time of nephrectomy, thus representing rather late stages of autosomal dominant polycystic kidney disease (ADPKD). Collection and analysis of tissue samples were approved by the local ethics committee.
Experimental Animals
All animal experiments were approved by local government authorities and conformed to the US National Institutes of Health Guide for the Care and Use of Laboratory Animals. In this study, kidney sections of a tamoxifen-inducible kidney epithelium–specific Pkd1 deletion mouse model were used. On administration of tamoxifen (tam-KspCad-Cre; Pkd1lox;lox), a genomic fragment containing exons 2–11 of the Pkd1 gene is specifically deleted in renal epithelial cells, and cysts are formed as described previously.14 Tamoxifen was administered at postnatal days 35–37 via intraperitoneal injection. Kidneys were extracted 12 weeks after induction with tamoxifen. In addition, kidney sections of mice that underwent ischemia-reperfusion injury as described previously were used as positive controls for detection of ROS.15
Immunochemistry
Paraffin sections of kidneys were treated with target retrieval solution (pH 6; Dako, Agilent), blocked, and incubated with primary antibodies rabbit anti-TMEM16A16 (custom antibody, Davids Biotechnologie) and rabbit anti–4-hydroxy-2-nonenal (4HNE; Abcam, Berlin, Germany) at 4°C overnight. Cells were incubated with secondary AlexaFluro 488 goat anti-rabbit IgG or AlexaFluro 647 goat anti-rabbit IgG (Molecular Probes, Thermo Fisher). For lectin staining, tissues were incubated with biotinylated lotus tetragonolobus lectin and afterward, streptavidin-Cy3 (Vector Laboratories, Biozol). Dolichos biflorus agglutinin (DBA) was visualized using fluorescein-labeled DBA (Vector Laboratories); 4′,6-diamidino-2-phenylindole (Sigma-Aldrich) was used for nucleic acid staining.
plMDCK cells were grown on glass coverslips and incubated for 30 minutes with 100 μM tBHP under control conditions or after 3 hours preincubation with 50 μM idebenone. Cells were fixed with methanol at −20°C for 10 minutes. After washing in PBS, cells were incubated with primary antibody rabbit anti-4HNE (Alpha Diagnostic International) at 4°C overnight. Cells were incubated with secondary AlexaFluro 488 goat anti-rabbit IgG (Molecular Probes, Thermo Fisher) for 1 hour at room temperature. After washing with PBS, cells were counterstained with Hoe33342 (Sigma-Aldrich) and mounted with Dako Cytomation fluorescent mounting media (DAKO Cytomation). Immunofluorescence was detected using an Axiovert 200 microscope equipped with an ApoTome and AxioVision software (Zeiss, Jena, Germany).
Cells, cDNA, Transfection, and RT-PCR
HEK293 and plMDCK cells were grown as described earlier.11,12 Generation of cDNA and transfection/expression of TMEM16A as well as methods for RT-PCR have been described earlier.17
Patch Clamping
Cells were grown on coated glass coverslips. Patch pipettes were filled with a cytosolic-like solution containing 30 mM KCl, 95 mM K-gluconate, 1.2 mM NaH2PO4, 4.8 mM Na2HPO4, 1 mM EGTA, 0.758 mM Ca-gluconate, 1.03 mM MgCl2, 5 mM d-glucose, and 3 mM ATP, pH 7.2. The intracellular (pipette) Ca2+ activity was 0.1 μM. Fast whole-cell current recordings and single-channel recordings in excised inside/out membrane patches were performed as described recently.6 The bath was perfused continuously with Ringer solution at a rate of 8 ml/min. Patch pipettes had an input resistance of 2–4 MΩ, and whole-cell currents were corrected for serial resistance. Currents were recorded using a patch clamp amplifier (EPC 7; List Medical Electronics, Darmstadt, Germany), the LIH1600 interface, and PULSE software (HEKA, Lambrecht, Germany) as well as Chart software (AD Instruments, Spechbach, Germany). In regular intervals, membrane voltage (Vc) was clamped in steps of 20 mV from −100 to +100 mV from a holding voltage of −100 mV. Current density was calculated by dividing whole-cell currents by cell capacitance. TMEM16A (isoform abc) was expressed in HEK293 cells.
Measurement of Intracellular [Ca2+]
Measurement of the intracellular Ca2+ concentration was performed as described recently.18 In brief, cells were loaded with Fura2-AM in Ringer solution at 37°C for 30 minutes. Fluorescence was detected at 37°C using an inverted microscope IMT-2 (Olympus, Nuremberg, Germany) and a high-speed polychromator system (Visi-Chrome, Puchheim, Germany). The results were obtained at a 340- to 380-nm fluorescence ratio (after background subtraction). After calibration, intracellular Ca2+ concentrations were calculated.
Detection of Intracellular ROS
Intracellular ROS was detected using 2',7'-di-chlorodihydrofluorescein diacetate (H2DCFDA; Molecular Probes, Invitrogen) or alternatively, the fluorogenic cytosolic sensor MAK142 (Taufkirchen). Signals were captured with a confocal microscope (TCS SP5 II; Leica Microsystems, Wetzlar, Germany).
Statistical Analyses
Data are shown as dot blots including mean ± SEM. Paired and unpaired t tests were used where appropriate. ANOVA was used to compare groups (P value <0.05).
Results
Lipid Peroxidation in Autosomal Dominant Polycystic Kidney Disease
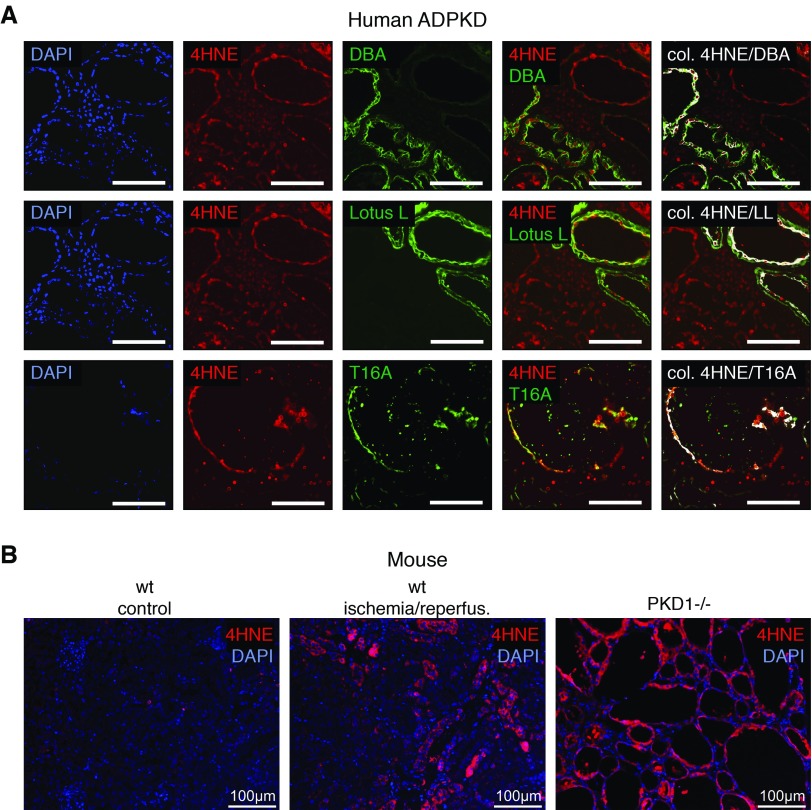
Oxidative stress leads to preferential peroxidation of polyunsaturated fatty acids and production of 4HNE, which is detected immunohistochemically. Human polycystic kidneys show peroxidized phospholipids in (DBA-positive) distal tubules/collecting ducts as well as (lotus lectin–positive) proximal tubules (Figure 1A, Supplemental Figure 1A). Statistically significant colocalization with 4HNE staining was also detected for TMEM16A. Lipid peroxidation was also detected in polycystic kidneys from PKD1−/− and PKD2−/− mice and kidneys that underwent ischemia-reperfusion. Very little lipid peroxidation was detected in a normal mouse kidney (Figure 1B, Supplemental Figure 1, B and C).
Figure 1.
Lipid peroxidation is induced in autosomal dominant polycystic kidney disease (ADPKD). (A) Immunohistochemistry in a polycystic kidney representative of seven analyzed patients with ADPKD. Peroxidized phospholipids are shown in red (4-hydroxy-2-nonenal [4HNE]). Distal tubules/collecting ducts are labeled with dolichos biflorus agglutinin (DBA; top row; green), proximal tubules are labeled with lotus lectin (LL; middle row; green), and TMEM16A is labeled in green (T16A; bottom row). Statistically significant colocalization of DBA, LL, and T16A with 4HNE was analyzed and is shown in white (colocalization finder algorithm: http://rsb.info.nih.gov/ij/plugins/colocalization-finder.html; Laummonerie & Mutterer, Institute of Biology Moleculaire des Plantes, Strasbourg, France). DAPI, 4′,6-diamidino-2-phenylindole. Scale bars, 100 μm. (B) Lipid peroxidation detected by 4HNE (red) staining in a mouse kidney that underwent ischemia-reperfusion (center panel) and a mouse ADPKD model induced by tubule-specific knockout of Pkd1 (right panel). Only a little lipid peroxidation was detected in a normal mouse kidney (left panel).
Lipid Peroxidation Drives Renal Cyst Development in Mouse Embryonic Kidney Organ Culture
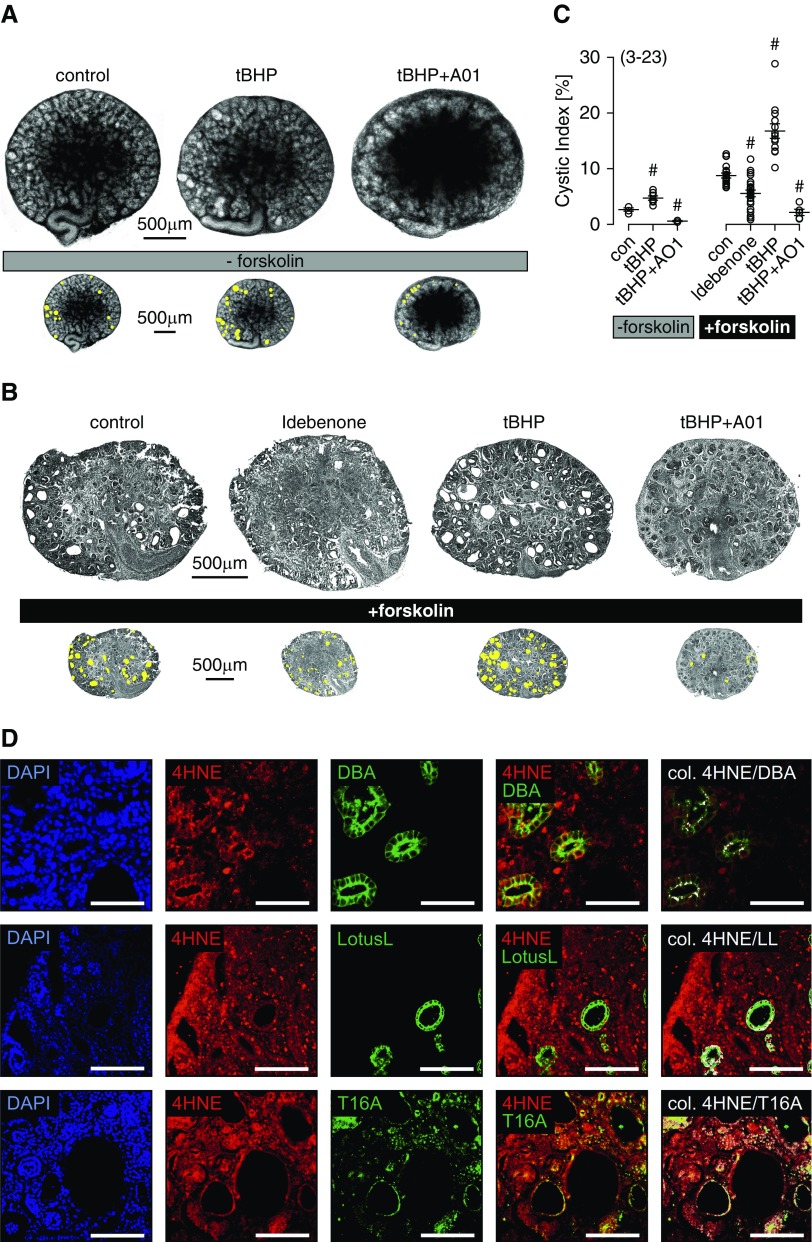
We made use of metanephric kidneys in organ culture from mice lacking expression of PKD1 (PKD1−/−) to examine further the role of lipid peroxidation for renal cyst growth.1 PKD1−/− cysts were present even in the absence of cAMP-dependent stimulation (forskolin), and they were more frequent in the presence of tBHP. Cyst growth by tBHP was inhibited by CaCCinhAO1 (AO1), an inhibitor of the Ca2+-activated Cl− channel TMEM16A (Figure 2A).19 Cysts developed more rapidly in the presence of forskolin, and cyst growth was further augmented by the lipid-peroxidizing compound tBHP. In contrast, cyst growth was inhibited by the antioxidant and TMEM16A blocker idebenone, a synthetic homolog of coenzyme Q10,20 and AO1 (Figure 2, B and C). Immunohistochemistry in PKD1−/− kidneys showed peroxidized phospholipids (4HNE) (Figure 2D, red) in distal tubules/collecting ducts (DBA) and proximal tubules (lotus lectin), similar to human ADPKD. Moreover, expression of TMEM16A was detected in tubules affected by lipid peroxidation (Figure 2D). These data suggest that lipid peroxidation and TMEM16A may be relevant for renal cyst development.
Figure 2.
Reactive oxygen species are inducing renal cysts in mouse embryonic kidney organ culture. (A) Cyst development in embryonic PKD1−/− kidneys maintained as organ cultures. Cysts were present even in the absence of cAMP-dependent stimulation, and they were more frequent in the presence of tert-butyl hydroperoxide (tBHP). Cyst growth by tBHP was inhibited by CaCCinhAO1 (AO1; 10 μM). (B) Cyst development in the presence of forskolin (1 μM). Cyst formation was augmented by tBHP (10 μM), but it was inhibited by idebenone (20 μM idebenone; present throughout the experiment) or AO1 (10 μM; present throughout the experiment). (C) Cystic index obtained from PKD1−/− mouse kidneys in the absence and presence of forskolin. Spontaneous cyst formation was observed in the absence of forskolin, and it was enhanced when forskolin was present. #Significant difference compared with control (con; P<0.05; ANOVA). (D) Immunohistochemistry in a PKD1−/− kidney representative of three analyzed kidneys. Peroxidized phospholipids (4-hydroxy-2-nonenal [4HNE]) are in red, and distal tubules/collecting ducts (dolichos biflorus agglutinin [DBA]; top row), proximal tubules (lotus lectin [LL]; middle row), and TMEM16A (T16A; bottom row) are in green. Colocalization was analyzed as in Figure 1, and it is shown in white. Mean ± SEM (number of experiments). DAPI, 4′,6-diamidino-2-phenylindole. Scale bar, 100 μm.
Oxidative Stress Induces Growth and Expansion of MDCK Cysts
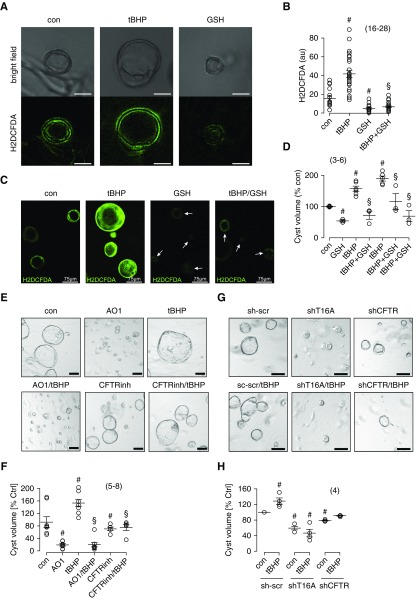
Canine renal epithelial cells originating from principal cells of the collecting duct (principal-like MDCK cells) form cysts when grown in a three-dimensional collagen matrix.2,12 We detected ROS in MDCK cysts using H2DCFDA fluorescence (Figure 3, A and B). Importantly, cyst size was largely enhanced when cells were grown in the presence of lipid-peroxidizing tBHP, but cyst size was reduced in the presence of GSH (Figure 3, C and D). Cyst volume was also enhanced by H2O2 in a concentration-dependent manner, whereas idebenone inhibited cyst growth (Supplemental Figure 2). Idebenone is in clinical trials for a number of diseases with pro-oxidant/proinflammatory alterations, particularly neurodegenerative diseases.21 Idebenone has also been reported as an inhibitor of TMEM16A.22 The data described below and our previous report suggest that idebenone acts as an antioxidant, inhibits lipid peroxidation, and stabilizes the plasma membrane, thereby blocking activation of TMEM16A.11 Inhibition of TMEM16A by AO1 strongly inhibited cyst growth in the absence or presence of tBHP. Inhibition of CFTR by CFTRinh17223 also attenuated cyst formation, confirming that both CFTR and TMEM16A Cl− channels are highly relevant for renal cyst growth (Figure 3, E and F). These results were further supported in experiments in which expression of either TMEM16A or CFTR was knocked down using shRNA (Figure 3, G and H).
Figure 3.
Oxidative stress induces TMEM16A and CFTR dependent growth and expansion of MDCK cysts. (A) Bright-field images and 2',7'-di-chlorodihydrofluorescein diacetate (H2DCFDA) fluorescence in MDCK cysts grown in collagen three-dimensional cultures under control (con) conditions in the presence of tert-butyl hydroperoxide (tBHP) or GSH. H2DCFDA detected reactive oxygen species (ROS) levels close to plasma membranes in confocal images. ROS increase correlated with increase in cyst volume. Scale bars, 50 μm. (B–D) ROS levels and cyst volume under different conditions: under con conditions, with 10 μM tBHP, with 50 μM GSH, or with both 10 μM tBHP and 50 μM GSH. (E and F) Cyst volumes analyzed under different growth conditions: con, CaCCinhAO1 (AO1; 10 μM), tBHP (10 μM), CFTRinh172 (10 μM), or combined application. (G and H) shRNA knockdown of TMEM16A or cystic fibrosis transmembrane conductance regulator (CFTR)–reduced cyst volumes. Mean ± SEM (number of assays). #Significant difference compared with con (P<0.05; ANOVA); §significant difference compared with tBHP (P<0.05; ANOVA).
Lipid Peroxidation Induced TMEM16A-Dependent Cl− Secretion, Which Is Inhibited by Idebenone
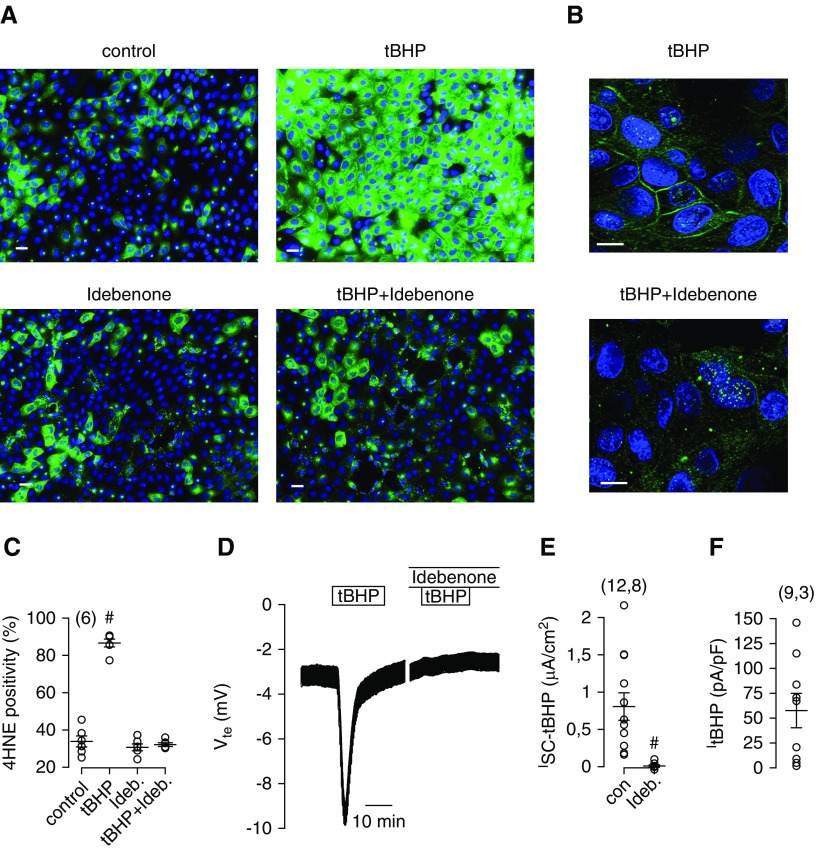
Exposure of MDCK cells to tBHP induced pronounced lipid peroxidation as detected by 4HNE (Figure 4A). Peroxidation of plasma membrane PUFA becomes particularly evident in confocal images (Figure 4B). Idebenone strongly inhibited tBHP-induced lipid peroxidation, suggesting that idebenone inhibits TMEM16A by blocking lipid peroxidation (Figure 4, A–C). Acute application of tBHP to polarized grown MDCK cells on permeable supports induced a large transient voltage deflection when measured in open circuit Ussing chambers, which indicates activation of luminal Cl− secretion (Figure 4D).2 Remarkably, apical Cl− secretion was entirely blocked when tissues were preincubated (15–30 minutes) with idebenone (Figure 4, D and E). Application of tBHP also activated a whole-cell Cl− current in patch clamp experiments with MDCK cells, corresponding to activation of Cl− secretion in Ussing chamber recordings (Figure 4F).
Figure 4.
Lipid peroxidation induced Cl− secretion in MDCK cells. (A) MDCK cells were treated with tert-butyl hydroperoxide (tBHP; 100 μM/30 min), idebenone (50 μM/3 h), or both. tBHP induced pronounced lipid peroxidation (4-hydroxy-2-nonenal [4HNE] fluorescence). Scale bars, 20 μm. (B) Confocal images showing lipid peroxidation of the plasma membrane, which was largely reduced by idebenone. Scale bars, 10 μm. (C) Summary of 4HNE intensity under different conditions. (D) Ussing chamber recording showing the effect of tBHP on transepithelial voltage and indicating activation of transient Cl− secretion, which was completely abolished in the presence of idebenone (preincubated for 15 minutes). (E) Summary of calculated short circuit currents, indicating complete absence of tBHP-induced Cl− secretion in the presence idebenone. (F) Summary of whole-cell current densities measured in patch clamp experiments after activation by tBHP (100 μM). tBHP was applied in the presence of TRAM34 (100 nM) to avoid contamination by Ca2+-activated K+ channels. Mean ± SEM (number of cells analyzed; in C, six areas were analyzed with 1634–2335 cells). #Significant difference compared with control (P<0.05; ANOVA [C]) or absence of idebenone (P<0.05; unpaired t test [E]).
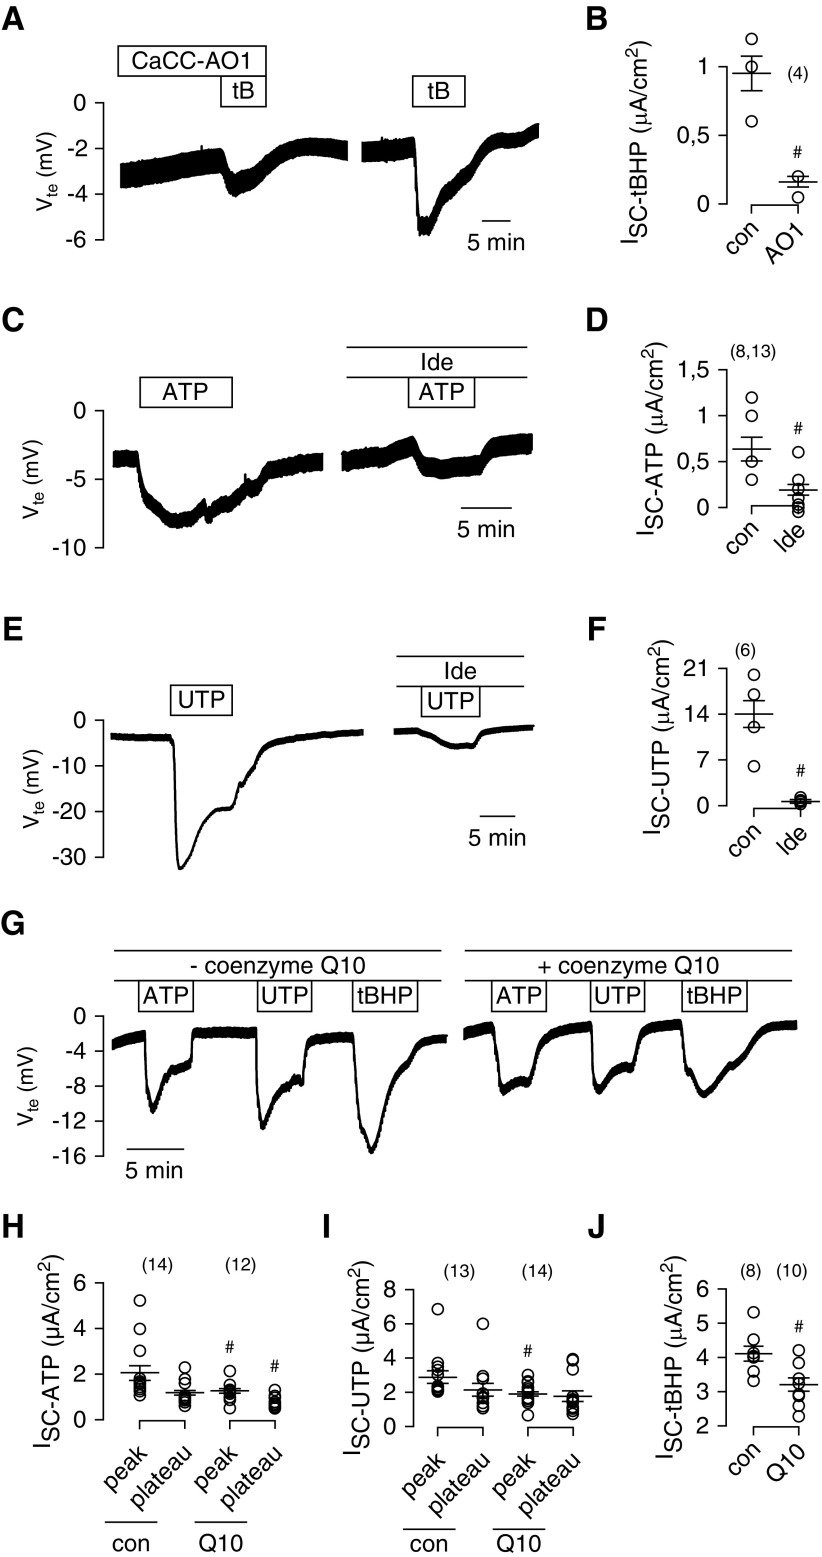
To examine further whether Cl− secretion induced by ROS/lipid peroxidation is due to activation of TMEM16A channels, tBHP was applied in the presence of AO1. AO1 blocked tBHP-induced Cl− secretion, suggesting that lipid peroxidation indeed activates TMEM16A (Figure 5, A and B). TMEM16A is known to be activated through increase in intracellular Ca2+ by stimulation of purinergic P2Y2 receptors with ATP or UTP. Idebenone also blocked activation of TMEM16A by ATP or UTP (Figure 5, C–F). Thus, idebenone interferes with activation of TMEM16A by increase in intracellular Ca2+ and lipid peroxidation. Using yellow fluorescence protein quenching assays, we examined concentration dependence of the inhibitory effect of idebenone. We found that concentrations above 10 μM are required to inhibit activation of TMEM16A (Supplemental Figure 3).
Figure 5.
Reactive oxygen species–induced lipid peroxidation activates Ca2+-dependent Cl− secretion. (A) Ussing chamber recordings and (B) short circuit currents from polarized grown MDCK cells, showing activation of transient Cl− secretion (negative voltage deflection) by tert-butyl hydroperoxide (tBHP [tB]; 100 μM) and inhibition of tBHP-induced secretion by the TMEM16A inhibitor CaCCinhAO1 (CaCC-AO1; 20 μM). (C and D) Activation of Cl− secretion by ATP (100 μM) and inhibition of ATP-induced secretion by idebenone (Ide; 50 μM; preincubated for 15 minutes). (E and F) Activation of Cl− secretion by UTP (10 μM) and inhibition of UTP-induced secretion by Ide (50 μM). (G) Original Ussing chamber recordings and (H, I, and J) summary of short circuit currents showing the effects of ATP, UTP, and tBHP in the absence or presence of coenzyme Q10 (10 μM; preincubated for 15 minutes). Q10 attenuates the effects of ATP, UTP, and tBHP. Mean ± SEM (number of tissues measured). #Significant difference compared with control (con; P<0.05; unpaired t test).
Antioxidants Inhibit Activation of TMEM16A
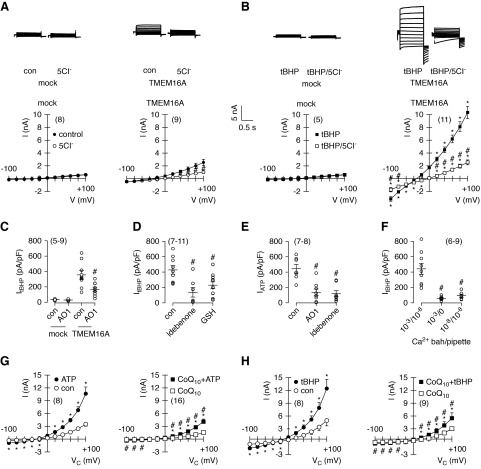
These data and previous data11 suggest that TMEM16A and TMEM16F are activated by destabilizing the plasma membrane (lipid peroxidation and phospholipase A2) and that idebenone prevents lipid peroxidation and keeps TMEM16A closed. The natural coenzyme Q10 also inhibited activation of TMEM16A by ATP, UTP, and tBHP, albeit with less potency (Figure 5, G–J). Coenzyme Q10 is rather lipophilic and has poor pharmacokinetic properties, which is the reason why idebenone is preferred in therapeutic studies.24 We directly examined the effects of idebenone on TMEM16A in patch clamp recordings. tBHP activated large Cl−-selective whole-cell currents in TMEM16A-expressing HEK293 cells but not in mock transfected cells (Figure 6, A and B). The TMEM16A inhibitor AO1, idebenone, and glutathione (included in the patch pipette) potently blocked activation of TMEM16A by tBHP, thereby providing additional evidence that TMEM16A is inhibited by blocking lipid peroxidation (Figure 6, C and D). Immediate application of idebenone shows little inhibition of TMEM16A (Supplemental Figure 4, A–C). To block activation of TMEM16A, cells need to be preincubated with idebenone for 15–30 minutes, which makes it unlikely that idebenone acts as a direct channel blocker.
Figure 6.
Reactive oxygen species–induced lipid peroxidation activates TMEM16A. (A and B) Current overlays from whole-cell patch clamp recordings in mock transfected and TMEM16A (isoform abc)–overexpressing HEK293 cells under control (con) conditions and after acute exposure to 100 μM tert-butyl hydroperoxide (tBHP). Replacement of extracellular Cl− (5Cl−) strongly inhibited outward currents, indicating activation of Cl− currents (upper panels). Corresponding current/voltage relationships for the recorded currents are shown in lower panels. (C) Summary of tBHP-induced current densities and inhibition by 10 μM CaCCinhAO1 (AO1). (D) tBHP-activated currents and inhibition by idebenone and GSH (20 mM in patch pipette). (E) ATP (100 μM) induced whole-cell currents and inhibition by AO1 or 10 μM idebenone (preincubated for 15 minutes). (F) tBHP-activated current with different Ca2+ concentrations present in bath and pipette, indicating the requirement of Ca2+ for the activation of TMEM16A by tBHP. (G and H) Coenzyme Q10 (10 μM; preincubated for 15 minutes) inhibited activation of TMEM16A whole-cell currents by ATP (100 μM) or tBHP (50 μM). Mean ± SEM (number of cells measured). *Significant inhibition by 5Cl− and AO1 (P<0.05; paired t test) and by idebenone, GSH, low Ca2+, and coenzyme Q10 (P<0.05; unpaired t test); #significant activation by ATP and tBHP (P<0.05; paired t test).
AO1 and idebenone also blocked activation of TMEM16A by ATP, whereas current activation by tBHP required the presence of Ca2+ ions (Figure 6, E and F). Lipid peroxidation by tBHP is likely to destabilize the membrane, allowing an increase in intracellular Ca2+ and activation of TMEM16A, an effect that may be inhibited by idebenone (compare below). Similar to idebenone, coenzyme Q10 also inhibited activation of TMEM16A by either ATP or tBHP (Figure 6, G and H). Because TMEM16A contains three cysteines in the pore loop structure, it was speculated that oxidization by ROS may cause activation of TMEM16A.25 This, however, does not seem to be the case, because replacement of these cysteines by alanines still allowed activation of the channel by tBHP (Supplemental Figure 4, D and E). Our data support inhibition of lipid peroxidation and membrane stabilization as the mechanism that allows idebenone to block TMEM16A.
tBHP Increases Cytosolic Ca2+ by Activation of TMEM16A, Which Is Blocked by Ferrostatin-1
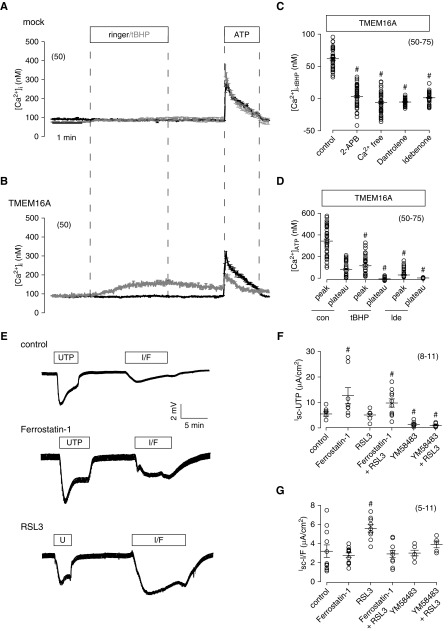
To activate TMEM16A by the lipid peroxydizer tBHP, intracellular free Ca2+ ions are required, because no activation occurred with the Ca2+ chelator EGTA (5 mM) in the patch pipette. When extracellular [Ca2+] was lowered to 10 nM, activation of TMEM16A by tBHP was also abolished, suggesting a requirement of both intra- and extracellular Ca2+ (Figure 6F). tBHP itself did not enhance intracellular Ca2+ in control (i.e., mock transfected HEK293 cells) (Figure 7A). In contrast, in the presence of TMEM16A, tBHP slowly and stably enhanced intracellular [Ca2+] to levels that are typical for agonist-induced Ca2+ plateaus (store-operated Ca2+ influx) (Figure 7B). ATP-induced Ca2+ release from endoplasmic reticulum (ER) Ca2+ store was markedly reduced by tBHP as shown by the small ATP-induced Ca2+ peak (Figure 7B). The results suggest ER Ca2+ store depletion due to activation of TMEM16A by tBHP. Indeed, release of Ca2+ from ER stores by activation of TMEM16A was shown earlier.17 When applied in the presence of 2-aminoethoxydiphenyl borate or ryanodine, both inhibitors of ER Ca2+ store release channels, tBHP no longer increased intracellular Ca2+. Moreover, inhibition of TMEM16A by idebenone or removal of extracellular Ca2+ also completely suppressed tBHP-induced Ca2+ increase (Figure 7C). Because both tBHP and idebenone suppress ATP-induced Ca2+ peak and plateau, we conclude that tBHP empties intracellular Ca2+ stores by activating TMEM16A, which subsequently induces Ca2+ influx (Figure 7D).
Figure 7.
Reactive oxygen species (ROS)/lipid peroxidation affects intracellular Ca2+ signaling and activation of Cl− secretion. (A and B) Mean Ca2+ traces from each of 50 experiments, indicating (B) a slow increase in intracellular Ca2+ concentration by tert-butyl hydroperoxide (tBHP) in TMEM16A-expressing HEK293 cells, which was not observed in mock transfected cells. Ca2+ rise in TMEM16A-expressing cells is probably due to Ca2+ store depletion, because ATP-induced Ca2+ increase was largely reduced in the presence of tBHP. (C) Summary of tBHP-induced Ca2+ rise and inhibition by IP3 receptor blocker 2-aminoethoxydiphenyl borate (2-APB; 100 μM), ryanodine receptor blocker dantrolene (10 μM), Ca2+ free extracellular buffer, and idebenone (Ide; 30 μM) in TMEM16A-expressing HEK293 cells. (D) Summary of Ca2+ rise by 100 μM ATP in TMEM16A-expressing HEK293 cells under control (con) conditions, in the presence of tBHP, and after incubation with Ide (30 μM). (E) Effects of UTP (10 μM) and IBMX/forskolin (I/F; 100/2 μM) under con conditions, in the presence of ferrostatin-1 (5 μM), or in the presence of RSL3 (1 μM). (F and G) Summary of the (F) UTP-induced or (G) I/F-induced Isc in the absence or presence of various inhibitors. YM58483 was used at 10 μM. Mean ± SEM (number of cells measured). #Significant difference compared with con (i.e., absence of inhibitors [P<0.05; ANOVA]).
Inhibition of Ferroptosis Blocks Growth of Renal Cysts
ROS-induced lipid peroxidation can lead to ferroptotic cell death due to accumulation of lethal lipid peroxides. This process can be blocked by the arylalkylamine ferrostatin-1.26 Interestingly, ferrostatin-1 enhanced UTP-induced voltage deflection. It is speculated that reduced lipid peroxidation inactivates ER leakage channels, which enhance ER store filling (Figure 7E).27 In contrast, RSL3, which inhibits GPX4 (the essential enzyme to reduce oxidized PUFA), slightly reduced UTP-induced voltage deflection (Figure 7, E and F).28 RSL3 augmented CFTR-dependent Cl− secretion activated by IBMX and forskolin, possibly by enhancing activity of Ca2+-sensitive adenylate cyclase (Figure 7, E–G).29 Thus, lipid peroxidation activates TMEM16A, augments Ca2+ store release, and activates store-operated Ca2+ entry (SOCE), which supports activation of CFTR.18,30,31 In line with that, the SOCE/ORAI1 inhibitor YM58483 abolished activation of CFTR by RSL3 and largely reduced UTP-activated transport (Figure 7G).
TMEM16A Is a Target in Ferroptosis
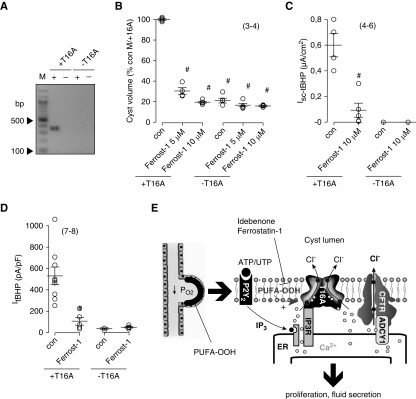
Cyst development and effects of ferrostatin-1 were examined in two MDCK clones, which either express TMEM16A (M/+T16A) or do not express TMEM16A (M/−T16A; compare with Methods) (Figure 8A). Cysts grown from M/−T16A cells were remarkably smaller compared with M/+T16A cysts, emphasizing the importance of TMEM16A for cyst growth. Moreover, although M/+T16A cyst growth was largely inhibited by ferrostatin-1, no effects of ferrostatin-1 were observed on M/−T16A cysts (Figure 8B). Ussing chamber experiments with M/+T16A monolayers showed Cl− secretion activated by tBHP that was fully inhibited by ferrostatin-1. In contrast, in M/–T16A cells, tBHP did not induce Cl− secretion, and ferrostatin-1 had no effects (Figure 8C). In patch clamp experiments with HEK293 cells overexpressing TMEM16A, ferrostatin-1 strongly suppressed activation of TMEM16A by tBHP (Figure 8D). In contrast, no whole-cell currents were activated by tBHP, and no effects of ferrostatin-1 were observed in mock transfected cells (Figure 8D). Additional experiments performed in MDCK cells with stable knockdown of TMEM16A or CFTR indicated that both TMEM16A and CFTR are essential for Ca2+-activated Cl− secretion (Supplemental Figure 5).31,32
Figure 8.
Ferrostatin-1 (Ferrost-1) inhibits growth of MDCK cysts and Cl− secretion only in the presence of TMEM16A. (A) RT-PCR analysis of TMEM16A in two different MDCK clones shows expression in M/+T16A cells but not in M/−T16A cells (compare with Methods). M indicates marker, and + and − indicate reaction in the presence or absence of reverse transcription, respectively. (B) Cyst volume relative to control (con) cyst volume of M/+T16A cells (expressing TMEM16A). M/−T16A cells (not expressing TMEM16A) produced significantly smaller cysts than M/+T16A cells. Cyst growth (volume) was inhibited by either 5 or 10 μM Ferrost-1 in M/+T16A cells but not in M/−T16A cells. C shows that tert-butyl hydroperoxide (tBHP) activated a transient negative voltage deflection (i.e., Cl− secretion only in M/+T16A but not in M/−T16A cells). tBHP-induced Cl− secretion was inhibited by Ferrost-1 in M/+T16A cells. (D) Ferrost-1 inhibited whole-cell currents activated by tBHP in TMEM16A-overexpressing HEK293 cells. No effects were seen in mock transfected cells. (E) Model for cyst expansion by Cl− secretion. Activation of TMEM16A through lipid peroxidation facilitates endoplasmic reticulum (ER) Ca2+ store release. Ca2+ activates Cl− secretion by TMEM16A, and it stimulates Ca2+-sensitive adenylate cyclase Ca2+-regulated adenylate cyclase 1 (ADCY1), which further stimulated cystic fibrosis transmembrane conductance regulator–dependent secretion. Mean ± SEM (number of cells measured). #Significant difference compared with con (i.e., absence of Ferrost-1 [P<0.05; ANOVA; B] and unpaired t test [C–E]).
To confirm the effect of ferrostain-1 on lipid peroxidation, ROS formation in MDCK cysts was detected using H2DCFDA fluorescence under control and tBHP (100 μM) in the presence of 10 μM ferrostatin-1. In control cysts, ferrostatin-1 reduced basal ROS production significantly by 30% (H2DCFDA staining control: 100%±7.46%; in the presence of ferrostatin-1: 70.02%±2.57% [n=3]). Treatment of MDCK cysts with tBHP increased ROS production significantly to 148.68%±7.18% (n=3), whereas ferrostin-1 significantly inhibited tBHP-induced ROS production to 64.89%±3.74% (n=3). In summary, our results show that peroxidation of membrane phospholipids in PKD activates TMEM16A. Activation of TMEM16A supports proliferation of the cyst epithelium as well as fluid secretion into the cyst lumen. Antioxidants, such as idebenone and derivatives of ferrostatin-1, may be promising new pharmacologic tools to delay cyst expansion (Figure 8E).
Discussion
We show pronounced lipid peroxidation in polycystic kidneys, which is in line with recent clinical studies showing oxidative stress in ADPKD.33,34 Lipid peroxidation takes place at elevated ROS levels, which may be in part due to a mitochondrial dysfunction in PKD.35 Our data suggest lipid peroxidation particularly within the cyst epithelium, which could also be explained by low oxygen pressure in the cyst lumen. We show pronounced activation of TMEM16A by lipid peroxidation. Importantly, TMEM16A is only sparsely expressed in proximal tubule and intercalated cells of normal kidney; however, expression of both TMEM16A and P2Y2 receptors is upregulated during hypoxia and in ADPKD,1,16,36 whereas purinergic signaling is enhanced in the cyst lumen.37
Antioxidant compounds, such as idebenone and the ferroptosis inhibitor ferrostatin-1, inhibited TMEM16A and thereby, attenuated Cl− secretion into the cyst lumen. Our data suggest that inhibition of TMEM16A by idebenone is likely to occur by antagonizing lipid peroxidation and stabilization of the plasma membrane rather than direct inhibition of TMEM16A.21 In line with this, acute application of idebenone did not inhibit TMEM16A in our hands. We had to preincubate the cells for 15–30 minutes to detect inhibition of TMEM16A by idebenone. Moreover, other ROS scavengers, such as glutathione and the natural mother compound coenzyme compound Q10, also inhibited activation of TMEM16A. Nevertheless, it is entirely possible that idebenone, which is a rather lipophilic compound similar to other TMEM16A blockers, also inhibits TMEM16A by affecting the biophysical properties of the plasma membrane.11
We showed earlier that Ca2+ store release is augmented in the presence of TMEM16A.18 Store release activates SOCE to maintain Cl− secretion.30 Although Ca2+ is essential for Cl− secretion, most of the Cl− transport in renal, airway, and intestinal epithelial cells arises from secretion by CFTR.30,31 Thus, CFTR is the important secretory Cl− channel that is regulated by TMEM16A.31,32 A pronounced overlap of intracellular Ca2+ and cAMP signaling exists due to exchange protein directly activated by cAMP (Epac) and Ca2+-regulated adenylate cyclase 1/soluble adenylate cyclase.31,38,39 Apart from activating CFTR and fluid secretion, TMEM16A has a strong proproliferative effect as shown in many tissues and particularly, dedifferentiated cancer cells.9,10,40–42 Histone deacetylase regulates TMEM16A expression, and histone deacetylase inhibitors were shown to inhibit TMEM16A expression, cell proliferation, and cyst growth by decreasing intracellular Ca2+ and cAMP levels.10,41–43 Thus, inhibition of TMEM16A by antioxidants and inhibitors of lipid peroxidation is a promising novel therapeutic approach to delaying cyst development in PKD. Along this line, the synthetic homolog of coenzyme Q10, idebenone, has been used successfully in Duchenne muscular dystrophy, Leber hereditary optic neuropathy, Friedreich ataxia, and Alzheimer disease.20,44–46 Nevertheless, the functional data shown here were obtained exclusively in vitro/ex vivo; this asks for additional interventional drug studies in PKD1 knockout mice in vivo before clinical trials with inhibitors of lipid peroxidation and TMEM16A, respectively, can be tested in patients as a potential treatment for ADPKD.
In this study, ferrostatin-1 was used with the intention to inhibit ferroptosis, because both TMEM16A and TMEM16F can be activated through ROS-mediated lipid peroxidation; additionally, for both, a role in ADPKD has been suggested.2,8,11. Lipid peroxidation and membrane destabilization seem to increase accessibility of Ca2+ ions to their binding sites within TMEM16A and TMEM16F. How lipid peroxidation/ferroptosis causes cell death is actually unclear.47 Our previous data suggested a role of TMEM16F in cell death and ferroptosis when expressed at higher levels, like in the center of growing cysts.8 In contrast, in the cyst epithelium, expression of TMEM16A dominates, which is well known to support cell proliferation and development of cancer.2,9,48 We speculate that lipid peroxidation might have antagonistic effects (i.e., it may induce proliferation or regulated cell death) depending on the location of TMEM16A and TMEM16F within the cystic kidney.
Disclosures
None.
Supplementary Material
Acknowledgments
We thank Barbara Teschemacher and Wajima Safi for their excellent support.
This work was supported by Deutsche Forschungsgemeinschaft (DFG) grant SFB699-A7/A12, DFG grant KU756/12-1, DFG grant SCHR752/3-1, and United Kingdom Cystic Fibrosis Trust grant SRC013. B.B. was supported by Interdisciplinary Center for Clinical Research (IZKF) Erlangen project F5. J.S. was supported by a thesis scholarship from the IZKF Erlangen.
This work was performed by J.S. in fulfillment of the requirements for obtaining the degree Dr Med.
Footnotes
Published online ahead of print. Publication date available at www.jasn.org.
Supplemental Material
This article contains the following supplemental material online at http://jasn.asnjournals.org/lookup/suppl/doi:10.1681/ASN.2018010039/-/DCSupplemental.
Supplemental Figure 1. Lipid peroxidation in kidneys from human and mouse ADPKD; 4-hydroxy-2-nonenal (4HNE) staining indicates largely enhanced lipid peroxidation in renal cyst lining epithelium of (A) human ADPKD, (B) mouse PKD1 knockout, and (C) mouse PKD2 knockout.
Supplemental Figure 2. ROS-dependent cyst growth. (A) Growth of MDCK cysts in 3-D matrigel cultures under control conditions (con) or in the presence of different concentrations of the antioxidant compound idebenone or hydrogen peroxide (H2O2), respectively. (B) Analysis of cyst size relative to the size under control conditions.
Supplemental Figure 3. Inhibition of halide conductance by idebenone. (A) Detection of reactive oxygen species (ROS) induced by tert-butyl hydroperoxide (tBHP; 100 μM) using MAK142 fluorescence in HEK293 cells stably expressing YFP and TMEM16A. Green fluorescence, YFPexpression. DIC, differential interference contrast. (B) Concentration response for the effect of ATP on YFP-quenching by activation of I-uptake. (C) Summary for the effects of ATP (5 μM) on YFP-quenching and inhibition of quenching by the TMEM16A-blockers CaCCinhAO1 (AO1, 20 μM) and tannic acid (TA, 20 μM). (D and E) Inhibition of ATP-induced YFP-quenching by different concentrations of idebenone.
Supplemental Figure 4. Activation and inhibition of TMEM16A. (A) Continuous whole cell current recordings (clamp voltages ± 100 mV for 1s) showing activation of TMEM16A by purinergic stimulation with ATP (100 μM). (B) Activation of TMEM16A by ATP was not inhibited by acute application of idebenone (50 μM). (C) Activation of TMEM16A was inhibited by 5 min preincubation of the cell with idebenone. (D) TMEM16A activated by tBHP (100 μM) was not further activated by additional stimulation with ATP (100 μM). (E) A TMEM16A mutant in which three cysteines in the putative poreforming domain were replaced by alanines (TMEM16A-C647/652/657A) was still activated by tBHP or tBHP/ATP. (F) Lipid peroxidation (4HNE positivity, red) was similar in the absence or presence of TMEM16A-EGFP (green). TMEM16A itself did not activate lipid peroxidation.
Supplemental Figure 5. Loss of Cl− secretion by knockdown of TMEM16A or CFTR. (A) RT-PCR from MDCK clones (MDCK-C7, M/+16A cells) after stable sh-RNA-knockdown of TMEM16A or CFTR, or treatment with scrambled RNA, respectively. (B) Analysis from semiquantitative RT-PCR indicating knockdown of TMEM16A (T16A) and CFTR, respectively. (C) Western blot of CFTR indicating knockdown by shRNAs. (D and E) Summary of short circuit currents assessed in Ussing chamber recordings. Knockdown of both TMEM16A and CFTR eliminated Ca2+ activated Cl− secretion induced by stimulation with ATP or UTP (both 100 μM).
References
- 1.Buchholz B, Schley G, Faria D, Kroening S, Willam C, Schreiber R, et al.: Hypoxia-inducible factor-1α causes renal cyst expansion through calcium-activated chloride secretion. J Am Soc Nephrol 25: 465–474, 2014 [DOI] [PMC free article] [PubMed] [Google Scholar]
- 2.Buchholz B, Faria D, Schley G, Schreiber R, Eckardt KU, Kunzelmann K: Anoctamin 1 induces calcium-activated chloride secretion and proliferation of renal cyst-forming epithelial cells. Kidney Int 85: 1058–1067, 2014 [DOI] [PubMed] [Google Scholar]
- 3.Jeulin C, Guadagnini R, Marano F: Oxidant stress stimulates Ca2+-activated chloride channels in the apical activated membrane of cultured nonciliated human nasal epithelial cells. Am J Physiol Lung Cell Mol Physiol 289: L636–L646, 2005 [DOI] [PubMed] [Google Scholar]
- 4.Simões F, Ousingsawat J, Wanitchakool P, Fonseca A, Cabrita I, Benedetto R, et al.: CFTR supports cell death through ROS-dependent activation of TMEM16F (anoctamin 6). Pflugers Arch 470: 305–314, 2018 [DOI] [PubMed] [Google Scholar]
- 5.Ousingsawat J, Wanitchakool P, Kmit A, Romao AM, Jantarajit W, Schreiber S, et al.: Anoctamin 6 mediates effects essential for innate immunity downstream of P2X7 receptors in macrophages. Nat Commun. 6: 6245, 2015 [DOI] [PubMed] [Google Scholar]
- 6.Martins JR, Faria D, Kongsuphol P, Reisch B, Schreiber R, Kunzelmann K: Anoctamin 6 is an essential component of the outwardly rectifying chloride channel. Proc Natl Acad Sci U S A 108: 18168–18172, 2011 [DOI] [PMC free article] [PubMed] [Google Scholar]
- 7.Sirianant L, Ousingsawat J, Wanitchakool P, Schreiber R, Kunzelmann K: Cellular volume regulation by anoctamin 6: Ca2+, phospholipase A2 and osmosensing. Pflugers Arch 468: 335–349, 2016 [DOI] [PubMed] [Google Scholar]
- 8.Forschbach V, Goppelt-Struebe M, Kunzelmann K, Schreiber R, Piedagnel R, Kraus A, et al.: Anoctamin 6 is localized in the primary cilium of renal tubular cells and is involved in apoptosis-dependent cyst lumen formation. Cell Death Dis 6: e1899, 2015 [DOI] [PMC free article] [PubMed] [Google Scholar]
- 9.Duvvuri U, Shiwarski DJ, Xiao D, Bertrand C, Huang X, Edinger RS, et al.: TMEM16A induces MAPK and contributes directly to tumorigenesis and cancer progression. Cancer Res 72: 3270–3281, 2012 [DOI] [PMC free article] [PubMed] [Google Scholar]
- 10.Wanitchakool P, Wolf L, Koehl GE, Sirianant L, Schreiber R, Kulkarni S, et al.: Role of anoctamins in cancer and apoptosis. Philos Trans R Soc Lond B Biol Sci 369: 20130096, 2014 [DOI] [PMC free article] [PubMed] [Google Scholar]
- 11.Schreiber R, Ousingsawat J, Wanitchakool P, Sirianant L, Benedetto R, Reiss K, et al.: Regulation of TMEM16A/ANO1 and TMEM16F/ANO6 ion currents and phospholipid scrambling by Ca2+ and plasma membrane lipid. J Physiol 596: 217–229, 2018 [DOI] [PMC free article] [PubMed] [Google Scholar]
- 12.Buchholz B, Teschemacher B, Schley G, Schillers H, Eckardt KU: Formation of cysts by principal-like MDCK cells depends on the synergy of cAMP- and ATP-mediated fluid secretion. J Mol Med (Berl) 89: 251–261, 2011 [DOI] [PubMed] [Google Scholar]
- 13.Lang F, Paulmichl M: Properties and regulation of ion channels in MDCK cells. Kidney Int 48: 1200–1205, 1995 [DOI] [PubMed] [Google Scholar]
- 14.Lantinga-van Leeuwen IS, Leonhard WN, van de Wal A, Breuning MH, Verbeek S, de Heer E, et al.: Transgenic mice expressing tamoxifen-inducible Cre for somatic gene modification in renal epithelial cells. Genesis 44: 225–232, 2006 [DOI] [PubMed] [Google Scholar]
- 15.Schley G, Klanke B, Schödel J, Forstreuter F, Shukla D, Kurtz A, et al.: Hypoxia-inducible transcription factors stabilization in the thick ascending limb protects against ischemic acute kidney injury. J Am Soc Nephrol 22: 2004–2015, 2011 [DOI] [PMC free article] [PubMed] [Google Scholar]
- 16.Faria D, Rock JR, Romao AM, Schweda F, Bandulik S, Witzgall R, et al.: The calcium-activated chloride channel Anoctamin 1 contributes to the regulation of renal function. Kidney Int 85: 1369–1381, 2014 [DOI] [PubMed] [Google Scholar]
- 17.Schreiber R, Uliyakina I, Kongsuphol P, Warth R, Mirza M, Martins JR, et al.: Expression and function of epithelial anoctamins. J Biol Chem 285: 7838–7845, 2010 [DOI] [PMC free article] [PubMed] [Google Scholar]
- 18.Cabrita I, Benedetto R, Fonseca A, Wanitchakool P, Sirianant L, Skryabin BV, et al.: Differential effects of anoctamins on intracellular calcium signals. FASEB J 31: 2123–2134, 2017 [DOI] [PubMed] [Google Scholar]
- 19.De La Fuente R, Namkung W, Mills A, Verkman AS: Small-molecule screen identifies inhibitors of a human intestinal calcium-activated chloride channel. Mol Pharmacol 73: 758–768, 2008 [DOI] [PubMed] [Google Scholar]
- 20.Parkinson MH, Schulz JB, Giunti P: Co-enzyme Q10 and idebenone use in Friedreich’s ataxia. J Neurochem 126[Suppl 1]: 125–141, 2013 [DOI] [PubMed] [Google Scholar]
- 21.Mancuso M, Orsucci D, Volpi L, Calsolaro V, Siciliano G: Coenzyme Q10 in neuromuscular and neurodegenerative disorders. Curr Drug Targets 11: 111–121, 2010 [DOI] [PubMed] [Google Scholar]
- 22.Seo Y, Park J, Kim M, Lee HK, Kim JH, Jeong JH, et al.: Inhibition of ANO1/TMEM16A chloride channel by idebenone and its cytotoxicity to cancer cell lines. PLoS One 10: e0133656, 2015 [DOI] [PMC free article] [PubMed] [Google Scholar]
- 23.Ma T, Thiagarajah JR, Yang H, Sonawane ND, Folli C, Galietta LJ, et al.: Thiazolidinone CFTR inhibitor identified by high-throughput screening blocks cholera toxin-induced intestinal fluid secretion. J Clin Invest 110: 1651–1658, 2002 [DOI] [PMC free article] [PubMed] [Google Scholar]
- 24.Gueven N, Woolley K, Smith J: Border between natural product and drug: Comparison of the related benzoquinones idebenone and coenzyme Q10. Redox Biol 4: 289–295, 2015 [DOI] [PMC free article] [PubMed] [Google Scholar]
- 25.Yang YD, Cho H, Koo JY, Tak MH, Cho Y, Shim WS, et al.: TMEM16A confers receptor-activated calcium-dependent chloride conductance. Nature 455: 1210–1215, 2008 [DOI] [PubMed] [Google Scholar]
- 26.Dixon SJ, Lemberg KM, Lamprecht MR, Skouta R, Zaitsev EM, Gleason CE, et al.: Ferroptosis: An iron-dependent form of nonapoptotic cell death. Cell 149: 1060–1072, 2012 [DOI] [PMC free article] [PubMed] [Google Scholar]
- 27.Racay P, Kaplán P, Mézesová V, Lehotský J: Lipid peroxidation both inhibits Ca(2+)-ATPase and increases Ca2+ permeability of endoplasmic reticulum membrane. Biochem Mol Biol Int 41: 647–655, 1997 [DOI] [PubMed] [Google Scholar]
- 28.Stockwell BR, Friedmann Angeli JP, Bayir H, Bush AI, Conrad M, Dixon SJ, et al.: Ferroptosis: A regulated cell death nexus linking metabolism, redox biology, and disease. Cell 171: 273–285, 2017 [DOI] [PMC free article] [PubMed] [Google Scholar]
- 29.Cowley EA, Linsdell P: Oxidant stress stimulates anion secretion from the human airway epithelial cell line Calu-3: Implications for cystic fibrosis lung disease. J Physiol 543: 201–209, 2002 [DOI] [PMC free article] [PubMed] [Google Scholar]
- 30.Concepcion AR, Vaeth M, Wagner LE 2nd, Eckstein M, Hecht L, Yang J, et al.: Store-operated Ca2+ entry regulates Ca2+-activated chloride channels and eccrine sweat gland function. J Clin Invest 126: 4303–4318, 2016 [DOI] [PMC free article] [PubMed] [Google Scholar]
- 31.Benedetto R, Ousingsawat J, Wanitchakool P, Zhang Y, Holtzman MJ, Amaral M, et al.: Epithelial chloride transport by CFTR requires TMEM16A. Sci Rep 7: 12397, 2017 [DOI] [PMC free article] [PubMed] [Google Scholar]
- 32.Billet A, Hanrahan JW: The secret life of CFTR as a calcium-activated chloride channel. J Physiol 591: 5273–5278, 2013 [DOI] [PMC free article] [PubMed] [Google Scholar]
- 33.Menon V, Rudym D, Chandra P, Miskulin D, Perrone R, Sarnak M: Inflammation, oxidative stress, and insulin resistance in polycystic kidney disease. Clin J Am Soc Nephrol 6: 7–13, 2011 [DOI] [PMC free article] [PubMed] [Google Scholar]
- 34.Klawitter J, Reed-Gitomer BY, McFann K, Pennington A, Klawitter J, Abebe KZ, et al.: Endothelial dysfunction and oxidative stress in polycystic kidney disease. Am J Physiol Renal Physiol 307: F1198–F1206, 2014 [DOI] [PMC free article] [PubMed] [Google Scholar]
- 35.Ishimoto Y, Inagi R, Yoshihara D, Kugita M, Nagao S, Shimizu A, et al.: Mitochondrial abnormality facilitates cyst formation in autosomal dominant polycystic kidney disease [published online ahead of print October 9, 2017]. Mol Cell Biol doi: 10.1128/MCB.00337-17 [DOI] [PMC free article] [PubMed] [Google Scholar]
- 36.Kraus A, Grampp S, Goppelt-Struebe M, Schreiber R, Kunzelmann K, Peters DJ, et al.: P2Y2R is a direct target of HIF-1α and mediates secretion-dependent cyst growth of renal cyst-forming epithelial cells. Purinergic Signal 12: 687–695, 2016 [DOI] [PMC free article] [PubMed] [Google Scholar]
- 37.Hovater MB, Olteanu D, Welty EA, Schwiebert EM: Purinergic signaling in the lumen of a normal nephron and in remodeled PKD encapsulated cysts. Purinergic Signal 4: 109–124, 2008 [DOI] [PMC free article] [PubMed] [Google Scholar]
- 38.Ivonnet P, Salathe M, Conner GE: Hydrogen peroxide stimulation of CFTR reveals an Epac-mediated, soluble AC-dependent cAMP amplification pathway common to GPCR signalling. Br J Pharmacol 172: 173–184, 2015 [DOI] [PMC free article] [PubMed] [Google Scholar]
- 39.Lérias J, Pinto M, Benedetto R, Schreiber R, Amaral M, Aureli M, et al.: Compartmentalized crosstalk of CFTR and TMEM16A (ANO1) through EPAC1 and ADCY1. Cell Signal 44: 10–19, 2018 [DOI] [PubMed] [Google Scholar]
- 40.Pedemonte N, Galietta LJ: Structure and function of TMEM16 proteins (anoctamins). Physiol Rev 94: 419–459, 2014 [DOI] [PubMed] [Google Scholar]
- 41.Matsuba S, Niwa S, Muraki K, Kanatsuka S, Nakazono Y, Hatano N: Downregulation of Ca2+-activated Cl- channel TMEM16A by the inhibition of histone deacetylase in TMEM16A-expressing cancer cells. J Pharmacol Exp Ther 351: 510–518, 2014 [DOI] [PubMed] [Google Scholar]
- 42.Yanda MK, Liu Q, Cebotaru V, Guggino WB, Cebotaru L: Histone deacetylase 6 inhibition reduces cysts by decreasing cAMP and Ca2+ in knock-out mouse models of polycystic kidney disease. J Biol Chem 292: 17897–17908, 2017 [DOI] [PMC free article] [PubMed] [Google Scholar]
- 43.Cebotaru L, Liu Q, Yanda MK, Boinot C, Outeda P, Huso DL, et al.: Inhibition of histone deacetylase 6 activity reduces cyst growth in polycystic kidney disease. Kidney Int 90: 90–99, 2016 [DOI] [PMC free article] [PubMed] [Google Scholar]
- 44.Buyse GM, Voit T, Schara U, Straathof CSM, D’Angelo MG, Bernert G, et al.; DELOS Study Group: Efficacy of idebenone on respiratory function in patients with Duchenne muscular dystrophy not using glucocorticoids (DELOS): A double-blind randomised placebo-controlled phase 3 trial. Lancet 385: 1748–1757, 2015 [DOI] [PubMed] [Google Scholar]
- 45.Lyseng-Williamson KA: Idebenone: A review in leber’s hereditary optic neuropathy. Drugs 76: 805–813, 2016 [DOI] [PubMed] [Google Scholar]
- 46.Senin U, Parnetti L, Barbagallo-Sangiorgi G, Bartorelli L, Bocola V, Capurso A, et al.: Idebenone in senile dementia of Alzheimer type: A multicentre study. Arch Gerontol Geriatr 15: 249–260, 1992 [DOI] [PubMed] [Google Scholar]
- 47.Feng H, Stockwell BR: Unsolved mysteries: How does lipid peroxidation cause ferroptosis? PLoS Biol 16: e2006203, 2018 [DOI] [PMC free article] [PubMed] [Google Scholar]
- 48.Ruiz C, Martins JR, Rudin F, Schneider S, Dietsche T, Fischer CA, et al.: Enhanced expression of ANO1 in head and neck squamous cell carcinoma causes cell migration and correlates with poor prognosis. PLoS One 7: e43265, 2012 [DOI] [PMC free article] [PubMed] [Google Scholar]
Associated Data
This section collects any data citations, data availability statements, or supplementary materials included in this article.


