

Abstract
Cell doubling times of the purple bacterium Rhodobacter sphaeroides during photosynthetic growth are determined experimentally and computationally as a function of illumination. For this purpose, energy conversion processes in an intracytoplasmic membrane vesicle, the chromatophore, are described based on an atomic detail structural model. The cell doubling time and its illumination dependence are computed in terms of the return-on-investment (ROI) time of the chromatophore, determined computationally from the ATP production rate, and the mass ratio of chromatophores in the cell, determined experimentally from whole cell absorbance spectra. The ROI time is defined as the time it takes to produce enough ATP to pay for the construction of another chromatophore. The ROI time of the low light-growth chromatophore is 4.5–2.6 hours for a typical illumination range of 10–100 μmol photons m−2 s−1, respectively, with corresponding cell doubling times of 8.2–3.9 hours. When energy expenditure is considered as a currency, the benefit-to-cost ratio computed for the chromatophore as an energy harvesting device is 2–8 times greater than for photovoltaic and fossil fuel based energy solutions, whereas the corresponding ROI times are approximately 3–4 orders of magnitude shorter for the chromatophore than for synthetic systems.
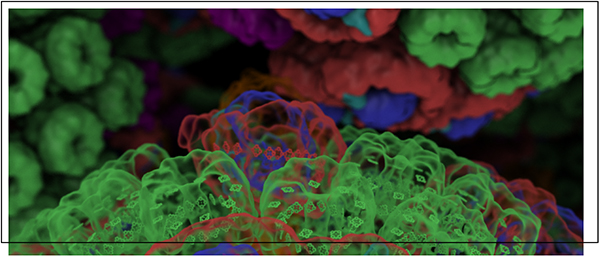
Graphical Abstract
Introduction
Photosynthesis is a universal source of energy for life on Earth, spanning a wide range of time and length scales in its fundamental processes.1 Bioenergetic processes in photosynthesis, ubiquitous across bacteria and plants, range in scale from electronic excitation migration (picoseconds)2–6 to organelle-scale diffusion of charge carriers7–9 and ATP synthesis10,11 (milliseconds) to adaptive response of protein composition to changing environmental conditions at the cell level (hours).12,13 These disparate length and time scales require a multitude of experimental and theoretical approaches for determining structure and function at atomic, supra-molecular, organelle, and cell levels of organization.
It is a persistent challenge to derive the emerging properties at higher organizational levels, such as for organelles and cells, from observed and computed properties determined at atomic and molecular detail. For a photosynthetic system, these emergent properties include the rate and overall efficiency of energy conversion into ATP.14 Such properties constitute performance metrics for comparison with different species as well as with synthetic systems;15 provide guidelines for the bioengineering of efficient crops and rational design of bio-inspired solar energy solutions;16 and relate the efficiency of a photosynthetic apparatus to its structural complexity17 and its evolutionary lineage.18 Purple bacteria considered in this study are reported to be the earliest emerging photosynthetic lineage.18
Determining a cell-scale observable directly from an atomic detail description within a single computational framework is prohibitive. For example, molecular dynamics currently permits simulation sizes of 108–109 atoms and timescales, for large simulations, of microseconds.19 Cell scale events, such as cell reproduction considered in this manuscript for a photosynthetic bacterium, require a further 3–4 orders of magnitude in simulation size and 8–10 orders of magnitude in timescale beyond what is currently reachable. Therefore, a cellular process that spans many length and time scales needs to be described via an integrative model that employs separate formulations for each subprocess such that the output of one subprocess is used as an input for the next in ascending order of scale.
An integrative model was employed in Ref.14 to describe photosynthetic energy conversion in the chromatophore, the primary photosynthetic unit in the purple bacterium Rhodobacter (Rba.) sphaeroides. The chromatophore is an intracytoplasmic membrane vesicle of 60 nm diameter20 comprising over a hundred cooperating proteins21–25 for performing ATP synthesis (Fig. 1). The rate and efficiency of ATP production in the chromatophore as a function of illumination are determined14 based on an atomic detail structural model23 in a three stage formulation involving excitation energy transfer, the cycle of charge carriers between proteins, and ATP synthesis, each stage providing necessary input for the next as summarized in the Methods section. This formulation revealed that the chromatophore produces ATP efficiently under illumination conditions typical of purple bacterial habitat (< 100 μmol photons m−2 s−1), while a saturation in ATP turnover is observed at higher illuminations.14 Furthermore, the ATP production rate is seen to be not optimized with respect to vesicle composition under steady state illumination. The evolutionary pressures that shape vesicle composition appear to favor damage avoidance and robustness26 under environmental strain over the optimality of performance under ideal conditions.14
Figure 1:

Organization of the photosynthetic apparatus of Rba. sphaeroides. (A) Under low light conditions the bacterium displays a dense packing of chromatophore vesicles20 as seen in this tomography images from Ref.29 (B) The atomic detail structural model of the low light-adapted chromatophore14 shown contains 63 LH2 complexes (green), 11 dimeric and 2 monomeric RC-LH1-PufX complexes (LH1:red; RC:blue; PufX:lime), 4 cytochrome bc1 dimers (magenta), and 2 ATP synthases (orange), shown in surface representation; bacteriochlorophylls are represented by their porphyrin rings. (C) Energy transfer and conversion processes in the chromatophore include excitation transfer, diffusion of the charge carriers, cytochrome c2 and quinone, generation of a proton gradient, and ATP synthesis.
The ATP production rate determined computationally makes it possible to evaluate the performance of the chromatophore as a light harvesting device under different illumination conditions. For this purpose, we introduce below the quantity of return-on-investment (ROI) time, defined as the time in which the chromatophore produces enough ATP, viewed as a currency in bioenergetic processes, to pay for the construction of another chromatophore. The concept of ROI, considered typically as integrated over the expected lifetime of a device and expressed as a benefit-to-cost ratio, is widely used as a performance measure in human decision making in areas ranging from industrial energy efficiency27 to environmental conservation efforts.28 It is natural to expect that a similar optimization criterion have influenced the fitness landscape that governs the evolution of terrestrial lifeforms.
The aim of the present study is to determine a cell scale observable, namely the doubling time of the purple bacterium Rba. sphaeroides, by direct experimental observation as well as by computation from the aforementioned structural and functional model of ATP production. The organization of this manuscript is as follows: the computation of ATP production rate in the chromatophore as a function of light intensity and stoichiometry is summarized as reported in Ref.;14 the corresponding ROI time is introduced and, in particular, expressed for a vesicle illuminated at the same light intensity as its growth condition in order to model constant illumination growth experiments considered herein; the growth of Rba. sphaeroides, observed at different light intensities, is used to determine the cell doubling time for a direct comparison with computed values and for estimating the ratio of chromatophore content in the cell; the use of ROI as a performance metric as well as the accuracy and limitations of the current framework for estimating cell doubling times are discussed.
Methods
In the following, computationally determined energy conversion processes are related to experimentally observed cell growth kinetics, as a function of light intensity. For this purpose, the ATP production rate, computed in Ref.14 based on an atomic detail structural model of the chromatophore, is employed to determine the ROI time, τROI. Experimental observations are presented for the growth of Rba. sphaeroides at different light intensities, which is used to determine the cell doubling time during the exponential phase. The chromatophore count per cell at each light intensity is determined by spectroscopic quantification of bacteriochlorophyll (BChl) concentrations, permitting the estimation of the mass ratio of chromatophores in the cell, ηchrom. The ROI time τROI and the mass ratio of chromatophores ηchrom are used to estimate the time for the entire cell to pay the energy cost of producing another cell, accounting for base metabolism. The time for the cell to reproduce, thus computed, is compared to the observed cell doubling time as a function of illumination.
ATP production rate of the chromatophore
The ATP production rate kATP(I) of the chromatophore at steady-state illumination I is reported in Refs.14,23 Below, a summary is provided for the energy conversion processes, which are divided into three stages: (i) excitation energy transfer and the formation of quinols; (ii) diffusion of charge carriers; (iii) ATP synthesis.
The first stage of energy conversion, namely, excitation energy transfer in the pigment network of the chromatophore, was described in Ref.14 using a generalized Förster formalism30–33 based on Refs.17,21,22 Excitations of LH1 and LH2 BChls form delocalized exciton states34,35 that are transferred coherently36,37 between complexes. The BChl exciton states of a complex J are the eigenstates of the effective Hamiltonian17
| (1) |
which is related to the geometry of the pigment network via the excitonic couplings between pigments i and j of complex J computed in Ref.;14 |i〉 corresponds to the Qy excited state of BChl i; J label one of 63 LH2s, 24 LH1s, and 24 RC complexes shown in Fig. 1B.
The quantum yield q is defined as the probability with which the absorption of a photon by any pigment of the chromatophore results in charge separation at any RC ready for excitation-induced electron transfer to a quinone or semiquinone. The quantum yield defined this way is independent of light intensity and is solely determined by the pigment geometry, given by14
| (2) |
where P(0) denotes the state corresponding to an equal likelihood of initial excitation for all BChls; kCS is the charge separation rate at the RC; the rate matrix is defined as
| (3) |
where kJK is the rate of excitation transfer between a donor complex J and an acceptor complex K computed in Ref.14 according to generalized Förster theory,30–33 following the assumption of Boltzmann-populated exciton states;36,38 kdiss and kCS are dissipation and charge separation rates, respectively; δJ,RC equals 1 when J denotes a RC complex and 0 otherwise. The quantum yield q for the low light-growth vesicle shown in Fig. 1B computed according to Eq. (2) is 0.91.14
The rate of quinol formation at the RC can be expressed in terms of the quantum yield q by
| (4) |
where pRC(I) is the probability for the RC to hold a quinone Q or a semiquinone QH ready to accept an electron; the prefactor accounts for every quinol requiring two electron transfer events at the RC; I is the absorbed light power given in units of photons absorbed by the chromatophore per second,14 i.e., I = Φ σtotal, where Φ is the flux of useable photons and σtotal is the total absorption cross-section of the chromatophore determined via the functional absorption cross-section reported in Ref.12
The probability pRC(I) is estimated in Ref.14 for the steady-state condition as
| (5) |
where nRC is the number of RCs and τRC(I) is the so-called cycling time, namely, the mean time needed for a RC to become available for binding a new Q after it had accepted the previous Q.39 The cycling time for quinol turnover τRC(I) is a rate limiting quantity for the energy conversion in the chromatophore14 as suggested by earlier studies.8,9
The second stage of energy conversion, namely, diffusion of charge carriers and the turnover of quinols at the cytochrome bc1 complex (cytbc1), was described in Ref.14 heuristically in terms of experimental observations12,40 of the cycling time τRC(I) at the low light and high light limits. The cycling time was estimated as an interpolation between low light and high light values as14
| (6) |
where τL = 3 ms is the low light limit12,40 and τH = (nRC/nB) τB is the high light limit; nB is the number of cytbc1 dimers (nB = 4, for the vesicle shown in Fig. 1B); τB = 25 ms is the quinol turnover time at a cytbc1;41 and denotes the total turnover capacity of cytbc1s.14
The third stage of energy conversion, namely ATP synthesis, was described in Ref14 under the steady state assumption by observing that . Here, a 12-subunit c-ring is assumed for the ATP synthase that consequently produces one ATP molecule from four protons; coincidentally, this is the same number of net protons released into the vesicle interior for each quinol→quinone turnover at the cytbc1 complex.41 Therefore, the ATP production rate of the chromatophore kATP as a function of light intensity I, in units of ATP molecules per second, is given by
| (7) |
Here, the dependence of kATP on the vesicle composition s = {nB, nRC, nLH2}is expressed implicitly through the stoichiometry-dependence of the cycling time τRC and the total absorption cross section σtotal for BChls. The quantum yield q in Eq. (7) at stoichiometries different than for the vesicle shown in Fig. 1B is computed14 by an interpolation of the vesicle composition dependence of q reported earlier.21
The rate kinetics model described by Eq. (7) displays two limitations. First, the spatial details of the chromatophore are reflected directly only in the computation of the quantum yield q, but not in the cycling time τRC(I), since the direct computation, via molecular dynamics, of the rate limiting diffusive processes that govern the cycling time is currently prohibitive.14 Second, coupling to cytoplasmic reactions through enzymes such as NADH dehydrogenase and succinate dehydrogenase42 are not considered, since the respective proteins are currently not resolved in AFM data and, therefore, not included in the corresponding structural models.14,23
In order to interpret the constant light growth experiments reported in this manuscript, the relation between the chromatophore composition and the light intensity at growth needs to be considered. The composition of a chromatophore varies gradually according to growth conditions with lower light intensities resulting in a higher LH2:RC ratio.12,21 The ATP production rate given by Eq. (7) considers the light intensity I and the vesicle composition s to be independent quantities. In other words, the light intensity present at the growth of the cell that determined the vesicle composition s is unrelated to the light intensity I acting upon the chromatophore momentarily; e.g., Eq. (7) can describe a low light-growth chromatophore illuminated at high light or vice versa. The growth experiments herein correspond to constant light conditions, i.e., a chromatophore is always illuminated at the same light intensity as that which determined its composition at time of growth. Therefore, it is of interest to describe the ATP production rate, Eq. (7), for a vesicle subjected to the same light intensity corresponding to its own specific growth condition.
For the purpose of describing constant light growth experiments, the vesicle stoichiometry itself is expressed in terms of the light intensity at growth, namely, by a function . The quantities, nB(I), nRC(I), nLH2(I), are not independent of one another. First, following Ref.,14 the number of LH2 complexes nLH2(nB, nRC) is determined directly by the excluded surface area left available after the assignment of cytbc1 and RC-LH1-PufX complexes; therefore, it is sufficient to describe only nB(I) and nRC(I). Second, the cytbc1:RC stoichiometry, namely, 2nB: nRC, is not arbitrary and is determined to be 1:3 based on mass spectrometry data.23 Third, the LH2:RC stoichiometry is reported to change from 2.6 at low light to 1.5 at high light.20 The stoichiometry of the low light-growth vesicle14 is . With the aforementioned three constraints for the three quantities, nB(I), nRC(I), nLH2(I), the stoichiometry corresponding to the high light-growth vesicle becomes . The values for at intermediate illuminations are determined below by taking nRC(I) to be a logarithmic interpolation between the low light, taken to be 30 μmol photons m−2 s−1 (i.e., 3% of full sunlight; see Methods), and high light, taken to be 1000 μmol photons m−2 s−1 (i.e., 100% of full sunlight), illumination values, namely, nRC;low = 24 and nRC;high = 30, respectively; nB(I) and nLH2(I) are determined from nRC(I) according to the constraints listed above.
With the growth condition dependence of the vesicle stoichiometry thus established, the stoichiometry-adjusted ATP production rate at light intensity I for a vesicle that was also grown at the same light intensity I is given by
| (8) |
where the stoichiometry is substituted into Eq. (7).
The ATP production rates kATP(I) given by Eq. (7) for low light-growth, , and high light-growth, , vesicle compositions are shown in Fig. 2A.
Figure 2:

ATP production rate and return-on-investment time of a chromatophore vesicle. (A) The ATP production rate kATP as a function of illumination Φ is computed following Ref.14 for the low light-growth vesicle (black, solid) as shown in Fig. 1B as well as a high light-growth vesicle (gray, dashed), comprising 15 LH1-RC-PufX dimers, 5 cytbc1 dimers, and 47 LH2 complexes, corresponding to a BChl-per-RC ratio change of 0.53 from low light to high light as reported in Ref.12 (B) The return-on-investment time, τROI, namely, the time it takes for the chromatophore to make enough ATP for constructing another chromatophore, is shown for the aforementioned low light-growth (black, solid) and high light-growth (gray, dashed) vesicle compositions, computed according to Eq. (9). Also shown are the τROI values corresponding to the theoretical maximum value of the ATP yield as reported in Ref.43 (black, dotted: low light-growth vesicle; gray, dot-dashed: high light-growth vesicle). The shaded region in both graphs indicates an illumination range of 10–50 μmol photons m−2 s−1 corresponding to the typical low light habitat of purple bacteria, whereupon also the chromatophore structural model14 (Fig. 1B) is based.
Return-on-investment time of the chromatophore
The chromatophore can be regarded as a device that produces ATP and is, in turn, itself manufactured by the expenditure of ATP. The time it takes for the chromatophore, at a given illumination, to produce enough ATP to pay for its own manufacturing cost, i.e., to return the metabolic investment in ATP for its production, is defined to be the ROI time, τROI. Thus, for a vesicle with stoichiometry s, the return-on-investment time τROI at illumination I can be expressed as
| (9) |
where CATP is the total cost in ATP molecules for the manufacturing of the chromatophore and kATP(s, I) is the ATP production rate given by Eq. (7).
The ATP cost CATP is not computed by accounting for all metabolic processes involved in the manufacturing of chromatophore components. Instead, CATP is estimated from the total dry mass of the chromatophore and the reported values for the so-called ATP yield YATP, namely, the dry cell mass generated by ATP synthesis, in units of grams per mol ATP.43 A set of YATP values, corrected for the maintenance energy expenditure of the cell, are listed in Ref.43 to range between 10–24 g/mol-ATP for various bacteria along with a theoretical maximum value of . The value of YATP for Rba. sphaeroides for the growth environment discussed below and its dependence on light intensity at growth are currently unavailable. Therefore, we adopt a value from the aforementioned range as YATP = 22 g/mol-ATP, chosen for a best fit to the observed doubling behavior at the low light illumination (i.e., 30 μmol photons m−2 s−1); YATP is assumed to be the same at all growth light intensities. For comparison purposes, the theoretical maximum value is also considered in the estimates of ROI and cell doubling time discussed below.
The ATP cost CATP for the production of the low light-growth chromatophore shown in Fig. 1B is thus estimated to be
| (10) |
where Mchrom = 2.9 × 10⁷ Da is the dry mass of the chromatophore. The ATP cost corresponding to the theoretical maximum ATP yield is ATP molecules.
The ROI time τROI given by Eq. (9) for the low light-growth, , and high light-growth, , vesicles are shown in Fig. 2B.
Using the growth condition dependence of the vesicle stoichiometry and the stoichiometry-adjusted ATP production rate given by Eq. (8), a similarly stoichiometry-adjusted ROI time can be computed for a vesicle that was grown at light intensity I and illuminated also at the same light intensity I, namely,
| (11) |
where the stoichiometry is substituted into Eq. (9). The ATP cost of a vesicle CATP estimated from the vesicle mass in Eq. (10) is assumed to be independent of I as vesicle size does not change significantly between different growth conditions.20
Growth of Rhodobacter sphaeroides
Rba. sphaeroides wild-type strain 2.4.1 was grown in M22+ medium44 supplemented with 0.1% casamino acids. Growth was measured by monitoring the optical density at 680 nm (OD680). Starter cultures were grown semi-aerobically in the dark in a rotary shaker at 34°C. Photosynthetic growth under anaerobic conditions was performed at room temperature in completely full and sealed 17 ml sterile glass tubes inoculated to a starting OD680 of 0.03–0.05. Illumination at light intensities of 1, 10, 30, 100, 250, 500 and 1000 μmol m−2 s−1 was provided using Osram 116 W Halogen bulbs. These light intensities were chosen to span a likely range of irradiation by sunlight. These values vary according to wavelength, position on the Earth’s surface, time of year, and other factors, and lie between 200–500 W m−2 in the 750–950 nm wavelength range for standard incoming solar spectral irradiance distribution. We chose a conservative value of 200 W m−2, equivalent to 1000 μmol m−2 s−120 as our measure of 100% full sunlight. Light intensity was monitored using a LI-250A Light Meter equipped with a LI-190 Quantum Sensor (LI-COR Biosciences). Using thin glass tubes (~ 1 cm across) and culture mixing with magnetic stirrers ensured that self-shading was minimized during photosynthetic growth. Notable for the energy use estimates discussed below, the cells did not exhibit flagellar motility; nor did they have access to an energy source other than photosynthesis for metabolic activity, although the growth medium does supply sources of carbon for photoheterotrophic growth. The observed cell populations denoted by OD680 at each illumination are shown in Fig. 3A,B.
Figure 3:

The growth rate and chromatophore content of Rba. sphaeroides as a function of illumination. (A) Growth rate under anaerobic conditions at room temperature determined from OD680 for the illuminations 1 μmol m−2 s−1, 10 μmol m−2 s−1, 30 μmol m−2 s−1, 100 μmol m−2 s−1; for clarity, illumination values above 100 μmol m−2 s−1 are shown separately in (B). The exponential growth phase for each illumination is indicated by a linear fit, the inverse slope of which determines the cell doubling time (shown in Fig. 4). (B) Same as (A) but for the illuminations 100 μmol m−2 s−1, 250 μmol m−2 s−1, 500 μmol m−2 s−1, 1000 μmol m−2 s−1. It is seen that above 100 μmol m−2 s−1, the growth rate of Rba. sphaeroides saturates, resulting in near-identical doubling times (Fig. 4). (C) Whole cell absorbance spectra were obtained in order to determine the chromatophore content of Rba. sphaeroides at each illumination (see Methods). (D) Absorbance spectra of pigments from (C), separated for clarity. (E) The number of chromatophore vesicles per cell Nchrom (circles) estimated from the spectra shown in (C) and the nonlinear fit (solid line) used to interpolate Nchrom at intermediate illuminations. (F) The chromatophore mass ratio ηchrom of the cell estimated from the chromatophore count shown in (E) based on Eq. (15).
Spectroscopy and quantification of bacteriochlorophyll concentration
Cells grown at different light intensities were harvested by centrifugation (15,000 rpm, 20 min, 4°C) at an OD680 of 1.0. Cell pellets were resuspended in 20 mM HEPES pH 7.5 with 50% (v/v) glycerol, normalised by OD680, and whole cell absorption spectra were measured at room temperature in a Cary 60 UV-Vis spectrophotometer (Agilent Technologies) with baseline correction using 20 mM HEPES pH 7.5 with 50% (v/v) glycerol. To determine the BChl concentration, pigment was extracted from 1 OD680 unit of cells, essentially as described in.45 The cells were pelleted (15,000 rpm, 5 min, 4°C) and all the supernatant was removed. Cells were resuspended in 1 ml of methanol with 0.2% (v/v) ammonia, vortex mixed for 30 s and incubated on ice for 20 min in the dark. The extracts were clarified by centrifugation (15,000 rpm, 5 min, 4°C) and absorption spectra were measured immediately, using methanol with 0.2% (v/v) ammonia for baseline correction. The BChl content per cell was determined using a 771 nm extinction coefficient for BChl a in methanol of 54.8 mM−1cm−1,46 and a conversion factor of 1.1 × 10⁹ cells per OD680 unit.20
A range of values for BChls per chromatophore vesicle were used in order to estimate the number of vesicles per cell, ranging from 2469 BChls per chromatophore for a low light growth vesicle (30 μmol photons m−2 s−1)14 to 2342 BChls per chromatophore for a moderate high light growth vesicles (500 μmol photons m−2 s−1), the latter value determined by stoichiometry interpolation as discussed above. The observed spectra at each illumination are shown in Fig. 3C,D and the corresponding vesicle counts in Fig. 3E.
Observed and computed cell doubling times
The experimentally determined cell doubling times are obtained directly from the cell growth curves shown in Fig. 3A,B. The exponential growth phase was identified at each light intensity as indicated by a linear fit in the semi-log plot. The corresponding cell doubling times are given by the inverse-slope of each linear fit.
In the following, the cell doubling times are also determined computationally from a model of cell-wide ATP production and expenditure in Rba. sphaeroides. In accordance with the growth conditions described above, it is assumed that: (i) The cell’s sole input of energy is via photosynthesis, i.e, no source of energy is present in the growth medium; though, the medium supplies carbon for photoheterotrophic growth. (ii) The cell’s sole output of energy, adjusted after base metabolism, is reproduction, i.e., no flagellar motility is present. With these assumptions, the cell doubling time τD is estimated as the time it takes for the cell to produce enough ATP, beyond base metabolism, to pay for the manufacture of another cell. Thus, the doubling time τD can be expressed in terms of the ratio of the total ATP cost of manufacturing a new cell and the total ATP production rate in the entire cell; the former is given by the total dry mass of the cell Mcell divided by the ATP yield YATP; the latter is the product of the number of chromatophores per cell and the ATP production rate per chromatophore. It follows that
| (12) |
where Nchrom is the number of chromatophores per cell; both Mcell and Nchrom are assumed to be dependent on light intensity during growth. In Eq. (12), the stoichiometry-adjusted rate from Eq. (8) is employed for the ATP production rate per chromatophore because illumination levels were constant during each cell growth cycle, i.e., the instantaneous illumination incident on a vesicle at a given moment was always identical to the illumination that determined the vesicle stoichiometry at the time of the vesicle’s growth.
In Eq. (12), the number of chromatophores per cell Nchrom(I) is determined directly from the vesicle counts obtained from whole cell spectra shown in Fig. 3C, using a nonlinear interpolation for intermediate illumination values (see Fig. 3E). As observed also in tomography images,29,47 the chromatophore count per cell depends on the light intensity at growth, corresponding to a near-dense packing of vesicles at low light-growth (see Fig. 1A).
The dry cell mass Mcell used in Eq. (12) is assumed to be dependent on the chromatophore content in the cell as follows
| (13) |
where M0 denotes the dry mass of the non-chromatophore portion of the cell. The dry cell mass corresponding to the dense packing of chromatophores at low light-growth shown in Fig. 1A is estimated from the volume of a Rba. sphaeroides cell, considered to be a cylinder with a diameter of 0.6 μm and a length of 1.5 μm47 and a dry mass ratio of 0.3,48 which yields a value of 1.3 × 10¹¹ Da. The term M0 is estimated by considering the low light limit of Eq. (13): at a growth illumination of 1.5 μmol m−2 s−1 the observed pigment count corresponds to Nchrom = 2927 vesicles (see Fig. 3C,E); substituting this value into Eq. (13) yields M0 = 4.0 × 10¹⁰ Da.
With the illumination dependence of the terms, Mcell(I), Nchrom(I), , thus determined, Eq. (12) permits an estimation of the doubling time of Rba. sphaeroides at different growth light intensities. Comparing Eq. (12) with Eqs. (9–11), the cell doubling time τD can be expressed in terms of the stoichiometry-adjusted ROI time of the chromatophore and the mass ratio of chromatophore vesicles in the cell
| (14) |
where the chromatophore mass ratio ηchrom is given by
| (15) |
The estimate for ηchrom (I) using Eqs. (15,13) based on the observed chromatophore count ηchrom (I) (Fig. 3E) is shown in Fig. 3F.
The cell doubling time τD computed according to Eq. (14) is shown in Fig. 4 (solid line), along with τD values corresponding to the theoretical maximum ATP yield (dotted line), and compared with the experimentally observed doubling times (circles) obtained from the exponential phase of growth curves at each light intensity from Fig. 3A,B.
Figure 4:

The comparison of observed and computed cell doubling times for Rba. sphaeroides as a function of illumination. The observed doubling times (circles) are determined by the inverse slope of the linear fit to the exponential phase of each growth curve shown in Fig. 3A,B. The computed doubling time (solid line) is governed by Eq. (14). Also shown is the doubling time that corresponds to the theoretical maximum value of the ATP yield reported in Ref.43 (dotted line). The shaded region highlight the low light illumination range of 10–50 μmol photons m−2 s−1 typical of purple bacterial growth.
Results and Discussion
Based on the experimental and computational framework outlined above, the performance of the chromatophore as a solar energy harvesting device is quantified and related to the reproductive success of its host organism as measured by the cell doubling time. A comparison is provided between the ROI time and the benefit-to-cost ratio for the chromatophore and for photovoltaic and fossil fuel based energy systems.
Return-on-investment as a performance metric of a photosynthetic system and comparison with artificial energy solutions
The ROI time of the chromatophore, computed according to Eq. (9), is τROI = 4.5–2.6 hours in the illumination range of 10–100 μmol photons m−2 s−1, respectively, for the low light-growth vesicle stoichiometry ; τROI = 4.4–2.1 hours in the same illumination range for the high light-growth vesicle stoichiometry (see Fig. 2B). Further increase of illumination does not correspond to a significant reduction of the ROI time for either vesicle, which attains at the illumination of 1000 μmol photons m−2 s−1 the lower limit of 2.3 hours for the low light-growth vesicle and 1.9 hours for the high light-growth vesicle. At an extreme low illumination of 1 μmol photons m−2 s−1, the corresponding ROI times are 33.0 hours and 40.2 hours, respectively.
The ROI time τROI can be considered as a performance metric with lower return times representing a greater advantage for the host organism. Accordingly, based on the aforementioned τROI values, the low light-growth vesicle performs 10% better than the high light-growth vesicle at 1 μmol photons m−2 s−1, whereas the high light-growth vesicle performs 24% better than the low light-growth vesicle at 1000 μmol photons m−2 s−1.
The ROI times for the low light-growth and high light-growth vesicles at the specific illuminations corresponding to their own growth conditions are given by the stoichiometry-adjusted ROI time according to Eq. (11). Assuming values for the low light illumination of 30 μmol photons m−2 s−1 and for the high light illumination of 1000 μmol photons m−2 s−1 results in stoichiometry-adjusted ROI times of hours and hours, respectively; i.e., when considered at their native illumination conditions the high light-growth vesicle performs 63% more effectively than the low light-growth vesicle in returning ATP investment.
The value assumed for the so-called ATP yield YATP,43 in grams of dry cell mass generated per mol-ATP, is a direct multiplicative factor in determining τROI as discussed in the Methods section. Employing the theoretical upper limit instead of YATP would correspond the lowering of the aforementioned values of τROI and by a uniform factor of 1.5. In principle, the growth condition dependence of YATP(I), currently assumed to be constant, with respect to changes in cell composition as a function of illumination needs to be considered in estimating , when such data becomes available.
The concept of ROI is used frequently as a decision making tool for evaluating the performance of human-engineered systems.27,28 In such a context, it is customary to express ROI as a benefit-to-cost ratio obtained by integrating the rate of return over the expected lifetime of the system, i.e., the ratio of the total return to the initial investment. For a photosynthetic system, such a benefit-to-cost ratio R can be expressed in comparison with Eq. (9), if the expected lifetime T of the vesicle is known, as follows
| (16) |
It is difficult to determine the lifetime T of a chromatophore in order to compute its benefit-to-cost ratio R. Chromatophore vesicles appear to have lifetimes that exceed the doubling time of the cell as daughter cells inherit intact chromatophores from the parent cell.; changes in chromatophore activity and composition in response to changes in growth conditions are observed for time ranges from hours to days with chromatophore activity lasting up to 11 days.12 As an example, let us consider the low light-growth chromatophore (Fig. 1B) under a typical low light illumination of 30 μmol photons m−2 s−1, which, as indicated previously, corresponds to hours. Assuming a vesicle lifetime of T = 10 days12 in Eq. (16), along with the aforementioned value for , yields a benefit-to-cost ratio of R = 77; i.e., the low light-growth chromatophore considered above generates, during its typical operational lifetime, enough ATP to produce almost 80 other chromatophores. The high light-growth vesicle, , operating under an illumination of 1000 μmol photons m−2 s−1 corresponds to a value of R = 126, if the same value of T is used for the vesicle lifetime.
The aforementioned values of R represent energy returned per energy invested for the manufacturing of the chromatophore only, i.e., they do not take into account metabolic processes in the rest of the cell that produces the chromatophore. The cost of the non-chromatophore portions of the cell are accounted in the determination of the cell doubling time, as discussed in the Methods section (Eqs. (12)–(15)) as well as the following section. It is expected that for a biological system to be viable, its benefit-to-cost ratio R is required to be above 1 and that the selective pressure of evolution would drive R progressively higher as a result of competition between species.
Using energy as a currency for a cost-benefit analysis permits a direct comparison between biological and synthetic energy solutions. The benefit-to-cost ratio R in Eq. (16) is akin to the so-called ‘energy return on energy investment’ (EROI) used to evaluate photovoltaic and fossil fuel based energy systems.49 Currently, the EROI for global oil is estimated to be R ~ 10–30; for photovoltaic systems the corresponding value is R ~ 19–38.49 When these R values are compared with the aforementioned value of R = 77 for a low light-growth chromatophore operated at a low light intensity, the chromatophore appears to display a performance that is 2–8 times better than photovoltaic or fossil fuel based energy systems as measured by the return on energy investment. Notably, the ROI in the case of photovoltaic systems is based on an operational lifetime of 30 years,49 which corresponds to a τROI,PV ~ 0.8–1.6 years, i.e., approximately 3–4 orders of magnitude longer than the τROI values presented above for the chromatophore.
The comparisons thus provided between biological and synthetic systems based on the ROI time τROI and the benefit-to-cost ratio R for energy expenditure should be regarded with caution. Efficiency for biomass production in plants is significantly lower than the thermodynamic efficiency of energy conversion into ATP.15 Furthermore, a photosynthetic vesicle is not a stand-alone device, but must be considered in the context of its host organism, effectively paying for the overhead costs for other cellular processes, thereby lowering its apparent efficiency.
Cell doubling time as a function of illumination
The cell doubling time τD of Rba. sphaeroides determined in this study is shown in Fig. 4 for both experimentally obtained values (circles), based on the exponential phase of growth curves at each illumination measured through OD680 (Fig. 3A,B), and for computationally obtained values (solid line), based on Eq. (14), as discussed in the Methods section. The computationally expressed value of the cell doubling time τD can be viewed as the stoichiometry-adjusted ROI time for the entire cell instead of a single, isolated chromatophore. In other words, in the absence of any energy input other than photosynthesis and any energy output beyond base metabolism other than reproduction, the cell doubling time equals the time it takes for the cell to pay the investment cost in energy for the construction of another cell. Thus, Eq. (14) expresses τD in terms of , modified by the mass ratio ηchrom of the photosynthetic apparatus of the cell, with the latter quantity determined experimentally (Fig. 3C–F). As in the case of , the computed values for τD are multiplicatively dependent on the value assumed for the ATP yield YATP. For comparison, the cell doubling time values corresponding to the theoretical upper limit of the ATP yield are also shown in Fig. 4 (dotted line). The effect of possible light condition dependence of YATP on τD is not considered.
Maximal levels of cell growth are seen for illuminations greater than 100 μmol photons m−2 s−1 (Fig. 4), which matches the saturation behavior displayed by the ROI time τROI for the same illumination threshold in case of both low light-growth and high light-growth vesicle compositions (Fig. 2B). A similar saturation behavior is also partly present for the number of chromatophore vesicles in the cell, which gradually approach a lower limit with increasing light intensity (Fig. 3E). Notably, the residual increase in ATP production per chromatophore between illumination values of 100–1000 μmol photons m−2 s−1, given by Eq. (8), corresponds to a comparable decrease in the chromatophore count per cell, given in Fig. 3E. This results in the aforementioned saturation of the cell doubling time, as governed by Eq. (14), at illuminations above 100 μmol photons m−2 s−1 for both experimentally determined and computed values (Fig. 4).
For the low illumination range of 10–100 μmol photons m−2 s−1 the computed cell doubling time τD is within approximately 40% of the experimentally observed values of 8.2–3.9 hours, respectively (Fig. 4). At extreme low and high illumination values, Fig. 4 displays systematic deviations between the experimentally observed and computed values of the cell doubling time. At the high light limit (1000 μmol photons m−2 s−1), the observed cell doubling time is 3.7 hours whereas the computed cell doubling time is 6.4 hours, which constitutes an overestimation by the computed value of a factor 1.7. At extreme low light illumination (1 μmol photons m−2 s−1), the observed cell doubling time is 20.3 hours whereas the computed cell doubling time is 45.1 hours, which constitutes an overestimation by the computed value of a factor 2.2.
The deviations between the observed and computed values of cell doubling time at the extreme low light and high light limits are likely a combination of multiple factors. First, the atomic detail structural model that is used as the basis of the current study14 is specifically a low light-growth vesicle (Fig. 1B); the effects of growth-dependent vesicle composition on the ATP production rate are incorporated only as interpolations14 upon this known vesicle composition and are subject to deviations at both ends of the growth conditions. Second, the value of the so-called ATP yield YATP is assumed to be constant for all growth conditions as well as being uniform across all cellular compartments, whereas it is plausible that the efficiency of biomass generation represented by this quantity is, in fact, dependent on growth condition and corresponding cell composition. Third, the model presented here for relating energy expenditure to cell doubling (Eq. (14)) assumes the absence of any energy input other than photosynthesis and any energy consumption other than reproduction and base metabolism, which is difficult to control physiologically.
Conclusions
The fundamental energy conversion processes in the purple bacterium Rba. sphaeroides are described in an integrative structure-function formulation as a function of illumination, starting from the atomic detail structural models of the photosynthetic vesicle, chromatophore, determined over a decade of combined experimental and computational inquiries.14,21–23 The model presented allows the computation of: first, the ATP production rate per vesicle; second, the energy ROI paid back when the vesicle is considered as an energy harvesting device; third, the cell doubling time of the bacterium for photosynthetic growth expressed as the time it takes for the entire cell to pay the energy investment necessary to construct a new cell.
The results presented in this study constitute a rare circumstance where a cell scale observable, namely the cell doubling time, is directly derivable from a structural and functional model that incorporates atomic detail descriptions of constituent components. The approach presented comprises a modular, multi-scale description of energy conversion subprocesses that permit the enhancing of the detail level of any subprocess as the corresponding experimental data and computational frameworks improve. For example, the rate limiting energy conversion step of charge carrier diffusion,8,9,14 currently incorporated heuristically based on experimental observations of quinol cycle time12,40 in a steady-state, spatially homogenous description, can be replaced by an explicit diffusion model as future computational capabilities permit. Similarly, the approach employed in this study can be used to determine cell doubling times in other photosynthetic species as structural and functional models become available for cyanobacterial and plant cells, and for non-photosynthetic species, if the energy conversion models presented herein are replaced with appropriate metabolic models for energy conversion.
By considering energy as a unit of currency, the ROI formulation employed in this study provides an integrative performance metric for bioenergetic systems and permits a quantitative comparison of bioenergetic systems, from organelles to whole cells, between different species as well as with human-engineered energy harvesting systems. The ROI time τROI, essentially the time for the payback of energy investment, for a chromatophore is 3–4 orders of magnitude shorter than the corresponding ROI time for photovoltaic systems. The benefit-to-cost ratio R, expressed as the return on energy investment integrated over the lifetime of the system, is 2–8 times greater for the chromatophore, operating under low light conditions typical of the purple bacterial habitat, than the corresponding values for photovoltaic and fossil fuel based energy harvesting systems. It is plausible that the photosynthetic mechanisms employed by cyanobacteria and plants display substantially improved values of τROI and R over that of the purple bacterial values presented here. A rationale for evolutionary selection can be formulated through a quantification of performance via the ROI formulation thus presented.
Rational design of bioengineered energy solutions can be enhanced by considering the performance of a photosynthetic device quantified in terms of ROI time τROI and the benefit-to-cost ratio R formulated here. Pigment and protein level innovations for bio-hybrid systems eventually need to be considered in terms of their system-level impact and evaluated in regard to improvements in overall performance as measured by the return on the initial investment in energy.
Acknowledgement
This manuscript is dedicated to the memory and lifelong vision of Klaus Schulten that computational modeling at atomic detail can describe and explain cellular processes, by crossing barriers of length and time scales and aligning with experimental observations. The authors will always be grateful for Klaus Schulten’s inspiration, intellectual guidance, leadership, and friendship. His insistence on rigor and Socratic dialog, as parts of the necessary craft of a scientist and as habits expected of a decent human being, were leavened by his charm and humor. Klaus’ deep interest in photosynthesis and biophysics underpinned this decade-long endeavor to apply his ‘computational microscope’ to the harvesting, trapping, and storage of solar energy.
The authors also acknowledge insightful discussions on chromatophore function with Antony Crofts, Robert A. Niederman, and, particularly, Donald Bryant for his suggestion to compare the computed return-on-investment time with the observed cell doubling time. The study reported was funded by the Photosynthetic Antenna Research Center (PARC), an Energy Frontier Research Center supported by the US Department of Energy, Office of Science, and Office of Basic Energy Sciences under Award Number DE-SC0001035 (CNH and MS). MS acknowledges support from the National Science Foundation (MCB1157615 and PHY0822613) and the National Institutes of Health (NIH 9P41GM104601). CNH and AH acknowledge research grant BB/M000265/1 from the Biotechnology and Biological Sciences Research Council (UK). CNH was also supported by an Advanced Award 338895 from the European Research Council. The molecular image in Figure 1 was generated with VMD.50
References
- [1].Blankenship RE Molecular Mechanisms of Photosynthesis, 2nd ed.; Wiley Blackwell, 2014. [Google Scholar]
- [2].Scholes GD; Harcourt RD; Fleming GR Electronic Interactions in Photosynthetic Light-Harvesting Complexes: The Role of Carotenoids. J. Phys. Chem. B 1997, 101, 7302–7312. [Google Scholar]
- [3].Yang M; Damjanović A; Vaswani HM; Fleming GR Energy Transfer in Photo-system I of Cyanobacteria Synechococcus elongatus: Model Study with Structure-Based Semi-Empirical Hamiltonian and Experimental Spectral Density. Biophys. J 2003, 85, 140–158. [DOI] [PMC free article] [PubMed] [Google Scholar]
- [4].Romero E; Augulis R; Novoderezhkin VI; Ferretti M; Thieme J; Zigmantas D; van Grondelle R Quantum coherence in photosynthesis for efficient solar-energy conversion. Nature Physics 2014, 10, 676–682. [DOI] [PMC free article] [PubMed] [Google Scholar]
- [5].Şener MK; Park S; Lu D; Damjanović A; Ritz T; Fromme P; Schulten K Excitation migration in trimeric cyanobacterial photosystem I. J. Chem. Phys 2004, 120, 11183–11195. [DOI] [PubMed] [Google Scholar]
- [6].Strümpfer J; Schulten K Open Quantum Dynamics Calculations with the Hierarchy Equations of Motion on Parallel Computers. J. Chem. Theor. Comp 2012, 8, 2808–2816. [DOI] [PMC free article] [PubMed] [Google Scholar]
- [7].Caycedo-Soler F; Rodríguez FJ; Quiroga L; Johnson NF Interplay between excitation kinetics and reaction-center dynamics in purple bacteria. New J. Phys 2010, 12, 095008. [Google Scholar]
- [8].Lavergne J; Verméglio A; Joliot P In The Purple Phototrophic Bacteria; Hunter CN, Daldal F, Thurnauer MC, Beatty JT, Eds.; Springer, 2009; pp 509–536. [Google Scholar]
- [9].Geyer T; Mol X; Blaß S; Helms V Bridging the Gap: Linking Molecular Simulations and Systemic Descriptions of Cellular Compartments. PLoS ONE 2010, 5(11), e14070. [DOI] [PMC free article] [PubMed] [Google Scholar]
- [10].Feniouk BA; Junge W In The Purple Phototropic Bacteria; Hunter CN, Daldal F, Thurnhauer M, Beatty JT, Eds.; Springer, 2009; pp 475–493. [Google Scholar]
- [11].Hakobyan L; Gabrielyan L; Trchounian A Relationship of proton motive force and the F(0)F(1)-ATPase with bio-hydrogen production activity of Rhodobacter sphaeroides: effects of diphenylene iodonium, hydrogenase inhibitor, and its solvent dimethylsulphoxide. J Bioenerg. Biomembr 2012, 44, 495–502. [DOI] [PubMed] [Google Scholar]
- [12].Woronowicz K; Sha D; Frese RN; Niederman RA The Accumulation of the Light-Harvesting 2 Complex during Remodeling of the Rhodobacter sphaeroides Intracytoplasmic Membrane Results in a Slowing of the Electron Transfer Turnover Rate of Photochemical Reaction Centers. Biochemistry 2011, 50, 4819–4829. [DOI] [PubMed] [Google Scholar]
- [13].Niederman RA Membrane development in purple photosynthetic bacteria in response to alterations in light intensity and oxygen tension. Photosyn. Res 2013, 116, 333–48. [DOI] [PubMed] [Google Scholar]
- [14].Sener M; Strümpfer J; Singharoy A; Hunter CN; Schulten K Overall energy conversion efficiency of a photosynthetic vesicle. eLife 2016, 10.7554/eLife.09541 (30 pages). [DOI] [PMC free article] [PubMed] [Google Scholar]
- [15].Blankenship RE; Tiede DM; Barber J; Brudvig GW; Fleming G; Ghirardi M; Gunner MR; Junge W; Kramer DM; Melis A et al. Comparing Photosynthetic and Photovoltaic Efficiencies and Recognizing the Potential for Improvement. Science 2011, 332, 805–809. [DOI] [PubMed] [Google Scholar]
- [16].Harris MA; Parkes-Loach PS; Springer JW; Jiang J; Martin EC; Qian P; Jiao J; Niedzwiedzki DM; Kirmaier C; Olsen JD et al. Integration of multiple chromophores with native photosynthetic antennas to enhance solar energy capture and delivery. Chem. Sci 2013, 4, 3924–3933. [Google Scholar]
- [17].Sener M; Strümpfer J; Hsin J; Chandler D; Scheuring S; Hunter CN; Schulten K Förster energy transfer theory as reflected in the structures of photosynthetic light harvesting systems. ChemPhysChem 2011, 12, 518–531. [DOI] [PMC free article] [PubMed] [Google Scholar]
- [18].Xiong J; Fischer WM; Inoue K; Nakahara M; Bauer CE Molecular Evidence for the Early Evolution of Photosynthesis. Science 2000, 289, 1724–1730. [DOI] [PubMed] [Google Scholar]
- [19].Perilla JR; Goh BC; Cassidy CK; Liu B; Bernardi RC; Rudack T; Yu H; Wu Z; Schulten K Molecular dynamics simulations of large macromolecular complexes. Curr. Opin. Struct. Biol 2015, 31, 64–74. [DOI] [PMC free article] [PubMed] [Google Scholar]
- [20].Adams PG; Hunter CN Adaptation of intracytoplasmic membranes to altered light intensity in Rhodobacter sphaeroides. Biochim. Biophys. Acta 2012, 1817, 1616–1627. [DOI] [PubMed] [Google Scholar]
- [21].Sener MK; Olsen JD; Hunter CN; Schulten K Atomic level structural and functional model of a bacterial photosynthetic membrane vesicle. Proc. Natl. Acad. Sci. USA 2007, 104, 15723–15728. [DOI] [PMC free article] [PubMed] [Google Scholar]
- [22].Sener M; Strumpfer J; Timney JA; Freiberg A; Hunter CN; Schulten K Photosynthetic Vesicle Architecture and Constraints on Efficient Energy Harvesting. Biophys. J 2010, 99, 67–75. [DOI] [PMC free article] [PubMed] [Google Scholar]
- [23].Cartron ML; Olsen JD; Sener M; Jackson PJ; Brindley AA; Qian P; Dickman MJ; Leggett GJ; Schulten K; Hunter CN Integration of energy and electron transfer processes in the photosynthetic membrane of Rhodobacter sphaeroides. Biochim. Biophys. Acta – Bioener 2014, 1837, 1769–1780. [DOI] [PMC free article] [PubMed] [Google Scholar]
- [24].Jackson PJ; Lewis HJ; Tucker JD; Hunter CN; Dickman MJ Quantitative proteomic analysis of intracytoplasmic membrane development in Rhodobacter sphaeroides. Mol. Microbiol 2012, 84, 1062–1078. [DOI] [PubMed] [Google Scholar]
- [25].Woronowicz K; Harrold JW; Kay JM; Niederman RA Structural and Functional Proteomics of Intracytoplasmic Membrane Assembly in Rhodobacter sphaeroides. J. Mol. Microbiol. Biotech 2013, 23, 48–62. [DOI] [PubMed] [Google Scholar]
- [26].Şener MK; Lu D; Ritz T; Park S; Fromme P; Schulten K Robustness and Optimality of Light Harvesting in Cyanobacterial Photosystem I. J. Phys. Chem. B 2002, 106, 7948–7960. [Google Scholar]
- [27].Alcorta L; Bazilian M; Simone GD; Pedersen A Return on investment from industrial energy efficiency: evidence from developing countries. Energ. Effic 2014, 7, 43–53. [Google Scholar]
- [28].Murdoch W; Ranganathan J; Polasky S; Regetz J Using return on investment to maximize conservation effectiveness in Argentine grasslands. Proc. Natl. Acad. Sci. USA 2010, 107, 20855–20862. [DOI] [PMC free article] [PubMed] [Google Scholar]
- [29].Sener M; Stone JE; Barragan A; Singharoy A; Teo I; Vandivort KL; Isralewitz B; Liu B; Goh BC; Phillips JC et al. Visualization of Energy Conversion Processes in a Light Harvesting Organelle at Atomic Detail Proceedings of the International Conference on High Performance Computing, Networking, Storage and Analysis 2014. [Google Scholar]
- [30].Förster T Zwischenmolekulare Energiewanderung und Fluoreszenz. Ann. Phys. (Leipzig) 1948, 2, 55–75. [Google Scholar]
- [31].Novoderezhkin VI; Razjivin AP The theory of Forster-type migration between clusters of strongly interacting molecules: application to light-harvesting complexes of purple bacteria. Chem. Phys 1996, 211, 203–214. [Google Scholar]
- [32].Hu X; Ritz T; Damjanović A; Schulten K Pigment Organization and Transfer of Electronic Excitation in the Purple Bacteria. J. Phys. Chem. B 1997, 101, 3854–3871. [Google Scholar]
- [33].Scholes GD; Jordanides XJ; Fleming GR Adapting the Förster Theory of Energy Transfer for Modeling Dynamics in Aggregated Molecular Assemblies. J. Phys. Chem. B 2001, 105, 1640–1651. [Google Scholar]
- [34].Ma Y; Cogdell R; Gillbro T Energy transfer and exciton annihilation in the B800–850 antenna complex of the photosynthetic purple bacterium Rhodopseudomonas acidophila (strain 10050) — a femtosecond transient absorption study. J. Phys. Chem. B 1997, 101, 1087–1095. [Google Scholar]
- [35].Bradforth SE; Jimenez R; van Mourik F; van Grondelle R; Fleming GR Excitation transfer in the core light-harvesting complex (LH-1) of Rhodobacter sphaeroides: an ultrafast fluorescence depolarization and annihilation study. J. Phys. Chem 1995, 99, 16179–16191. [Google Scholar]
- [36].Strümpfer J; Sener M; Schulten K How Quantum Coherence Assists Photosynthetic Light Harvesting. J. Phys. Chem. Lett 2012, 3, 536–542. [DOI] [PMC free article] [PubMed] [Google Scholar]
- [37].Ishizaki A; Fleming GR Unified treatment of quantum coherent and incoherent hopping dynamics in electronic energy transfer: Reduced hierarchy equation approach. J. Chem. Phys 2009, 130, 234111–10. [DOI] [PubMed] [Google Scholar]
- [38].Strümpfer J; Schulten K Light Harvesting Complex II B850 Excitation Dynamics. J. Chem. Phys 2009, 131, 225101, (9 pages). [DOI] [PMC free article] [PubMed] [Google Scholar]
- [39].Remy A; Gerwert K Coupling of light-induced electron transfer to proton uptake in photosynthesis. Nat. Struct. Biol 2003, 10, 637–644. [DOI] [PubMed] [Google Scholar]
- [40].Woronowicz K; Sha D; Frese RN; Sturgis JN; Nanda V; Niederman RA The effects of protein crowding in bacterial photosynthetic membranes on the flow of quinone redox species between the photochemical reaction center and the ubiquinol-cytochrome c2 oxidoreductase. Metallomics 2011, 3, 765–774. [DOI] [PubMed] [Google Scholar]
- [41].Crofts A The cytochrome bc1 complex: Function in the Context of Structure. Annu. Rev. Physiol 2004, 66, 689–733. [DOI] [PubMed] [Google Scholar]
- [42].Klamt S; Grammel H; Straube R; Ghosh R; Gilles ED Modeling the electron transport chain of purple non-sulfur bacteria. Mol. Syst. Biol 2008, 4, 156. [DOI] [PMC free article] [PubMed] [Google Scholar]
- [43].Russell JB; Cook GM Energetics of Bacterial Growth: Balance of Anabolic and Catabolic Reactions. Microbiol. Rev 1995, 59, 48–62. [DOI] [PMC free article] [PubMed] [Google Scholar]
- [44].Hunter CN; Turner G Transfer of genes coding for apoproteins of reaction centre and light-harvesting LH1 complexes to Rhodobacter sphaeroides. J. Gen. Microbiol 1988, 134, 1471–1480. [Google Scholar]
- [45].Hitchcock A; Jackson PJ; Chidgey JW; Dickman MJ; Hunter CN; Canniffe DP Biosynthesis of chlorophyll a in a purple bacterial phototroph and assembly into a plant chlorophyll-protein complex. ACS Synth. Biol 2016, [DOI] [PubMed] [Google Scholar]
- [46].Permentier HP; Schmidt KA; Kobayashi M; Akiyama M; Hager-Braun C; Neerken S; Miller M; Amesz J Composition and optical properties of reaction centre core complexes from the green sulfur bacteria Prosthecochloris aestuarii and Chlorobium tepidum. Photosyn. Res 2000, 64, 27–39. [DOI] [PubMed] [Google Scholar]
- [47].Tucker JD; Siebert CA; Escalante M; Adams P; Olsen JD; Otto C; Stokes DL; Hunter CN Membrane invagination in Rhodobacter sphaeroides is initiated at curved regions of the cytoplasmic membrane, then forms both budded and fully detached spherical vesicles. Mol. Microbiol 2010, 76, 833–847. [DOI] [PubMed] [Google Scholar]
- [48].Albe KR; Butler MH; Wright BE Cellular concentrations of enzymes and their substrates. J. Theor. Biol 1990, 143, 163–95. [DOI] [PubMed] [Google Scholar]
- [49].Raugei M; Fullana-i-Palmer P; Fthenakis V The energy return on energy investment (EROI) of photovoltaics: Methodology and comparisons with fossil fuel life cycles. Energy Policy 2012, 45, 576–582. [Google Scholar]
- [50].Humphrey W; Dalke A; Schulten K VMD – Visual Molecular Dynamics. J. Mol. Graphics 1996, 14, 33–38. [DOI] [PubMed] [Google Scholar]