

SUMMARY
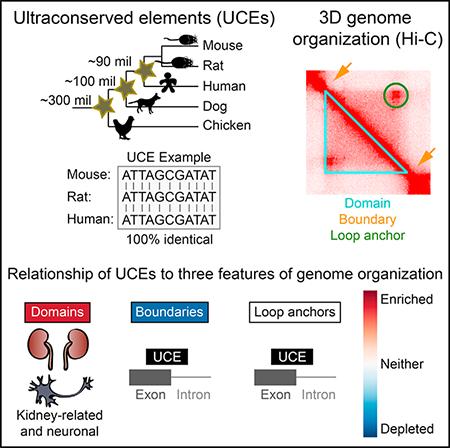
This study explores the relationship between three dimensional genome organization and ultraconserved elements (UCEs), an enigmatic set of DNA elements that are perfectly conserved between the reference genomes of distantly related species. Examining both human and mouse genomes, we interrogate the relationship of UCEs to three features of chromosome organization derived from Hi-C studies. We find that UCEs are enriched within contact domains and, further, that the subset of UCEs within domains shared across diverse cell types are linked to kidney-related and neuronal processes. In boundaries, UCEs are generally depleted, with those that do overlap boundaries being overrepresented in exonic UCEs. Regarding loop anchors, UCEs are neither overrepresented nor underrepresented, but those present in loop anchors are enriched for splice sites. Finally, as the relationships between UCEs and human Hi-C features are conserved in mouse, our findings suggest that UCEs contribute to interspecies conservation of genome organization and, thus, genome stability.
Graphical Abstract
In Brief
McCole et al. demonstrate the nonrandom relationship between the positions of perfectly conserved genomic regions, termed the ultraconserved elements (UCEs), and three-dimensional genome organization within mammalian nucleus as defined by Hi-C studies. They postulate that these connections aid in orchestrating genome packaging and preserving genome function and integrity.
INTRODUCTION
Chromosome organization in the mammalian nucleus is strikingly orchestrated, like a symphony played throughout the organism’s life span, composed by evolutionary forces. To explore this process of evolutionary ‘‘composition,’’ we are investigating the relationships between chromosome organization and sequence evolution in the mammalian genome, focusing on some of the most highly conserved regions—the ultraconserved elements (UCEs) (Bejerano et al., 2004; Sandelin et al., 2004; Woolfe et al., 2005). UCEs show staggering levels of interspecies sequence conservation, demonstrating perfect sequence identity extending ≥200 bp between species that diverged 90–300 million years ago and comprising one of the most puzzling findings in comparative genomics (Harmston et al., 2013; Polychronopoulos et al., 2017). While UCEs have been found to encompass a variety of functions, including enhancer, promoter, splicing, and repressive activities (Bejerano et al., 2004; Dickel et al., 2018; Kushawah and Mishra, 2017;Pennacchio et al., 2006; Poitras et al., 2010; Sandelin et al., 2004; Warnefors et al., 2016), these functions arguably fall short of explaining ultraconservation, per se. We have suggested that UCEs may maintain their sequence conservation through a mechanism involving the pairing and comparison of allelic UCEs, followed by loss of fitness should mutations or rearrangements that disrupt UCE pairing be detected (Chiang et al., 2008; Derti et al., 2006; McCole et al., 2014) (see also Elgar and Vavouri, 2008; Kritsas et al., 2012). Such a mechanism would protect genome integrity in the body overall and, at the organ-ismal level, promote ultraconservation over evolutionary timescales. Consistent with this model, UCEs are associated with regions of elevated synteny (Dimitrieva and Bucher, 2012; Dong et al., 2009; Irimia et al., 2012; Kikuta et al., 2007; Polychro-nopoulos et al., 2014, 2016; Sandelin et al., 2004; Sun et al., 2006, 2009). Furthermore, and in line with our proposal that disruptions of UCEs or UCE pairing lead to loss of fitness, the genomes of healthy individuals are generally not disrupted in the vicinity of UCEs (Chiang et al., 2008; Derti et al., 2006; McCole et al., 2014), while this pattern does not hold for genomes representing the cancerous state, or individuals with neurodevelopmental disorders or mental delay and congenital anomalies (Martínez et al., 2010; McCole et al., 2014). Highly conserved noncoding sequences can also interact in three dimensions (Robyr et al., 2011), adding weight to our proposal that interactions between UCEs in the nucleus may be important to their function. Finally, and of direct relevance to the proposal that allelic UCEs may pair, is the capacity of somatic genomes to support localized or whole chromosome pairing in a wide range of species (as reviewed by Joyce et al., 2016), with the most dramatic example in mammals being observed in renal oncocytoma (Koeman et al., 2008).
Here, we examine UCEs in the context of the three-dimensional organization of the genome, considering three features revealed by chromosome conformation capture (Hi-C) studies. We begin with contact ‘‘domains’’ (also called topologically associated domains [TADs]) and “boundaries”; contact domains are regions displaying frequent intra-regional interactions, while boundaries, which flank contact domains, are characterized by a paucity of interactions that traverse them (Bonev and Cavalli, 2016; Dekker et al., 2002; Denker and de Laat, 2016; Dixon et al., 2012, 2016; Liu and Weigel, 2015; Nora et al., 2012; Rao et al., 2014; Sexton et al., 2012). A third type of interaction involves the association of cis-linked regions known as ‘‘loop anchors,’’ wherein the intervening genomic segment forms a loop (Rao et al., 2014). In concordance with the functional importance of these three features, the positions of approximately half of domains, boundaries, and loops are conserved (Dixon et al., 2012; Rao et al., 2014), with domains preserved as units when positions are not conserved (Vietri Rudan et al., 2015). Thus, disrupting three-dimensional contacts inside domains may be disadvantageous, perhaps even oncogenic (Corces and Corces, 2016; Hnisz et al., 2016; Lupiáñez et al., 2016; Valton and Dekker, 2016; Weischenfeldt et al., 2017).
This study considers our proposal that ultraconservation protects genome integrity (Chiang et al., 2008; Derti et al., 2006; McCole et al., 2014) and hypothesizes that UCEs contribute to the preservation of domains over evolutionary time. In particular, we predicted that UCEs would be enriched within domains. In line with this, a recent publication reported that clusters of highly conserved noncoding elements (CNEs) correlate with the spans of domains encompassing genes involved in development (Harmston et al., 2017); although the thresholds for the length and identity used in this publication to define CNEs (>50 bp of 70%−90% conservation between human and chicken genomes) are much less stringent than those used to define UCEs, the findings are intriguing in light of our proposal. To test our hypothesis, we examined ten human and six mouse Hi-C datasets (Dixon et al., 2012; Fraser et al., 2015; Rao et al., 2014) and asked whether UCEs are enriched in or depleted from domains, boundaries, or loop anchors. Excitingly, UCEs proved to be significantly enriched in domains, and domains containing UCEs tend to be larger and relatively gene sparse, possibly suggesting a more structural role for these domains. In contrast, UCEs are generally depleted from boundaries and neither enriched nor depleted from loop anchors. The UCEs that do, nevertheless, occur in boundaries and loop anchors are predominantly exonic, with those in loop anchors enriched in splice sites. Our findings demonstrate that UCEs show specific, conserved relationships to domains, boundaries, and loops, hinting that UCEs may play a role in establishing and maintaining genomic organization.
RESULTS
UCEs Are Enriched within Domains, Depleted from Boundaries, and Indifferent to Loop Anchors
We began our studies by delineating how the Hi-C annotated genomic features of domains, boundaries, and loop anchors are related to the positioning of UCEs. To do this, we first collected published Hi-C datasets derived from nine human and five mouse tissues (Table S1), representing a variety of cell types (Dixon et al., 2012; Fraser et al., 2015; Rao et al., 2014). As Hi-C annotated regions vary between studies due to differences in cell type, species examined, amount of starting material, Hi-C protocol (in-solution [Dixon et al., 2012; Fraser et al., 2015] or in-nucleus [Rao et al., 2014]), and sequencing depth, we examined each dataset individually in addition to querying datasets combined according to species and genomic feature (Table S1) (Dixon et al., 2012; Fraser et al., 2015; Rao et al., 2014). Regarding UCEs, our analyses used our previously defined dataset (Table S2C), which comprises 896 elements that are ≥200 bp in length and identical in sequence within at least one of three groups of reference genomes (Derti et al., 2006; McCole et al., 2014). The three groups consist of the reference genomes of human, mouse, and rat (HMR), of human, dog, and mouse (HDM), and of human and chicken (HC), with the combined dataset of 896 UCEs designated as HMR-HDM-HC (Table S2C). To obtain UCE positions in the mouse genome, we aligned human UCE sequences to the mouse genome and recovered 893 orthologs (Supplemental Experimental Procedures; Table S2D). UCEs were also subdivided into exonic, in-tronic, and intergenic categories, which were then examined jointly and separately for enrichment or depletion within the Hi-C annotations (Experimental Procedures). Of note, a UCE is considered exonic if any part overlaps an exon; hence, exonic UCEs may overlap splice sites and contain intronic sequence.
To assess whether UCEs are significantly enriched in or depleted from domains, boundaries, and loop anchors, we used our previously established method (Chiang et al., 2008; Derti et al., 2006; McCole et al., 2014) (Figure 1), which compares ‘‘observed overlaps,’’ in base pairs, between UCEs and Hi-C annotated regions to ‘‘expected overlaps’’ between a set of regions matched to UCEs in terms of number and length, but randomly positioned in the genome. Expected overlaps are generated 1,000 times to produce a distribution of expected overlaps, which, when normally distributed, is subjected to a Z-test to compare the observed overlap with the distribution of expected overlaps. In cases where normality is not observed, the proportion of expected overlaps equal to, or more extreme than, the observed overlap is reported. In all cases, we report the ratio of observed to mean expected overlap (obs/exp). This tailored approach for each Hi-C dataset enables comparison of datasets that differ in number of identified regions, median region size, and percentage of genome covered.
Figure 1. Strategy for Assessing the Relationship between UCEs and Domains, Boundaries, and Loop Anchors.
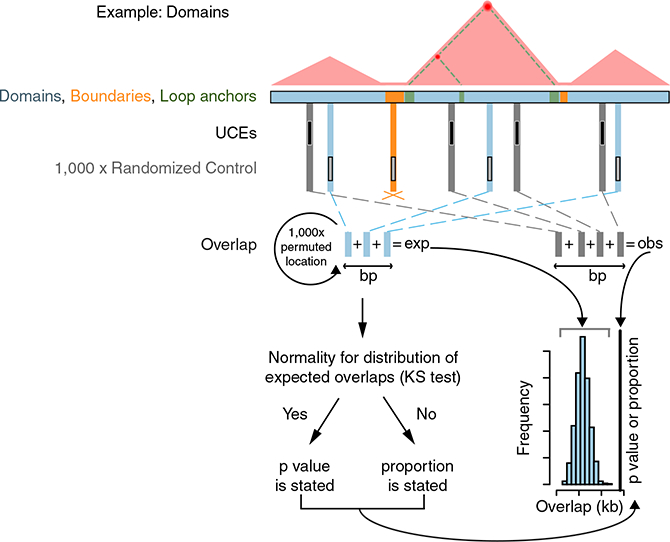
We assess the relationship of UCEs (black) to domains (blue), boundaries (orange), and loop anchors (green) via a multi-step process, illustrated here with respect to domains. Throughout this and other figures, blue, orange, and green refer to analyses related to domains, boundaries, and loop anchors, respectively. First, overlaps between UCEs and all domains in a dataset are summed to produce the observed overlap; as this example concerns domains, overlap between UCEs and boundaries are not tallied (orange cross). The observed overlap is then compared to a distribution of expected overlaps generated from the overlap of domains with each of 1,000 sets of control genomic sequences, matched to UCEs in number and length and randomly positioned in the genome. Finally, the distribution of the resulting 1,000 control overlaps is tested for normality using the Kolmogorov-Smirnov (KS) test, and when normality is observed, a Z-test p value is reported to describe the significance of the deviation of the observed overlap from the distribution of expected overlaps. If normality is not observed, the proportion of expected overlaps equal to, or more extreme than, the observed overlap is stated. See also Table S1 and S2.
We first analyzed ten datasets of domains, drawn from Dixon et al. (2012) and Rao et al. (2014), that examined nine human cell lines, whose origins spanned embryonic (human embryonic stem cell [hESC]) and fetal (IMR90 lung fibroblast) development, cancer (HeLa, K562, and KBM7), and differentiated tissues (GM12878, human mammary epithelial cell [HMEC], human umbilical vein endothelial cell [HUVEC], and normal human epidermal keratinocyte [NHEK]), with IMR90 studied by both Dixon et al. and Rao et al. and thus contributing two datasets (Table S1). The domains described by these datasets range in coverage from 83.2% of the genome for hESC domains from Dixon et al. (2012) to 40.1% for HMEC domains from Rao et al. (2014). Excitingly, we observed significant enrichment for UCEs within domains in eight out of ten datasets (4.22 × 10⁻¹⁵ ≤ p ≤ 0.020, 1.061 ≤ obs/exp ≤ 1.167; Table S2A); the two in which enrichment was not seen represented HMEC and NHEK cells from Rao et al. (2014) (Table S2A). Combining all ten datasets, which included merging overlapping regions, produced a dataset, called ‘‘pooled domains,’’ containing 293 regions covering 89.1% of the genome (Table S1) that is also significantly enriched for UCEs (p = 2.77 × 10⁻⁶, obs/exp = 1.025; Figure 2A; Table S2A). These results show that UCEs are overrepresented within Hi-C domains across many cell types, supporting the idea that there is an interrelationship between UCEs and three-dimensional chromosome conformation.
Figure 2. UCEs Are Enriched in Pooled Domains, Depleted from Pooled Boundaries, and Indifferent to Pooled Loop Anchors.
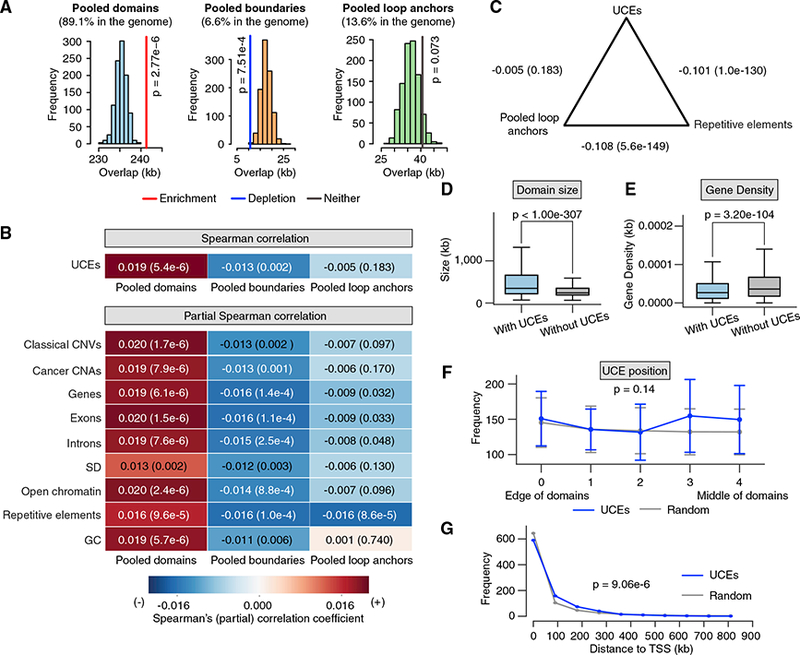
(A) In thecaseofpooled domains, theobserved overlap (colored vertical line) ofUCEs is significantlygreaterthanthe expected overlaps(red line; p = 2.76 × 10⁻⁶, obs/exp = 1.025). For pooled boundaries, the observed overlap is significantly below expectation (blue line; p = 7.51 × 10⁻⁴, obs/exp = 0.609). Observed overlap between UCEs and pooled loop anchors does not deviate significantly from expectation (gray line; p = 0.073, obs/exp = 1.124). Note that pooled domains may include pooled boundaries, because the boundaries of some cell types may be organized as domains in other cell types.
(B) Correlation analyses. Spearman correlation: using pairwise Spearman correlation and splitting the genome into 50-kb bins, the representation of UCEs is positively correlated with that of pooled domains (p = 5.4 × 10⁻⁶), negatively correlated with that of pooled boundaries (p = 0.002), and not significantly correlated with that of pooled loop anchors (p = 0.183). Partial Spearman correlation: the positive and negative correlations between the positions of UCEs and pooled domains (first column), and negative correlation between the positions ofUCEsand pooled boundaries (second column) remain significant even after accounting forthe correlation between the positions of UCEs and nine control genomic features. The representation of UCEs and pooled loop anchors (third column) is not significantly positively nor negatively correlated except when controlling for repetitive elements, explored in (C).
(C) Although UCEs and pooled loop anchors are not significantly correlated with each other (p = 0.183), pairwise correlation analyses of both UCEs and pooled loop anchorsshowahighlysignificant negative correlation with repetitiveelements (p=1.0 × 10−130 and p = 5.6 × 10−149, respectively). In (B) and (C), Spearman (partial) correlation coefficients are reported in each box and by a heatmap; p values are reported in parentheses.
(D and E) Domains containing UCEs are significantly larger (D) (p <1.00 × 10−307) and relatively gene sparse (E) (p = 3.20 × 10−104) as compared to domains without UCEs. p values were calculated by Mann-Whitney U test; box: interquartile range; whisker: 1.5 x interquartile range.
(F) UCEs are positioned roughly evenly across domains, with the distribution differing insignificantly from expectation (p = 0.14; K-S test; error bar: SD).
(G) UCEs are positioned further than expected from the nearest transcription start site (TSS) (p = 9.06 × 10⁻⁶; Anderson-Darling test).
We then examined datasets of boundaries from Dixon et al. (2012). These datasets, which represent hESC and IMR90 cells and cover 4.0% and 3.6% of the genome, respectively (Table S1), are significantly depleted of UCEs (p = 0.002, obs/exp = 0.516, and p = 0.025, obs/exp = 0.669, respectively; Table S2A; although for IMR90, the p value hovers at our significance cutoff). Merging the two datasets created a ‘‘pooled boundary’’ dataset, containing 3,715 regions and covering 6.6% of the genome (Table S1), that is also depleted for UCEs (p = 7.51 × 10⁻⁴, obs/exp = 0.609; Figure 2A; Table S2A). These findings reinforce our observation that UCEs do not commonly occur within Hi-C boundaries and complement our previous observation that UCEs preferentially occur within domains.
Our next analysis concerned eight datasets of loop anchors provided by Rao et al. and representing GM12878, HeLa, HMEC, HUVEC, IMR90, K562, KBM7, and NHEK cells, with genome coverage ranging from 2.3% to 5.9% (Table S2A). For all but two datasets, UCEs are neither enriched nor depleted (0.006 ≤ p ≤ 0.480, 0.710 ≤ obs/exp ≤ 1.334; Table S2A). Merging all eight datasets produced a dataset of ‘‘pooled loop anchors,’’ comprising 18,331 regions and covering 13.6% of the genome (Table S1), that is also neither enriched nor depleted for UCEs (p = 0.073, obs/exp = 1.124; Figure 2A; Table S2A). The overall lack of UCE enrichment in loop anchors is surprising, since many UCEs show enhancer-like properties (Bhatia et al., 2013; Lampe et al., 2008; McBride et al., 2011; Pauls et al., 2012; Pennacchio et al., 2006; Poitras et al., 2010; Poulin et al., 2005; Visel et al., 2008; Woolfe et al., 2005), and enhancer-promoter interactions have been proposed to generate loops (Rao et al., 2014). Indeed, we did observe enrichment of UCEs in two of the eight datasets, HUVEC (p = 0.020, obs/exp = 1.322; Table S2A) and NHEK (p = 0.006, obs/exp = 1.334; Table S2A), suggesting that UCEs might be particularly involved in loop anchors in endothelial and epidermal cell types (HUVEC and NHEK cells, respectively).
Relationships of UCEs to Hi-C Annotations Are Robust
Having revealed positional relationships between UCEs and domains, boundaries, and loop anchors, we examined whether these relationships are robust to co-correlation with nine other genomic features. These features, which can be considered controls, included six that were previously shown to be nonrandomly associated with UCE positions: copy number variants (CNVs), cancer-specific copy number alterations (CNAs), genes, exons, introns, and segmental duplications (SDs) (Chiang et al., 2008; Derti et al., 2006; McCole et al., 2014). They also included open chromatin, since UCEs have been linked to transcriptional activity (reviewed in Baira et al., 2008; Fabris and Calin, 2017; Harmston et al., 2013), repetitive elements, which UCEs avoid (Bejerano et al., 2004; Chiang et al., 2008; Derti et al., 2006; McCole et al., 2014), and GC content, which is associated with the positions of CNVs (Koren et al., 2012). We divided the genome into equally sized bins and, because domains and the nine control features span a vast range of sizes, our analyses involved multiple iterations using a range of bin sizes (20, 50, and 100 kb). Within each bin, the fraction of sequence occupied by each control feature was calculated, as was that of UCEs, except in the case of GC content, where it was calculated as the fraction of G + C (Experimental Procedures). Genome-wide correlations were then determined with respect to each control within each bin.
Using pairwise Spearman correlation coefficients and associated p values for the strength of correlation, we first determined that UCEs are significantly and positively associated with pooled domains (p = 5.4 × 10⁻⁶; Figure 2B), significantly negatively correlated with pooled boundaries (p = 0.002; Figure 2B), and not correlated with pooled loop anchors (p = 0.183; Figure 2B). These results correspond well to UCE enrichment, depletion, and neither enrichment in nor depletion from pooled domains, boundaries, and loops, respectively (Figure 2A). Then, using a partial correlation approach, we asked whether these correlations, or lack thereof, are influenced by co-correlation with any of the nine control genomic features. With a bin size of 50 kb, the correlation between UCEs and pooled domains remains significantly positive in all cases, indicating that it is robust to contributions from the control features (Figure 2B). Similarly, the negative correlation between UCEs and pooled boundaries remains robust to all control features (Figure 2B). As for pooled loop anchors, the correlation with UCEs is insignificant in all cases but one, consistent with UCEs being neither enriched nor depleted in pooled loop anchors (Figure 2B). The one exception pertains to repetitive elements, where the correlation is significantly negative. Investigating this further, we discovered a negative correlation between UCEs and repetitive elements (p = 1.0 × 10−130; Figure 2C), which is unsurprising, as UCEs are non-repetitive (Bejerano et al., 2004; Chiang et al., 2008; Derti et al., 2006) and avoid insertions of repetitive elements (Zhang et al., 2017). We also uncovered a strong negative correlation between pooled loop anchors and repetitive elements (p = 5.6 × 10−149; Figure 2C), which may again be expected as loop anchors are derived from Hi-C analyses that exclude reads from repetitive regions (Rao et al., 2014). Thus, while a significant negative correlation exists between UCEs and pooled loop anchors, it may be secondary to the strong negative correlation between repetitive elements and both UCEs and pooled loop anchors. Altering the sizes of the genomic bins to 20 kb (Figure S1A) and 100 kb (Figure S1B) produced very similar results. Taken together, the positioning of UCEs relative to domains, boundaries, and loop anchors is robust to co-correlation with nine other genomic features.
UCEs Occur Evenly across Large, Gene-Sparse Domains and Are Somewhat Distant from Transcription Start Sites
We next investigated the properties of domains containing UCEs. Considering all cell types together, we found that domains containing UCEs are larger than those without UCEs (p < 1.00 × 10−307; Figure 2D; Table S3A) and have a lower density of genes (p = 3.20 × 10−104; Figure 2E; Table S3C), with a distribution of UCEs being relatively even across domains and not significantly different to that of random control regions (Experimental Procedures) (p = 0.14; Figure 2F; Table S3E). Nevertheless, we found slightly fewer UCEs within 100 kb of the nearest transcription start site (TSS), but slightly more 100–300 kb from the nearest TSS, compared to within random control regions (p = 9.06 × 10⁻⁶; Figure 2G; Table S3G). With regard to domain size, gene density, UCE position, and distance from UCE to TSS (Table S3), the domains of individual cell types followed the trends observed for all domains combined, except for the domains of HUVEC and IMR90 cells as described by Rao et al. (2014), where UCEs tended to occupy the center of domains (Table S3E). In summary, UCEs are arranged roughly evenly across large, gene-sparse domains and are slightly distanced from TSSs, perhaps highlighting a potential role for UCEs in the maintenance of genome structure.
Positioning of UCEs within Hi-C Annotations Is Conserved between Human and Mouse
Since UCEs are defined by their extreme evolutionary conservation between species, we next asked whether the relationships observed between UCEs and domains, boundaries, and loop anchors in the human genome are conserved in the mouse genome. Accordingly, we turned to the 893 mouse orthologs (Table S2D) of our human UCEs and three Hi-C studies (Dixon et al., 2012; Fraser et al., 2015; Rao et al., 2014), addressing mouse embryonic stem cells (mESCs), blood (B-lymphoblasts), neuronal precursor cells (NPCs), post-mitotic neurons, and cortical tissue (Table S1). We found that the relationships of UCEs to domains, boundaries, and loop anchors are evolutionarily conserved. For domains, we examined six datasets covering between 29.0% (lymphoblasts from Rao et al.) and 92.5% of the genome (neurons from Fraser et al. [Table S1]). All six datasets are significantly enriched for UCEs (5.52 × 10⁻¹⁰ < p < 0.002; 1.020 < obs/exp < 1.260; Figure S1C; Table S2B), with domains containing UCEs being larger (p = 1.24 × 10−240; Table S3B), and more gene sparse (p = 1.37 × 10⁻¹³; Table S3D) as compared to domains without UCEs, recapitulating our findings for human domains. For boundaries, we examined a dataset described by Dixon et al. (2012) to be common to both mESC and cortex tissue and covering 8.1% of the genome, calling this dataset ‘‘mouse common boundaries” (Table S1). This dataset shows significant depletion for UCEs (p = 4.68 × 10⁻⁷, obs/exp = 0.452; Figure S1C; Table S2B). Finally, we examined one dataset representing loop anchors in lymphocytes from Rao et al. This dataset covers 2.2% of the genome (Table S1) and is neither enriched in nor depleted of UCEs (p = 0.090, obs/exp = 0.701; Figure S1C; Table S2B).
When UCEs Are Found in Boundaries and Loop Anchors, They Show an Excess of Exonic UCEs Associated with RNA Processing
Having established that UCEs are differentially associated with domains, boundaries, and loop anchors, we queried whether specific subsets of UCEs might be driving the associations. We examined intergenic, intronic, and exonic UCEs separately, since these subdivisions have behaved distinctly in our previous studies; for example, CNVs are more depleted for intergenic and intronic UCEs than for exonic UCEs (Chiang et al., 2008; Derti et al., 2006; McCole et al., 2014). First, we examined all of the individual datasets for domains as well as pooled domains and found that, in all cases, there is no significant deviation from expected in the observed proportions of intergenic, intronic, and exonic UCEs (0.131 ≤ Z p ≤ 0.892; Figure 3A; Tables S3A and S3B). That the proportions of UCEs in pooled domains are the same as those within the entire UCE dataset is not surprising, as pooled domains contain all 896 UCEs, including boundary UCEs, since boundaries in some cell types are organized as domains in other cell types.
Figure 3. Underrepresentation of Intronic and Intergenic UCEs in Pooled Boundaries and Loop Anchors Are Accompanied by Overrepresentation of Exonic UCEs.
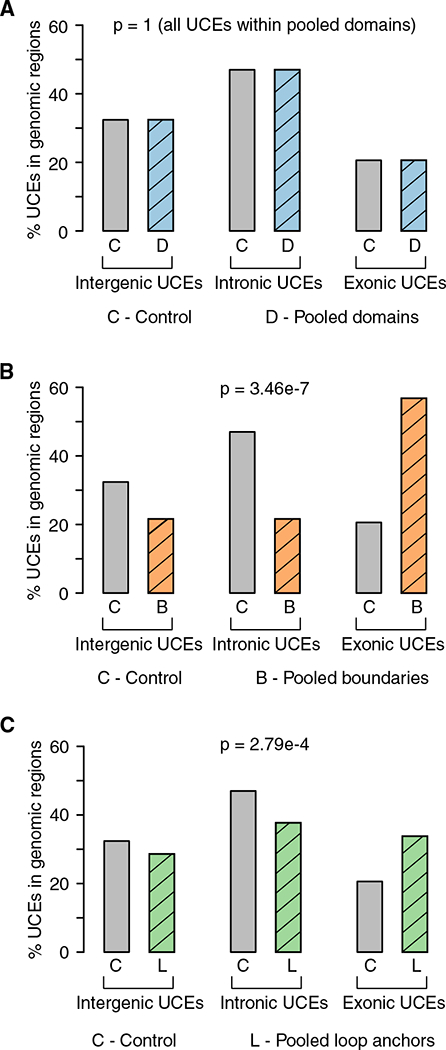
Proportions of intergenic, intronic, and exonic UCEs that overlap pooled domains (A, blue), boundaries (B, orange), and loop anchors (C, green) compared to the full set of 896 UCEs as a control (gray).
(A) Pooled domains that are not significantly different compared to the control set since all UCEs fall within pooled domains, so no p value is calculated.
(B and C) Pooled boundaries (B) (chi-square test, p = 3.46 × 10⁻⁷) and pooled loop anchors (C) (chi-square test, p = 2.79 × 10⁻⁴) both show a significant overrepresentation ofexonic UCEsand an underrepresentation ofintronic and intergenic UCEs, as compared with the full UCE set.
See also Figure S2 and S3 and Table S4 and S5.
For pooled boundaries, the distribution of intergenic, intronic, and exonic UCEs deviates significantly from that of the full set of UCEs (p = 3.46 × 10⁻⁷; Figure 3B; Table S4A). We found a depletion of intergenic and intronic UCEs, with 21.6% (8 out of 37) and 21.6% (8 out of 37), respectively, in boundaries, as compared to the expected 32.4% and 47.0%, respectively. In contrast, exonic UCEs are overrepresented, with 56.8% (21 out of 37) in pooled boundaries, while making up only 20.6% of all UCEs. The overrepresentation of exonic UCEs is especially striking since the majority (52.7%) of pooled boundary DNA is intronic (109 Mb), with only a small fraction (5.3%) being exonic (11 Mb) (p = 2.89 × 10−44; Experimental Procedures; Table S4C).
We also found significant deviation of the proportions of intergenic, intronic, and exonic UCEs in pooled loop anchors (p = 2.79 × 10⁻⁴; Figure 3C; Table S4A). Intergenic and intronic UCEs represent only 28.6% (44 out of 154) and 37.7% (58 out of 154) of UCEs, respectively, whereas 32.4% and 47.0% of the full UCE set are intergenic and intronic, respectively. As in pooled boundaries, exonic UCEs are overrepresented at 33.8% (52 out of 154) as compared to 20.6% of all UCEs. These proportions deviate significantly from expectation based on the sequence composition of pooled loop anchors, which is 47.0% intronic and only 5.02% exonic (p = 5.38 × 10−60; Table S4C). These results point to intronic, and, to some extent, intergenic, UCEs as drivers of depletion from pooled boundaries and to exonic UCEs as the dominant type of UCE within both pooled boundaries and loop anchors.
We next used the Genomic Regions Enrichment of Annotations Tool (GREAT) (McLean et al., 2010) and discovered that exonic UCEs in pooled boundaries and pooled loop anchors are enriched for gene ontology (GO) terms associated with RNA processing (Figures S2A and S2B), and this is in line with previous reports that exonic UCEs are associated with RNA processing, including splicing (Baira et al., 2008; Bejerano et al., 2004; Lareau and Brenner, 2015; Lareau et al., 2007; Lupiáñez et al., 2016; Ni et al., 2007; Pirnie et al., 2017; Rödelsperger et al., 2009). Considering further the structure of exonic UCEs themselves, we found that 76% (16 out of 21; Table S5A) and 82% (43 out of 52; Table S5B) of exonic UCEs in pooled boundaries and loop anchors, respectively, partially overlap in-trons and hence cover splice sites, as compared to 57% in the full set of exonic UCEs (107 out of 185; Table S2E). Thus, while exonic UCEs in pooled boundaries are not enriched for splice sites (p = 0.07; Table S5A), those in pooled loop anchors are (p = 1.82 × 10⁻⁴; Table S5B). These results suggest a two layered association of UCEs with RNA processing, whereby UCEs are associated with genes involved in RNA processing and UCEs may also help the splicing of these very same genes. This double association is particularly prominent in loop anchors, suggesting that UCEs in loop anchors may assist in particular splicing mechanisms.
UCEs within Domains That Are Shared in Many Cell Types Are Associated with Kidney-Related Processes
While domains vary between cell types, studies suggest that at least 50% are shared across cell types (Dixon et al., 2012; Fraser et al., 2015; Rao et al., 2014). Thus, we next focused on UCEs that occur within domains common across multiple cell types; these might address the functional significance underlying the enrichment of UCEs. We first identified 124 UCEs that overlap domains in all ten individual human datasets across diverse cell types (Table S1), calling these ‘‘human invariant domain UCEs’’ (Table S5C); such UCEs overlap between 30 and 51 domains depending on the individual dataset (Table S3A). For mouse, we identified 310 UCEs that overlap domains identified by all six mouse datasets (Table S1), calling these ‘‘mouse invariant domain UCEs’’ (Table S5D). Using GREAT, these human and mouse invariant domain UCEs were compared to the full UCE sets in humans and mouse, respectively, revealing a surprising association with kidney-related GO terms for human invariant domain UCEs (Figure S3A). Terms related to kidney biology were also obtained in the case of mouse UCEs, although, here, other terms were obtained as well, some with greater significance (Figure S3B). These findings are corroborated by the association with kidney-related processes, as well as neuronal development, of the 74 UCEs shared between the human and mouse invariant domain UCE datasets (Figures S3C and S3D; Table S5E). Interestingly, domains containing the 74 shared invariant domain UCEs were smaller and more gene rich than were all UCE-containing domains (p = 5.45 × 10⁻⁴ and p = 5.52 × 10⁻¹⁰, respectively; Tables S3A and S3C), suggesting that these domains may be functionally different from domains in general, perhaps with UCEs specifically involved in regulating kidney and neuronal development. Of note, a recent study has demonstrated that UCEs are required for normal brain development (Dickel et al., 2018). In brief, functions related to kidney and neuronal development might be a feature of UCEs within domains shared among diverse cell types.
DISCUSSION
Our findings reveal a non-random UCE distribution among three main arenas of three-dimensional genome organization, with UCEs being enriched in domains, depleted from boundaries, and indifferent to loop anchors (Figure 4). Furthermore, domains containing UCEs are larger and less gene rich than those without UCEs, and while UCEs are distributed relatively evenly across domains, they are slightly further away from TSS than expected, suggesting that UCEs may help maintain the structure of large domains in a role distinct from that of gene regulation. The UCEs that do occupy boundaries and loop anchors display an overrepresentation of exonic UCEs, and in loop anchors, those UCEs are enriched for overlap with splice sites, suggesting a specific involvement of loop anchors containing UCEs in splicing. With respect to UCEs in domains that do not vary between cell types, they are, as a group, significantly associated with kidney-related and neuronal gene ontologies.
Figure 4. Schematic Representation Summarizing the Relationship between Chromosome Organization and UCEs.
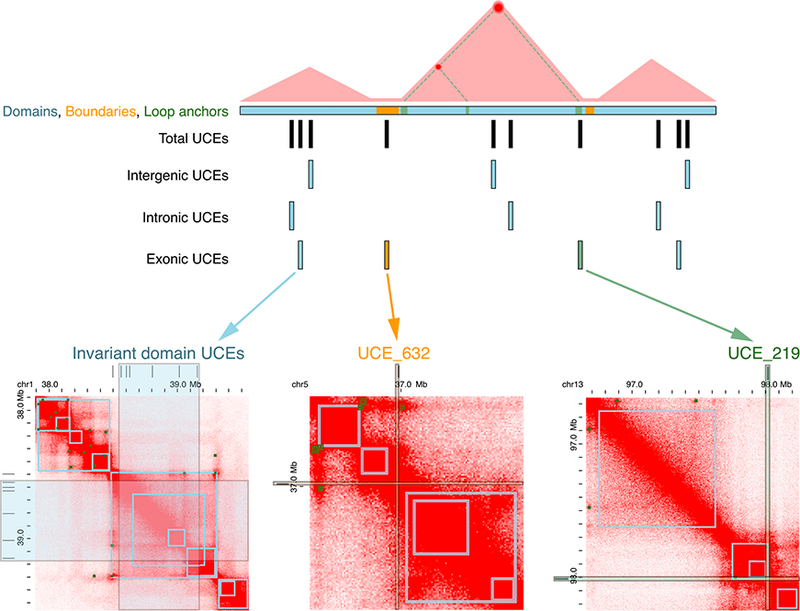
Top, domains (blue) are enriched in UCEs, boundaries (orange) are depleted, and loop anchors (green) are neither enriched nor depleted. Bottom, examples of UCEs in each ofthethreegenomicfeatures asdefined by Hi-C annotation ofhuman GM12878 cells(Rao etal., 2014) using theJuiceboxtool (Durand et al., 2016). Left, invariant domain UCEs; middle, UCE in a boundary; right, UCE in a loop anchor. Domain and loop anchorcalls (squares in gray outline) are indicated on the heatmaps as available in Juicebox (Durand et al., 2016). Numbers of UCEs are not representative of their true occupancies.
These findings tying UCEs to genome organization are especially intriguing in light of the proposal that UCEs may contribute to genome integrity through yet another potent organizational feature of genomes—allelic and homolog pairing (Chiang et al., 2008; Derti et al., 2006; Kritsas et al., 2012; McCole et al., 2014; Vavouri et al., 2007). Indeed, they raise the question of whether UCEs contribute to the establishment of domains, and/or whether the evolution of a domain promotes the fixation of UCEs within the domain. Consistent with this, Harmston et al. (2017) recently reported that clusters of CNEs predict the span of domains, suggesting that CNEs might be involved in chromatin folding. For example, since some UCEs embody enhancer activity (Bejerano et al., 2004; Bhatia et al., 2013; Lampe et al., 2008; McBride et al., 2011; Pauls et al., 2012; Pennacchio et al., 2006; Poitras et al., 2010; Poulin et al., 2005; Sandelin et al., 2004; Vavouri et al., 2007; Visel et al., 2008; War-nefors et al., 2016; Woolfe et al., 2005) and, thus, are likely to participate in enhancer-promoter interactions, might that activity help define chromosomal contacts? Separately, but not exclusively, might selection against changes that disrupt chromosomal domains promote sequence invariance and, thus, ultraconservation? Specifically, if, as we have proposed (Chiang et al., 2008; Derti et al., 2006; McCole et al., 2014), rearrangements that disrupt the pairing of allelic UCEs are culled, then UCEs will contribute to the structural invariance of genomic regions in which they lie. In this way, UCEs may have enhanced the capacity of certain regions to evolve the intra-regional contacts that, today, define contact domains.
The strong association of invariant domain UCEs with kidney-related and neuronal GO categories was intriguing and merits further exploration. In this light, it may be noteworthy that evolution of the kidney has been argued to be an early defining process in the emergence of vertebrates (Ditrich, 2007). If so, that evolution may have benefitted from the genome stability provided by UCEs.
Our studies have also shown that, while boundaries are generally depleted of UCEs, 21 of the 37 UCEs found in boundaries are exonic, constituting an enrichment of exonic UCEs in boundaries. Of the 21 boundary exonic UCEs, two (UCEs 632 and 633) are in the NIPBL gene, which is a cohesin loading factor that, when mutated, leads to a developmental disorder known as Cornelia de Lange syndrome (Strachan, 2005). Given that cohesin binding is implicated in sister chromatid cohesion and gene expression (Merkenschlager, 2010; Merkenschlager and Odom, 2013), ultraconservation within NIPBL may speak to this gene’s importance in genome structure and function. Indeed, a recent study demonstrated that depletion of NIPBL in mouse affects reorganization of chromosome folding (Schwarzer et al., 2017). Furthermore, the evolutionarily conserved position of the NIPBL gene within boundaries may suggest that the lack of three-dimensional associations across a boundary may also be important for its expression.
Turning to loop anchors, their lack of enrichment in UCEs chimes with other findings arguing that loops are evolutionarily dynamic (Vietri Rudan et al., 2015). Their dynamic nature is consistent with the malleability of enhancers over evolutionary time and thus, also, of enhancer-promoter interactions, both of which make the lack of enrichment for UCEs in loop anchors unsurprising. Indeed, unconstrained enhancers may more easily accommodate tissue-specific (Lonfat et al., 2014) or even species-specific regulatory programs (Vietri Rudan et al., 2015).
To conclude, our data describe the pattern of relationships between ultraconservation of DNA sequence and three types of chromosome organization, with domains enriched in UCEs, boundaries being depleted, and loops being neither enriched nor depleted. More generally, they illustrate how different structural arenas of genome organization display distinct degrees of flexibility or stability over evolutionary timescales, as measured by ultraconservation.
EXPERIMENTAL PROCEDURES
Depletion or Enrichment Analysis of UCEs in Specific Genomic Regions
The enrichment or depletion of UCEs in genomic regions of interest such as domains, boundaries, and loop anchors was assessed using established methods previously reported in our publications (Chiang et al., 2008; Derti et al., 2006; McCole et al., 2014). Briefly, observed overlap between UCEs and regions of interest were compared to a distribution of expected overlaps produced using 1,000 randomized sets of elements that match UCEs in number and length. Deviation of the observed overlap from the expected overlaps is indicated by the obs/exp ratio, and statistical significance was determined by a Z-test where appropriate.
Correlation Analyses
The genome was divided into bins of equal sizes. Within each bin, the fraction of sequence occupied by each control feature was calculated, as was that of UCEs, except in the case of GC content, where it was calculated as the fraction of G + C. Then genome-wide correlations within each bin were preformed among feature densities or GC content. The Spearman correlation coefficients and matching p values were provided.
Analyses of Domains Containing UCEs
Custom scripts were used to calculate metrics and p values for domain size, gene density (Mann-Whitney U test), UCE position within domains (K-S test), and distances to the nearest TSS (Anderson Darling test). Expected distributions were defined using 100 sets of regions matched to UCE number and position generated as for Depletion or Enrichment Analysis of UCEs in Specific Genomic Regions.
Distribution of Intergenic, Intronic, and Exonic UCEs That Overlap Domains, Boundaries, and Loop Anchors
The distribution of intergenic, intronic, and exonic UCEs that overlap feature of interest, i.e., either domains, boundaries, or loop anchors (reported in Table S2A), was compared to the full set of 896 UCEs using a χ2 test.
To determine the proportions of domains, boundaries, and loop anchors that are intergenic, intronic, and exonic, the overlap between two features (i.e., intergenic regions in domains) was calculated using bedtools intersect (Quinlan and Hall, 2010).
Scripts
Custom scripts associated with this study are available at https://github.com/rmccole/UCEs_genome_organization.
Supplementary Material
Highlights.
UCEs are enriched in domains, depleted from boundaries, and neither at loop anchors
UCEs in domains shared across cell types are linked to kidney and neuronal processes
UCEs that do occur in boundaries and loop anchors are predominantly exonic
UCEs that are present in loop anchors are enriched in splice sites
ACKNOWLEDGMENTS
We thank Brian J. Beliveau, Chamith Y. Fonseka, Roxana Tarnita, Kaia Mattioli, Tommy Tullius, and all members of the Wu laboratory for valuable and insightful discussions. We apologize to authors whose work we could not cite due to length restrictions. This work was supported by a William Randolph Hearst Foundation grant to R.B.M., an EMBO Long-Term Fellowship (ALTF 1862014) to J.E., and awards to C.-t.W. from NIH (DP1GM106412, R01GM123289–01, and R01HD091797) and Harvard Medical School.
Footnotes
SUPPLEMENTAL INFORMATION
Supplemental Information includes Supplemental Experimental Procedures, three figures, and five tables and can be found with this article online at https://doi.org/10.1016/j.celrep.2018.06.031.
DECLARATION OF INTERESTS
The authors declare no competing interests.
REFERENCES
- Baira E, Greshock J, Coukos G, and Zhang L (2008). Ultraconserved elements: genomics, function and disease. RNA Biol. 5, 132–134. [DOI] [PubMed] [Google Scholar]
- Bejerano G, Pheasant M, Makunin I, Stephen S, Kent WJ, Mattick JS, and Haussler D (2004). Ultraconserved elements in the human genome. Science 304, 1321–1325. [DOI] [PubMed] [Google Scholar]
- Bhatia S, Bengani H, Fish M, Brown A, Divizia MT, de Marco R, Dam-ante G, Grainger R, van Heyningen V, and Kleinjan DA (2013). Disruption of autoregulatory feedback by a mutation in a remote, ultraconserved PAX6 enhancer causes aniridia. Am. J. Hum. Genet 93, 1126–1134. [DOI] [PMC free article] [PubMed] [Google Scholar]
- Bonev B, and Cavalli G (2016). Organization and function of the 3D genome. Nat. Rev. Genet 17, 661–678. [DOI] [PubMed] [Google Scholar]
- Chiang CW, Derti A, Schwartz D, Chou MF, Hirschhorn JN, and Wu CT (2008). Ultraconserved elements: analyses of dosage sensitivity, motifs and boundaries. Genetics 180, 2277–2293. [DOI] [PMC free article] [PubMed] [Google Scholar]
- Corces MR, and Corces VG (2016). The three-dimensional cancer genome. Curr. Opin. Genet. Dev 36, 1–7. [DOI] [PMC free article] [PubMed] [Google Scholar]
- Dekker J, Rippe K, Dekker M, and Kleckner N (2002). Capturing chromosome conformation. Science 295, 1306–1311. [DOI] [PubMed] [Google Scholar]
- Denker A, and de Laat W (2016). The second decade of 3C technologies: detailed insights into nuclear organization. Genes Dev. 30, 1357–1382. [DOI] [PMC free article] [PubMed] [Google Scholar]
- Derti A, Roth FP, Church GM, and Wu CT (2006). Mammalian ultracon-served elements are strongly depleted among segmental duplications and copy number variants. Nat. Genet 38, 1216–1220. [DOI] [PubMed] [Google Scholar]
- Dickel DE, Ypsilanti AR, Pla R, Zhu Y, Barozzi I, Mannion BJ, Khin YS, Fukuda-Yuzawa Y, Plajzer-Frick I, Pickle CS, et al. (2018). Ultraconserved enhancers are required for normal development. Cell 172, 491–499.e15. [DOI] [PMC free article] [PubMed] [Google Scholar]
- Dimitrieva S, and Bucher P (2012). Genomic context analysis reveals dense interaction network between vertebrate ultraconserved non-coding elements. Bioinformatics 28, i395–i401. [DOI] [PMC free article] [PubMed] [Google Scholar]
- Ditrich H (2007). The origin of vertebrates: a hypothesis based on kidney development. Zool. J. Linn. Soc 150, 435–441. [Google Scholar]
- Dixon JR, Selvaraj S, Yue F, Kim A, Li Y, Shen Y, Hu M, Liu JS, and Ren B (2012). Topological domains in mammalian genomes identified by analysis of chromatin interactions. Nature 485, 376–380. [DOI] [PMC free article] [PubMed] [Google Scholar]
- Dixon JR, Gorkin DU, and Ren B (2016). Chromatin domains: the unit of chromosome organization. Mol. Cell 62, 668–680. [DOI] [PMC free article] [PubMed] [Google Scholar]
- Dong X, Fredman D, and Lenhard B (2009). Synorth: exploring the evolution of synteny and long-range regulatory interactions in vertebrate genomes. Genome Biol. 10, R86. [DOI] [PMC free article] [PubMed] [Google Scholar]
- Durand NC, Robinson JT, Shamim MS, Machol I, Mesirov JP, Lander ES, and Aiden EL (2016). Juicebox provides a visualization system for Hi-C contact maps with unlimited zoom. Cell Syst. 3, 99–101. [DOI] [PMC free article] [PubMed] [Google Scholar]
- Elgar G, and Vavouri T (2008). Tuning in to the signals: noncoding sequence conservation in vertebrate genomes. Trends Genet. 24, 344–352. [DOI] [PubMed] [Google Scholar]
- Fabris L, and Calin GA (2017). Understanding the genomic ultraconservations: T-UCRs and cancer. Int. Rev. Cell Mol. Biol 333, 159–172. [DOI] [PubMed] [Google Scholar]
- Fraser J, Ferrai C, Chiariello AM, Schueler M, Rito T, Laudanno G, Bar-bieri M, Moore BL, Kraemer DC, Aitken S, et al. ; FANTOM Consortium (2015). Hierarchical folding and reorganization of chromosomes are linked to transcriptional changes in cellular differentiation. Mol. Syst. Biol 11, 852. [DOI] [PMC free article] [PubMed] [Google Scholar]
- Harmston N, Baresic A, and Lenhard B (2013). The mystery of extreme non-coding conservation. Philos. Trans. R. Soc. Lond. B Biol. Sci 368, 20130021. [DOI] [PMC free article] [PubMed] [Google Scholar]
- Harmston N, Ing-Simmons E, Tan G, Perry M, Merkenschlager M, and Lenhard B (2017). Topologically associating domains are ancient features that coincide with Metazoan clusters of extreme noncoding conservation. Nat. Commun 8, 441. [DOI] [PMC free article] [PubMed] [Google Scholar]
- Hnisz D, Weintraub AS, Day DS, Valton AL, Bak RO, Li CH, Goldmann J, Lajoie BR, Fan ZP, Sigova AA, et al. (2016). Activation of proto-oncogenes by disruption of chromosome neighborhoods. Science 351, 1454–1458. [DOI] [PMC free article] [PubMed] [Google Scholar]
- Irimia M, Tena JJ, Alexis MS, Fernandez-Miñan A, Maeso I, Bogda-novic O, de la Calle-Mustienes E, Roy SW, Gómez-Skarmeta JL, and Fraser HB (2012). Extensive conservation of ancient microsynteny across metazoans due to cis-regulatory constraints. Genome Res. 22, 2356–2367. [DOI] [PMC free article] [PubMed] [Google Scholar]
- Joyce EF, Erceg J, and Wu CT (2016). Pairing and anti-pairing: a balancing act in the diploid genome. Curr. Opin. Genet. Dev 37, 119–128. [DOI] [PMC free article] [PubMed] [Google Scholar]
- Kikuta H, Laplante M, Navratilova P, Komisarczuk AZ, Engström PG, Fredman D, Akalin A, Caccamo M, Sealy I, Howe K, et al. (2007). Genomic regulatory blocks encompass multiple neighboring genes and maintain conserved synteny in vertebrates. Genome Res. 17, 545–555. [DOI] [PMC free article] [PubMed] [Google Scholar]
- Koeman JM, Russell RC, Tan MH, Petillo D, Westphal M, Koelzer K, Metcalf JL, Zhang Z, Matsuda D, Dykema KJ, et al. (2008). Somatic pairing of chromosome 19 in renal oncocytoma is associated with deregulated EGLN2-mediated [corrected] oxygen-sensing response. PLoS Genet. 4, e1000176. [DOI] [PMC free article] [PubMed] [Google Scholar]
- Koren A, Polak P, Nemesh J, Michaelson JJ, Sebat J, Sunyaev SR, and McCarroll SA (2012). Differential relationship of DNA replication timing to different forms of human mutation and variation. Am. J. Hum. Genet 91, 1033–1040. [DOI] [PMC free article] [PubMed] [Google Scholar]
- Kritsas K, Wuest SE, Hupalo D, Kern AD, Wicker T, and Grossniklaus U (2012). Computational analysis and characterization of UCE-like elements (ULEs) in plant genomes. Genome Res. 22, 2455–2466. [DOI] [PMC free article] [PubMed] [Google Scholar]
- Kushawah G, and Mishra RK (2017). Ultraconserved sequences associated with HoxD cluster have strong repression activity. Genome Biol. Evol 9,2049–2054. [DOI] [PMC free article] [PubMed] [Google Scholar]
- Lampe X, Samad OA, Guiguen A, Matis C, Remacle S, Picard JJ, Rijli FM, and Rezsohazy R (2008). An ultraconserved Hox-Pbx responsive element resides in the coding sequence of Hoxa2 and is active in rhombomere 4. Nucleic Acids Res. 36, 3214–3225. [DOI] [PMC free article] [PubMed] [Google Scholar]
- Lareau LF, and Brenner SE (2015). Regulation of splicing factors by alternative splicing and NMD is conserved between kingdoms yet evolutionarily flexible. Mol. Biol. Evol 32, 1072–1079. [DOI] [PMC free article] [PubMed] [Google Scholar]
- Lareau LF, Inada M, Green RE, Wengrod JC, and Brenner SE (2007). Unproductive splicing of SR genes associated with highly conserved and ultra-conserved DNA elements. Nature 446, 926–929. [DOI] [PubMed] [Google Scholar]
- Liu C, and Weigel D (2015). Chromatin in 3D: progress and prospects for plants. Genome Biol. 16, 170. [DOI] [PMC free article] [PubMed] [Google Scholar]
- Lonfat N, Montavon T, Darbellay F, Gitto S, and Duboule D (2014). Convergent evolution of complex regulatory landscapes and pleiotropy at Hox loci. Science 346, 1004–1006. [DOI] [PubMed] [Google Scholar]
- Lupiáñez DG, Spielmann M, and Mundlos S (2016). Breaking TADs: how alterations of chromatin domains result in disease.TrendsGenet. 32,225–237. [DOI] [PubMed] [Google Scholar]
- Martínez F, Monfort S, Roselló M, Oltra S, Blesa D, Quiroga R, Mayo S, and Orellana C (2010). Enrichment of ultraconserved elements among genomic imbalances causing mental delay and congenital anomalies. BMC Med. Genomics 3, 54. [DOI] [PMC free article] [PubMed] [Google Scholar]
- McBride DJ, Buckle A, van Heyningen V, and Kleinjan DA (2011). DNaseI hypersensitivity and ultraconservation reveal novel, interdependent long-range enhancers at the complex Pax6 cis-regulatory region. PLoS One 6, e28616. [DOI] [PMC free article] [PubMed] [Google Scholar]
- McCole RB, Fonseka CY, Koren A, and Wu CT (2014). Abnormal dosage of ultraconserved elements is highly disfavored in healthy cells but not cancer cells. PLoS Genet. 10, e1004646. [DOI] [PMC free article] [PubMed] [Google Scholar]
- McLean CY, Bristor D, Hiller M, Clarke SL, Schaar BT, Lowe CB, Wenger AM, and Bejerano G (2010). GREAT improves functional interpretation of cis-regulatory regions. Nat. Biotechnol 28, 495–501. [DOI] [PMC free article] [PubMed] [Google Scholar]
- Merkenschlager M (2010). Cohesin: a global player in chromosome biology with local ties to gene regulation. Curr. Opin. Genet. Dev 20, 555–561. [DOI] [PubMed] [Google Scholar]
- Merkenschlager M, and Odom DT (2013). CTCF and cohesin: linking gene regulatory elements with their targets. Cell 152, 1285–1297. [DOI] [PubMed] [Google Scholar]
- Ni JZ, Grate L, Donohue JP, Preston C, Nobida N, O’Brien G, Shiue L, Clark TA, Blume JE, and Ares M Jr. (2007). Ultraconserved elements are associated with homeostatic control of splicing regulators by alternative splicing and nonsense-mediated decay. Genes Dev. 21, 708–718. [DOI] [PMC free article] [PubMed] [Google Scholar]
- Nora EP, Lajoie BR, Schulz EG, Giorgetti L, Okamoto I, Servant N, Piolot T,van Berkum NL, Meisig J, Sedat J, et al. (2012). Spatial partitioning of the regulatory landscape of the X-inactivation centre. Nature 485, 381–385. [DOI] [PMC free article] [PubMed] [Google Scholar]
- Pauls S, Smith SF, and Elgar G (2012). Lens development depends on a pair of highly conserved Sox21 regulatory elements. Dev. Biol 365, 310–318. [DOI] [PMC free article] [PubMed] [Google Scholar]
- Pennacchio LA, Ahituv N, Moses AM, Prabhakar S, Nobrega MA, Shoukry M, Minovitsky S, Dubchak I, Holt A, Lewis KD, et al. (2006). In vivo enhancer analysis of human conserved non-coding sequences. Nature 444, 499–502. [DOI] [PubMed] [Google Scholar]
- Pirnie SP, Osman A, Zhu Y, and Carmichael GG (2017). An ultraconserved element (UCE) controls homeostatic splicing of ARGLU1 mRNA. Nucleic Acids Res. 45, 3473–3486. [DOI] [PMC free article] [PubMed] [Google Scholar]
- Poitras L, Yu M, Lesage-Pelletier C, Macdonald RB, Gagné JP, Hatch G, Kelly I, Hamilton SP, Rubenstein JL, Poirier GG, and Ekker M (2010). An SNP in an ultraconserved regulatory element affects Dlx5/Dlx6 regulation in the forebrain. Development 137, 3089–3097. [DOI] [PMC free article] [PubMed] [Google Scholar]
- Polychronopoulos D, Sellis D, and Almirantis Y (2014). Conserved noncoding elements follow power-law-like distributions in several genomes as a result of genome dynamics. PLoS One 9, e95437. [DOI] [PMC free article] [PubMed] [Google Scholar]
- Polychronopoulos D, Athanasopoulou L, and Almirantis Y (2016). Fractality and entropic scaling in the chromosomal distribution of conserved noncoding elements in the human genome. Gene 584, 148–160. [DOI] [PubMed] [Google Scholar]
- Polychronopoulos D, King JWD, Nash AJ, Tan G, and Lenhard B (2017). Conserved non-coding elements: developmental gene regulation meets genome organization. Nucleic Acids Res. 45, 12611–12624. [DOI] [PMC free article] [PubMed] [Google Scholar]
- Poulin F, Nobrega MA, Plajzer-Frick I, Holt A, Afzal V, Rubin EM, and Pennacchio LA (2005). In vivo characterization of a vertebrate ultracon-served enhancer. Genomics 85, 774–781. [DOI] [PubMed] [Google Scholar]
- Quinlan AR, and Hall IM (2010). BEDTools: a flexible suite of utilities for comparing genomic features. Bioinformatics 26, 841–842. [DOI] [PMC free article] [PubMed] [Google Scholar]
- Rao SS, Huntley MH, Durand NC, Stamenova EK, Bochkov ID, Robinson JT, Sanborn AL, Machol I, Omer AD, Lander ES, and Aiden EL (2014). A 3D map of the human genome at kilobase resolution reveals principles of chromatin looping. Cell 159, 1665–1680. [DOI] [PMC free article] [PubMed] [Google Scholar]
- Robyr D, Friedli M, Gehrig C, Arcangeli M, Marin M, Guipponi M, Far-inelli L, Barde I, Verp S, Trono D, and Antonarakis SE (2011). Chromo some conformation capture uncovers potential genome-wide interactions between human conserved non-coding sequences. PLoS One 6, e17634. [DOI] [PMC free article] [PubMed] [Google Scholar]
- Rödelsperger C, Köhler S, Schulz MH, Manke T, Bauer S, and Robinson PN (2009). Short ultraconserved promoter regions delineate a class of preferentially expressed alternatively spliced transcripts. Genomics 94, 308–316. [DOI] [PubMed] [Google Scholar]
- Sandelin A, Bailey P, Bruce S, Engström PG, Klos JM, Wasserman WW, Ericson J, and Lenhard B (2004). Arrays of ultraconserved non-coding regions span the loci of key developmental genes in vertebrate genomes. BMC Genomics 5, 99. [DOI] [PMC free article] [PubMed] [Google Scholar]
- Schwarzer W, Abdennur N, Goloborodko A, Pekowska A, Fudenberg G, Loe-Mie Y, Fonseca NA, Huber W, H Haering C, Mirny L, and Spitz F (2017). Two independent modes of chromatin organization revealed by cohe-sin removal. Nature 551, 51–56. [DOI] [PMC free article] [PubMed] [Google Scholar]
- Sexton T, Yaffe E, Kenigsberg E, Bantignies F, Leblanc B, Hoichman M, Parrinello H, Tanay A, and Cavalli G (2012). Three-dimensional folding and functional organization principles of the Drosophila genome. Cell 148, 458–472. [DOI] [PubMed] [Google Scholar]
- Strachan T (2005). Cornelia de Lange syndrome and the link between chromosomal function, DNA repair and developmental gene regulation. Curr. Opin. Genet. Dev 15, 258–264. [DOI] [PubMed] [Google Scholar]
- Sun H, Skogerbø G, and Chen R (2006). Conserved distances between vertebrate highly conserved elements. Hum. Mol. Genet 15, 2911–2922. [DOI] [PubMed] [Google Scholar]
- Sun H, Skogerbo G, Zheng X, Liu W, and Li Y (2009). Genomic regions with distinct genomic distance conservation in vertebrate genomes. BMC Genomics 10, 133. [DOI] [PMC free article] [PubMed] [Google Scholar]
- Valton AL, and Dekker J (2016). TAD disruption as oncogenic driver. Curr. Opin. Genet. Dev. 36, 34–40. [DOI] [PMC free article] [PubMed] [Google Scholar]
- Vavouri T, Walter K, Gilks WR, Lehner B, and Elgar G (2007). Parallel evolution of conserved non-coding elements that target a common set of developmental regulatory genes from wormsto humans. Genome Biol. 8, R15. [DOI] [PMC free article] [PubMed] [Google Scholar]
- Vietri Rudan M, Barrington C, Henderson S, Ernst C, Odom DT, Tanay A, and Hadjur S (2015). Comparative Hi-C reveals that CTCF underlies evolution of chromosomal domain architecture. Cell Rep. 10, 1297–1309. [DOI] [PMC free article] [PubMed] [Google Scholar]
- Visel A, Prabhakar S, Akiyama JA, Shoukry M, Lewis KD, Holt A, Plajzer-Frick I, Afzal V, Rubin EM, and Pennacchio LA (2008). Ultraconservation identifies a small subset of extremely constrained developmental enhancers. Nat. Genet 40, 158–160. [DOI] [PMC free article] [PubMed] [Google Scholar]
- Warnefors M, Hartmann B, Thomsen S, and Alonso CR (2016). Combinatorial gene regulatory functions underlie ultraconserved elements in Drosophila. Mol. Biol. Evol 33, 2294–2306. [DOI] [PMC free article] [PubMed] [Google Scholar]
- Weischenfeldt J, Dubash T, Drainas AP, Mardin BR, Chen Y, StiLtz AM, Waszak SM, Bosco G, Halvorsen AR, Raeder B, et al. (2017). Pan-cancer analysis of somatic copy-number alterations implicates IRS4 and IGF2 in enhancer hijacking. Nat. Genet 49, 65–74. [DOI] [PMC free article] [PubMed] [Google Scholar]
- Woolfe A, Goodson M, Goode DK, Snell P, McEwen GK, Vavouri T, Smith SF, North P, Callaway H, Kelly K, et al. (2005). Highly conserved non-coding sequences are associated with vertebrate development. PLoS Biol. 3, e7. [DOI] [PMC free article] [PubMed] [Google Scholar]
- Zhang Y, Li S, Abyzov A, and Gerstein MB (2017). Landscape and variation of novel retroduplications in 26 human populations. PLoS Comput. Biol 13, e1005567. [DOI] [PMC free article] [PubMed] [Google Scholar]
Associated Data
This section collects any data citations, data availability statements, or supplementary materials included in this article.